by Ferdio
All
Family
Input
Function
Shape
Search
Inspiration
About
100 visualizations
Instagram
X
Chart
Diagram
Geospatial
Plot
Table
X
X
Comparison
Concept visualization
Correlation
Distribution
Geolocation
Part to whole
Trend over time
X
X
Search for:
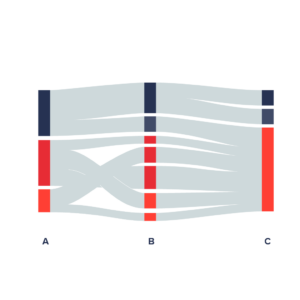
Alluvial Diagram
Sankey Diagram
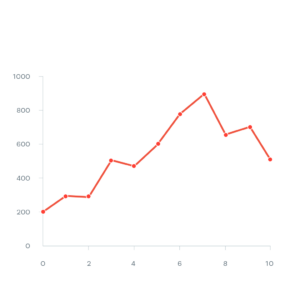
Line Graph
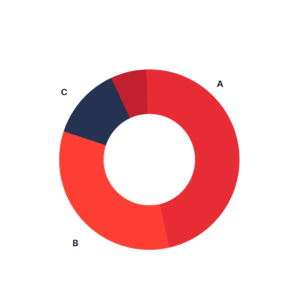
Donut Chart
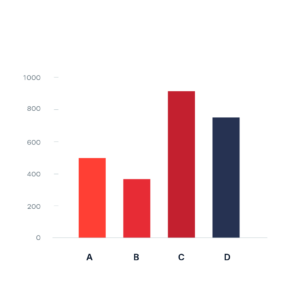
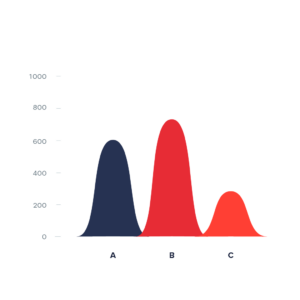
Bar Chart (Vertical)
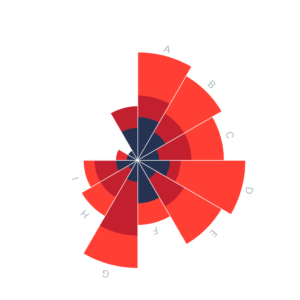
Polar Area Chart
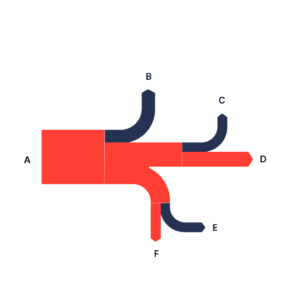
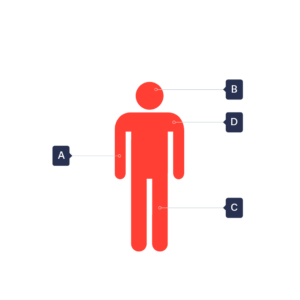
Exploded View Drawing
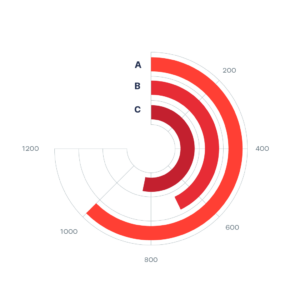
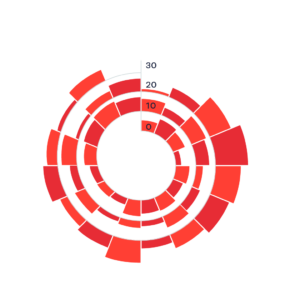
Radial Bar Chart
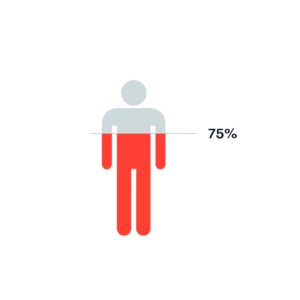
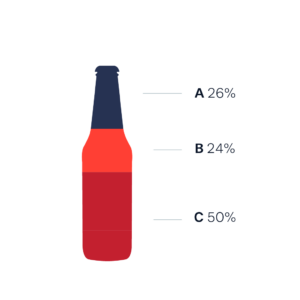
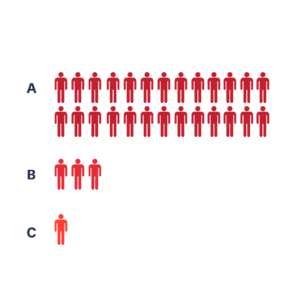
Pictorial Percentage Chart
Sunburst Diagram
Heat Map
Treemap
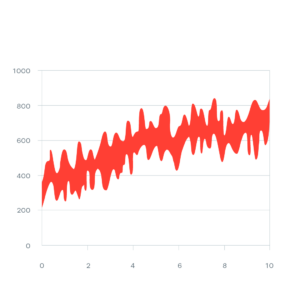
Radial Histogram
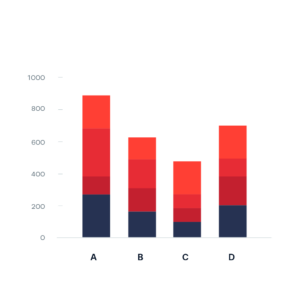
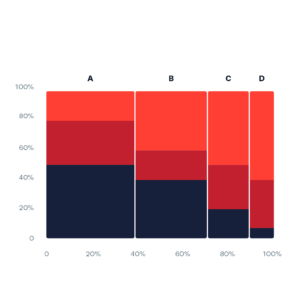
Stacked Bar Chart
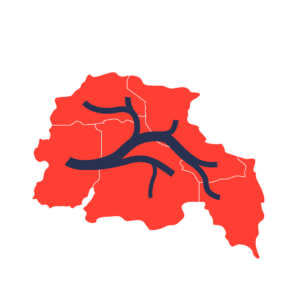
Flow Map
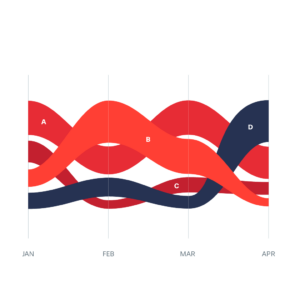
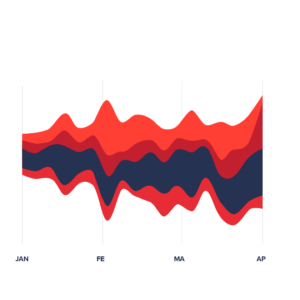
Sorted Stream Graph
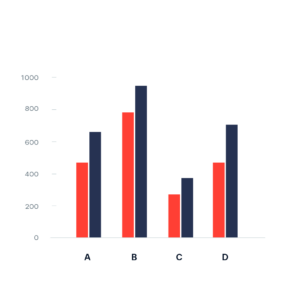
Grouped Bar Chart
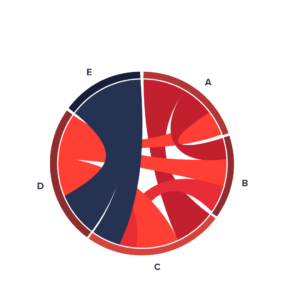
Chord Diagram
Pictorial Stacked Chart
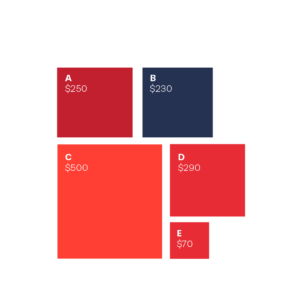
Proportional Area Chart (Square)
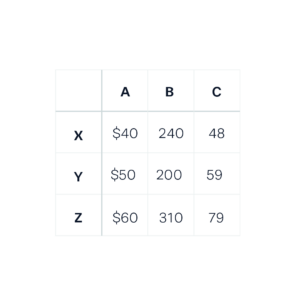
Table Chart
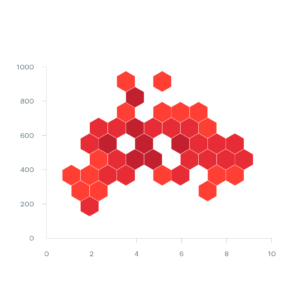
Hexagonal Binning
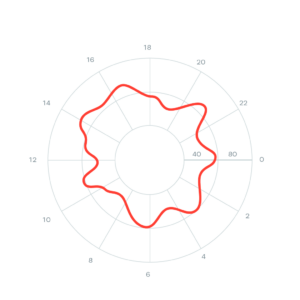
Radial Line Graph
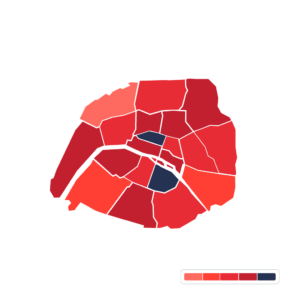
Choropleth Map
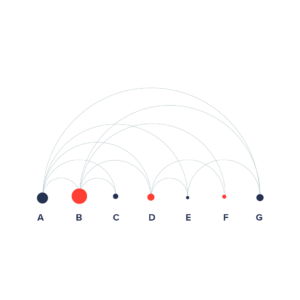
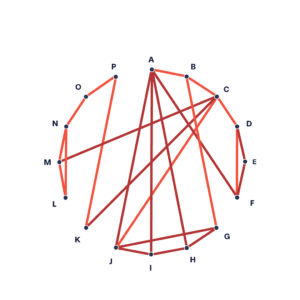
Arc Diagram
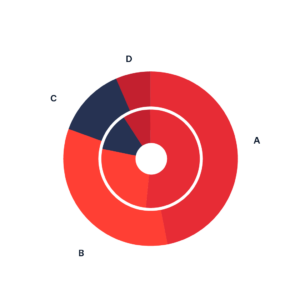
Multi-level Donut Chart
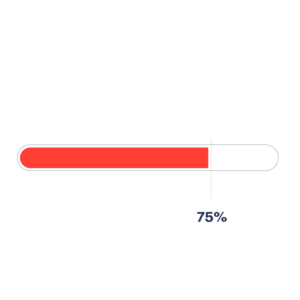
Progress Bar
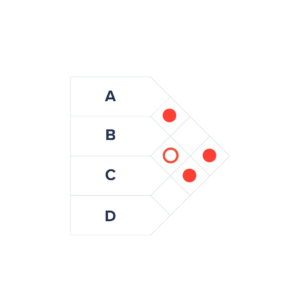
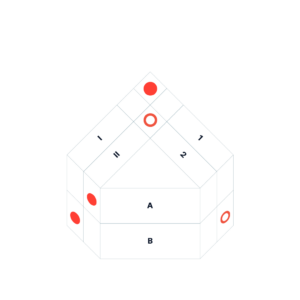
Matrix Diagram (Roof Shaped)
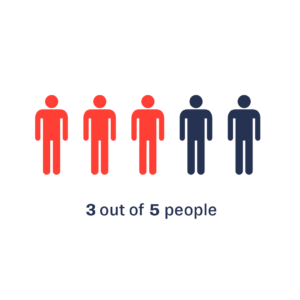
Pictorial Fraction Chart
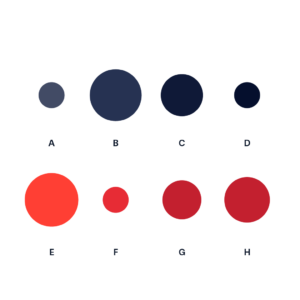
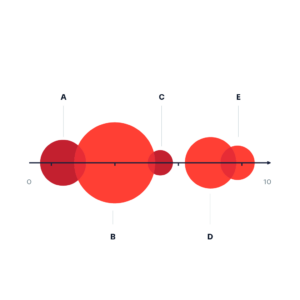
Proportional Area Chart (Circle)
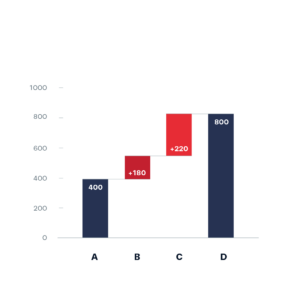
Waterfall Plot
Stream Graph
Hyperbolic Tree
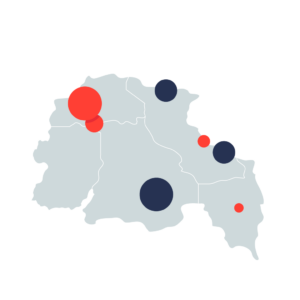
Bubble Map
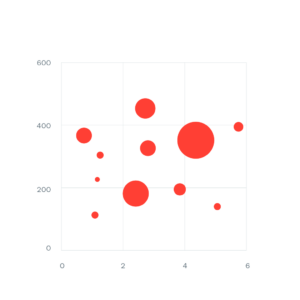
Bubble Chart
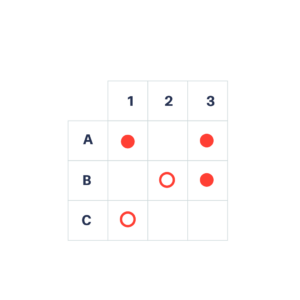
Matrix Diagram
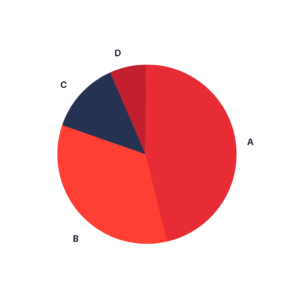
Pie Chart
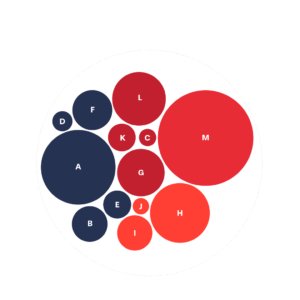
Packed Circle Chart
Word Cloud
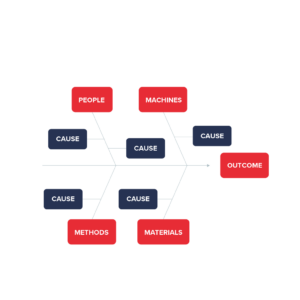
Fishbone Diagram
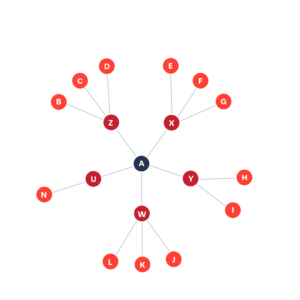
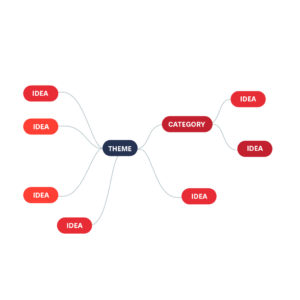
Mind Map
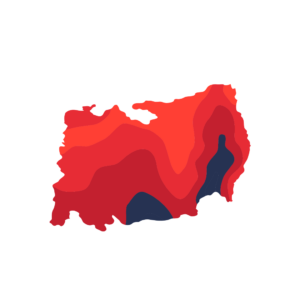
Isoline Map
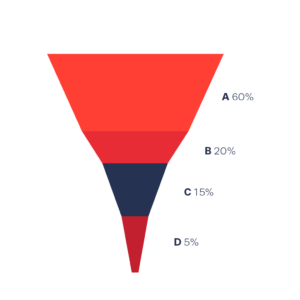
Funnel Chart
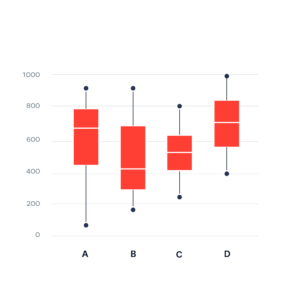
Boxplot
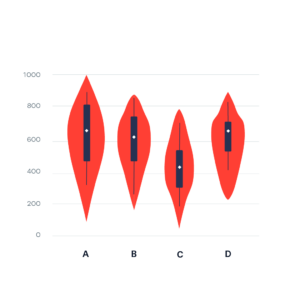
Violin Plot
Parallel Sets
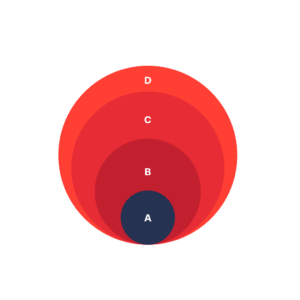
Nested Proportional Area Chart
Gantt Chart
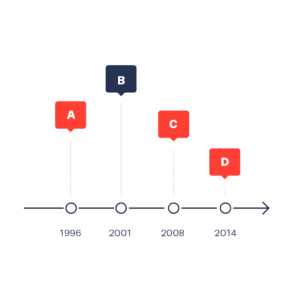
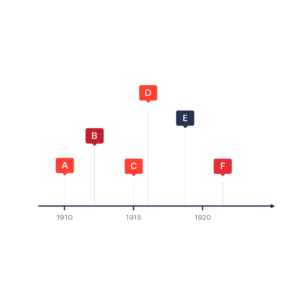
Timeline
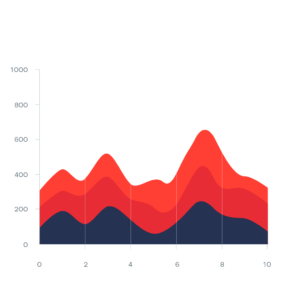
Stacked Area Chart
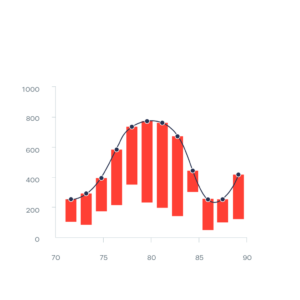
Hanging Rootogram
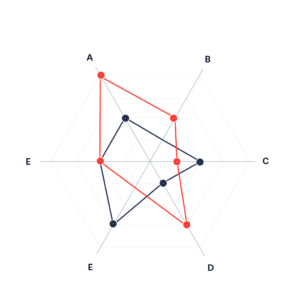
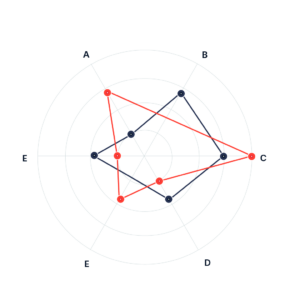
Radar Diagram
Hive Plot
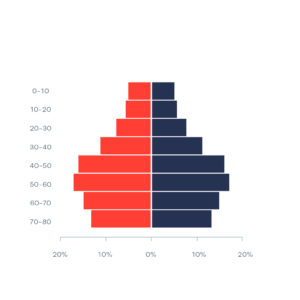
Population Pyramid
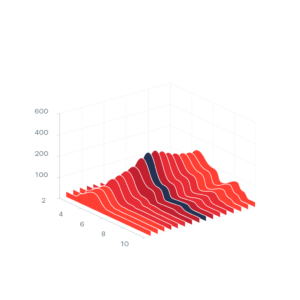
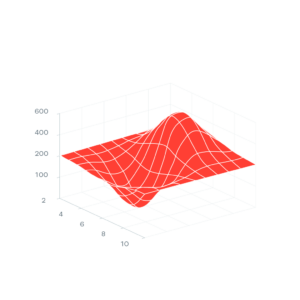
3D Stream Graph
Pictorial Unit Chart
Linear Process Diagram
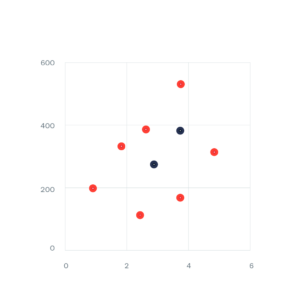
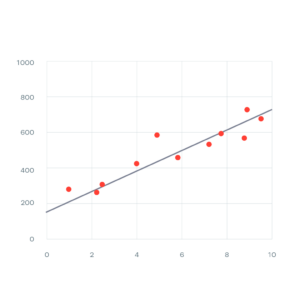
Scatter Plot
Waterfall Chart
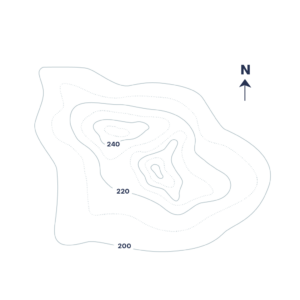
Topographic Map
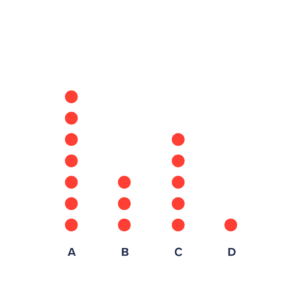
Dot Plot
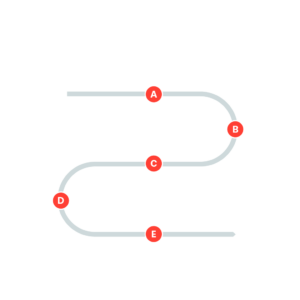
Transit Map
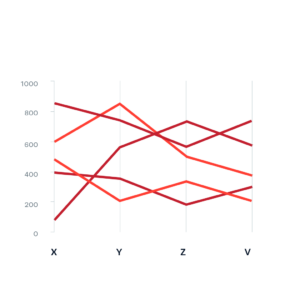
Parallel Coordinates
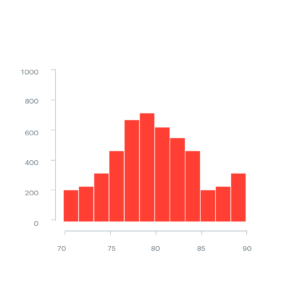
Histogram
Angular Gauge
Cycle Diagram
Convex Treemap
Semi Circle Donut Chart
Sociogram
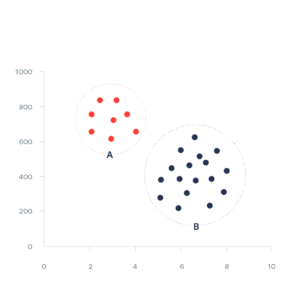
Cluster Analysis
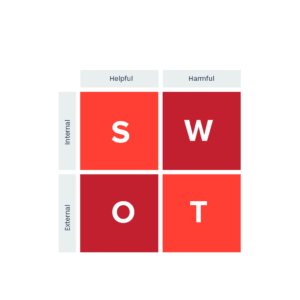
SWOT Analysis
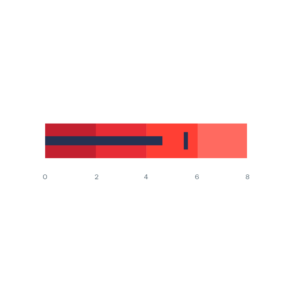
Bullet Graph
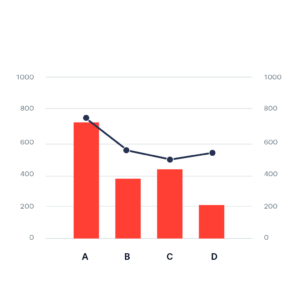
Pareto Chart
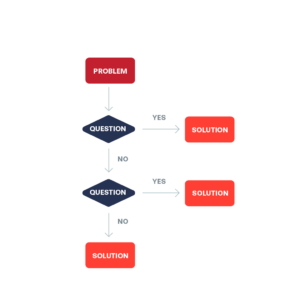
Flow Chart
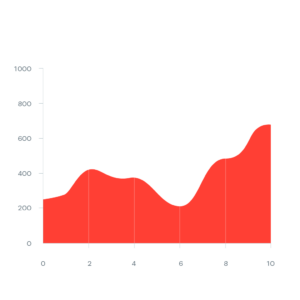
Area Chart
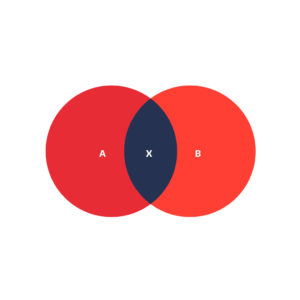
Venn Diagram
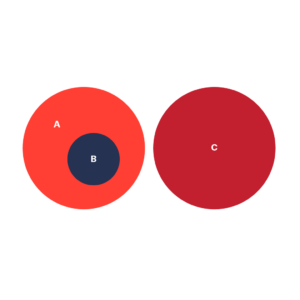
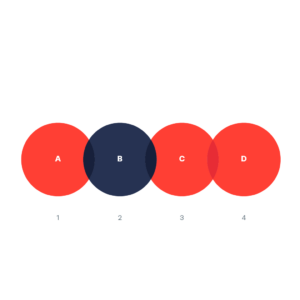
Euler Diagram
Solid Gauge Chart
Icicle Diagram
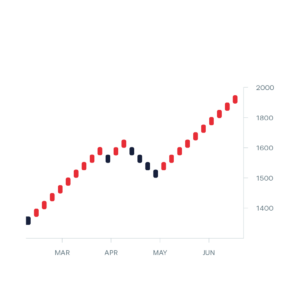
Candlestick Chart
Contour Plot
Polar Chart
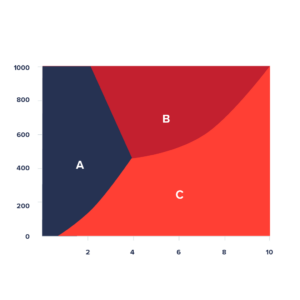
Phase Diagram
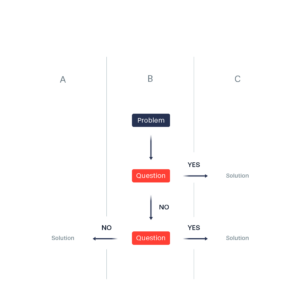
Swimlane Flow Chart
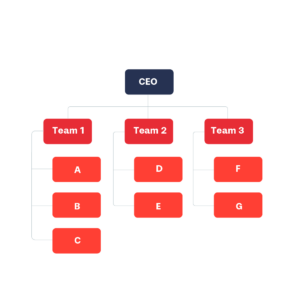
Organisational Chart
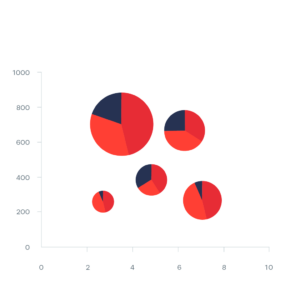
Compound Bubble and Pie Chart
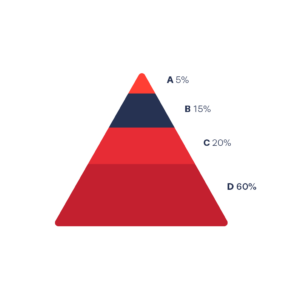
Pyramid Chart
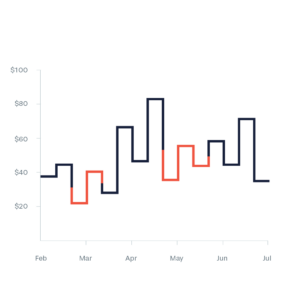
Kagi Chart
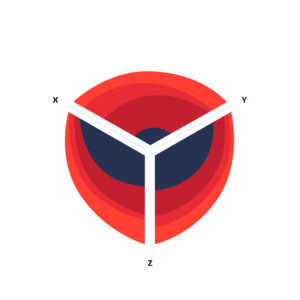
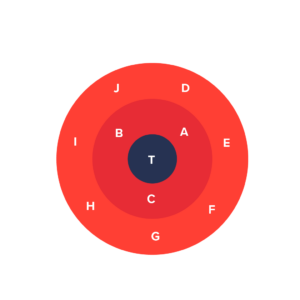
Target Diagram
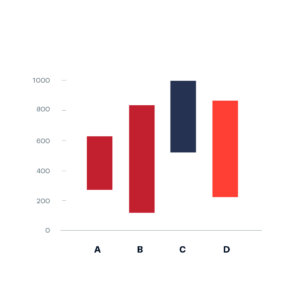
Column Range
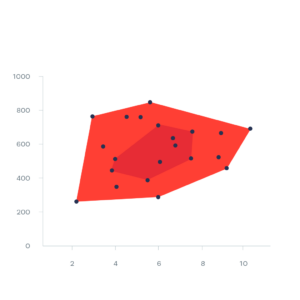
Bagplot
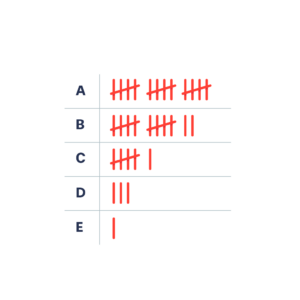
Tally Chart
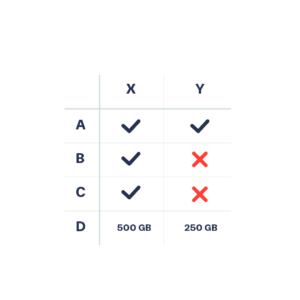
Comparison Chart
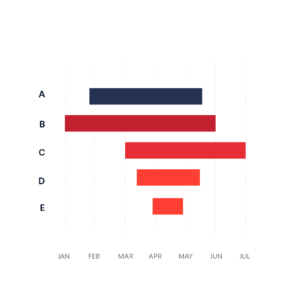
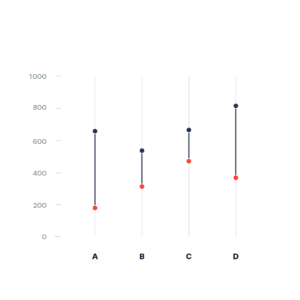
Span Chart
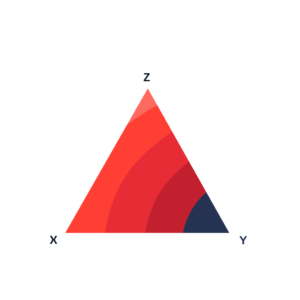
Ternary Contour Plot
Process Diagram
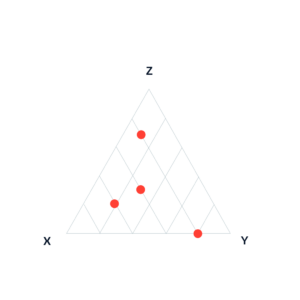
Ternary Plot
Range Area Chart
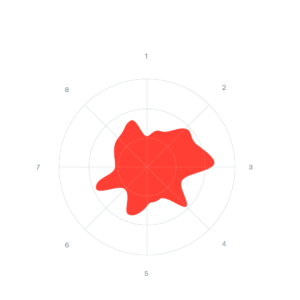
Radial Area Chart
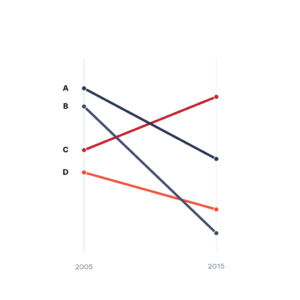
Slope Chart
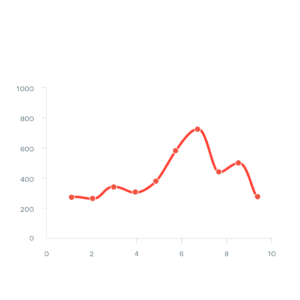
Spline Graph
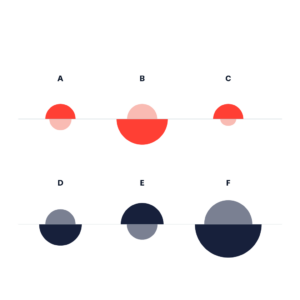
Proportional Area Chart (Half Circle)
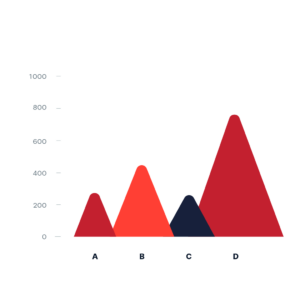
Triangle Bar Chart
Clustered Force Layout
Dumbbell Plot
Connection Map
Cartogram
Route Map
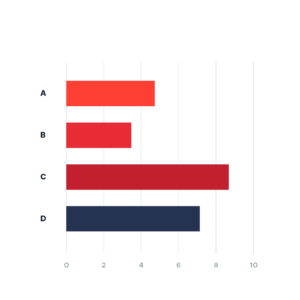
Bar Chart (Horizontal)
Pin Map
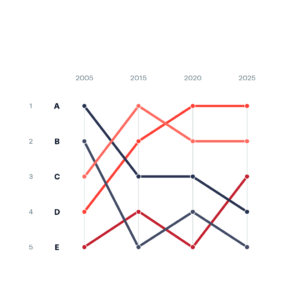
Bump Chart
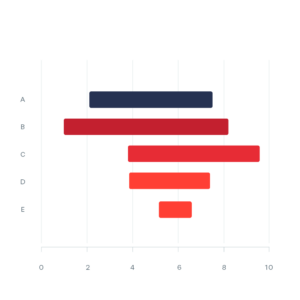
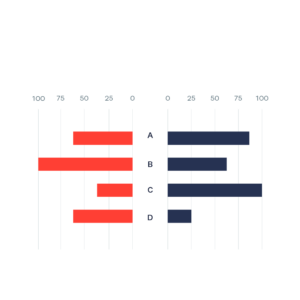
Butterfly Chart
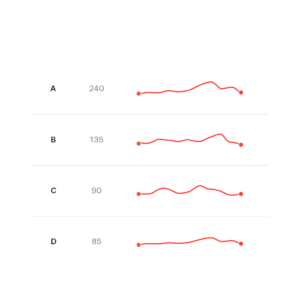
Sparkline
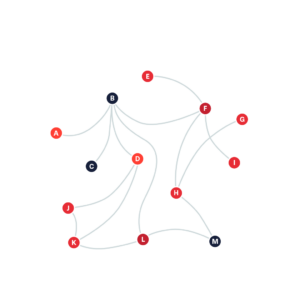
Network Visualisation
Opposite Diagram
Stacked Ordered Area Chart
Waffle Chart
Non-ribbon Chord Diagram
Curved Bar Chart
Scaled-up Number
Scaled Timeline
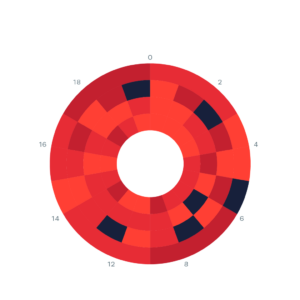
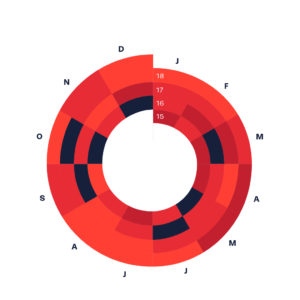
Circular Heat Map
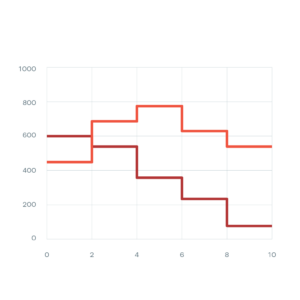
Stepped Line Graph
Trendline
Icon and Number
Proportional Area Chart (Icon)
Icon Count
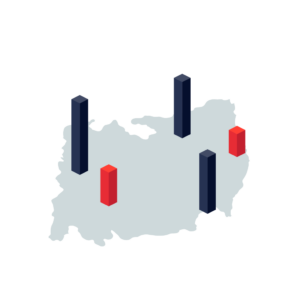
Bar Chart on a Map
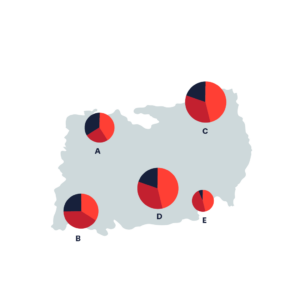
Pie Chart on a Map
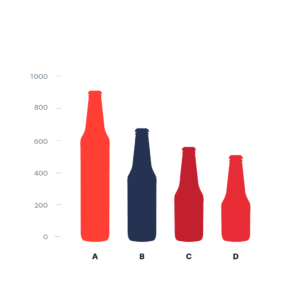
Pictorial Bar Chart
Illustration Diagram
Renko Chart
Marimekko Chart
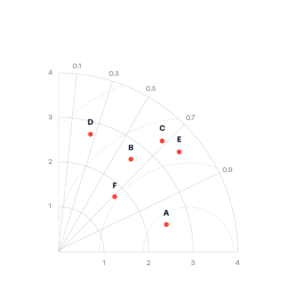
Taylor Diagram
Column Sparkline
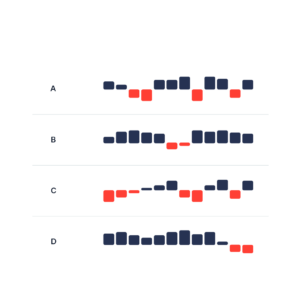
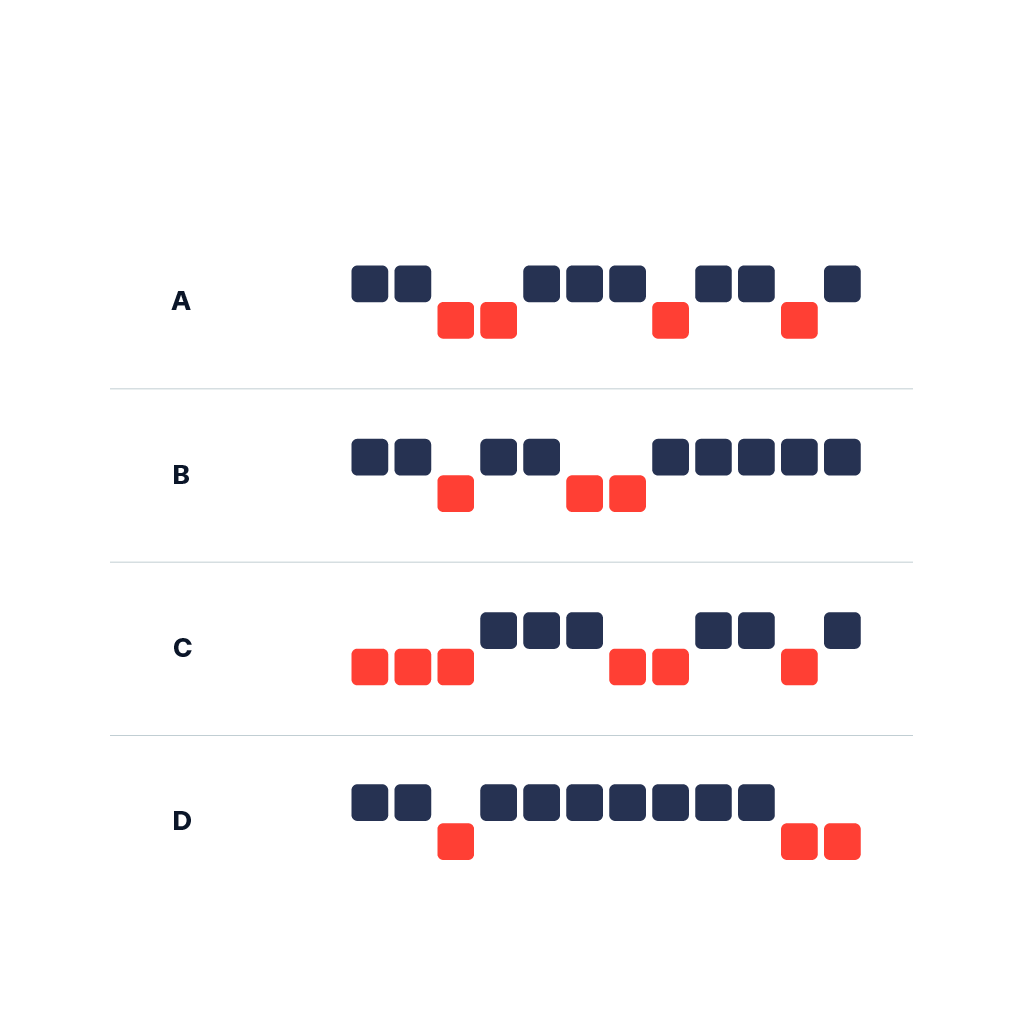
Win-loss Sparkline
Matrix Diagram (Y-Shaped)
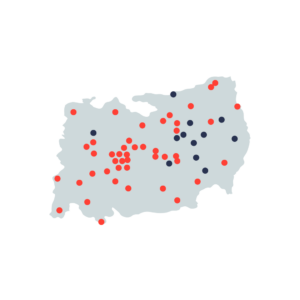
Dot Density Map
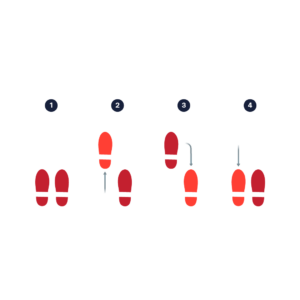
Step by Step Illustration
Spiral Heat Map
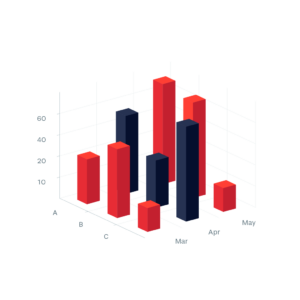
Multiple Series 3D Bar Chart
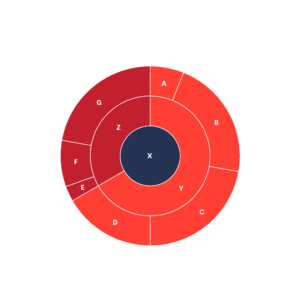
Multi-level Pie Chart
Pyramid Diagram
Layered Area Chart
3D Scatter Plot
Fan Chart (Genealogy)
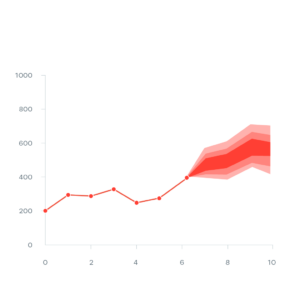
Fan Chart (Time Series)
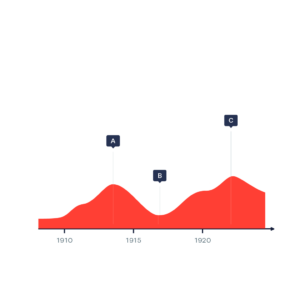
Bubble Timeline
Radial Convergences
Spiral Histogram
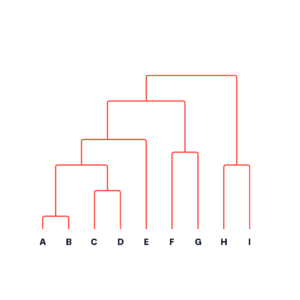
Dendrogram
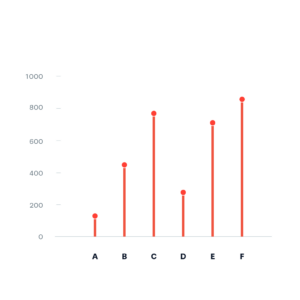
Lollipop Chart
Development and Causes
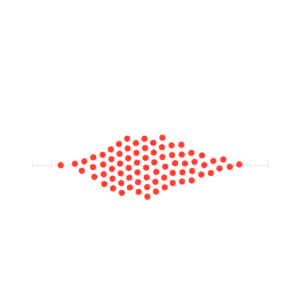
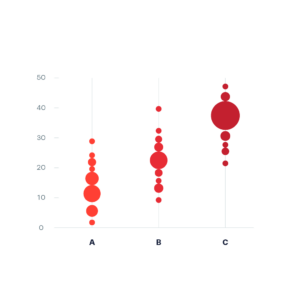
Beeswarm Plot
Nomogram
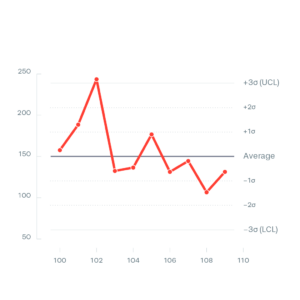
Control Chart
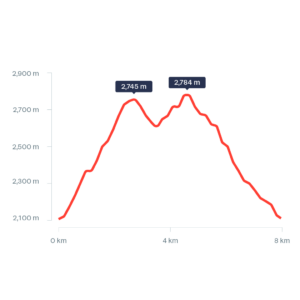
Profile Map
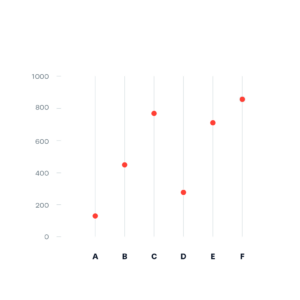
Dot Chart
Counts Plot
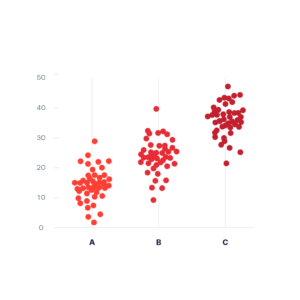
Jitter Plot
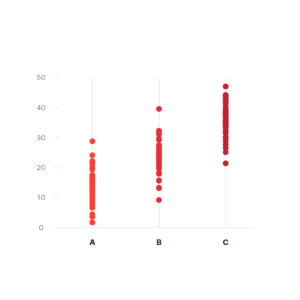
Strip Plot
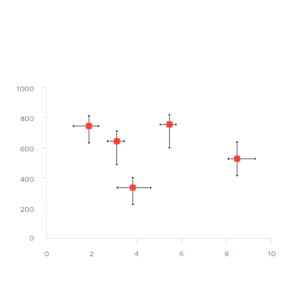
Error Bars
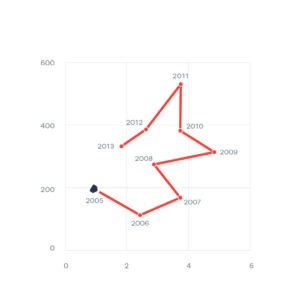
Connected Scatter Plot
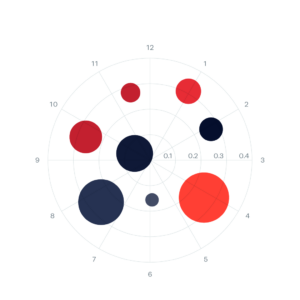
Circular Bubble Chart
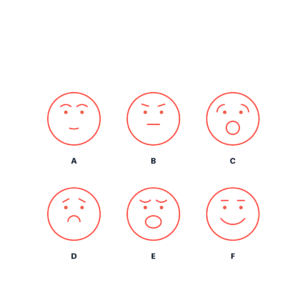
Chernoff Faces
1 dataset. 100 visualizations.
Discover data viz applied to real data in our latest project!