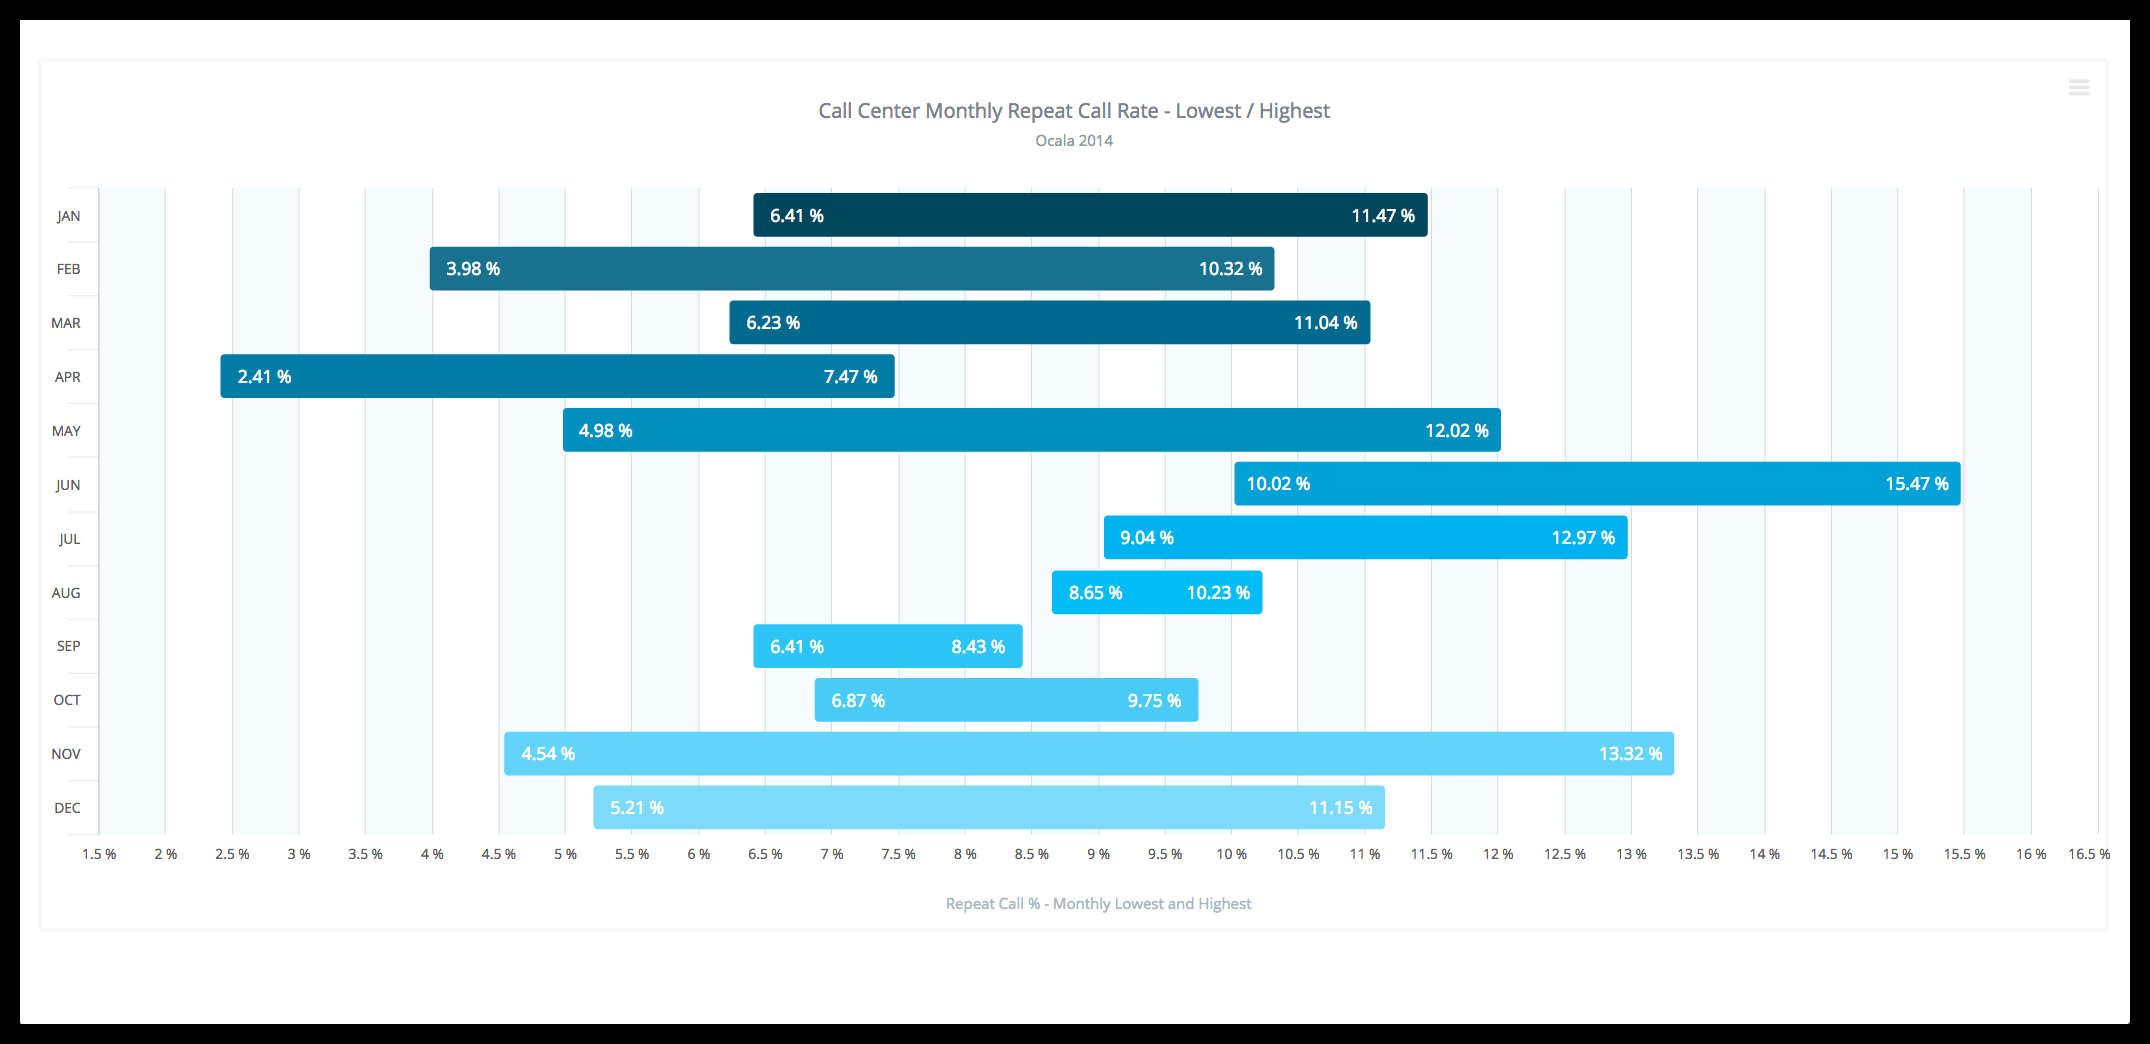
Column Range
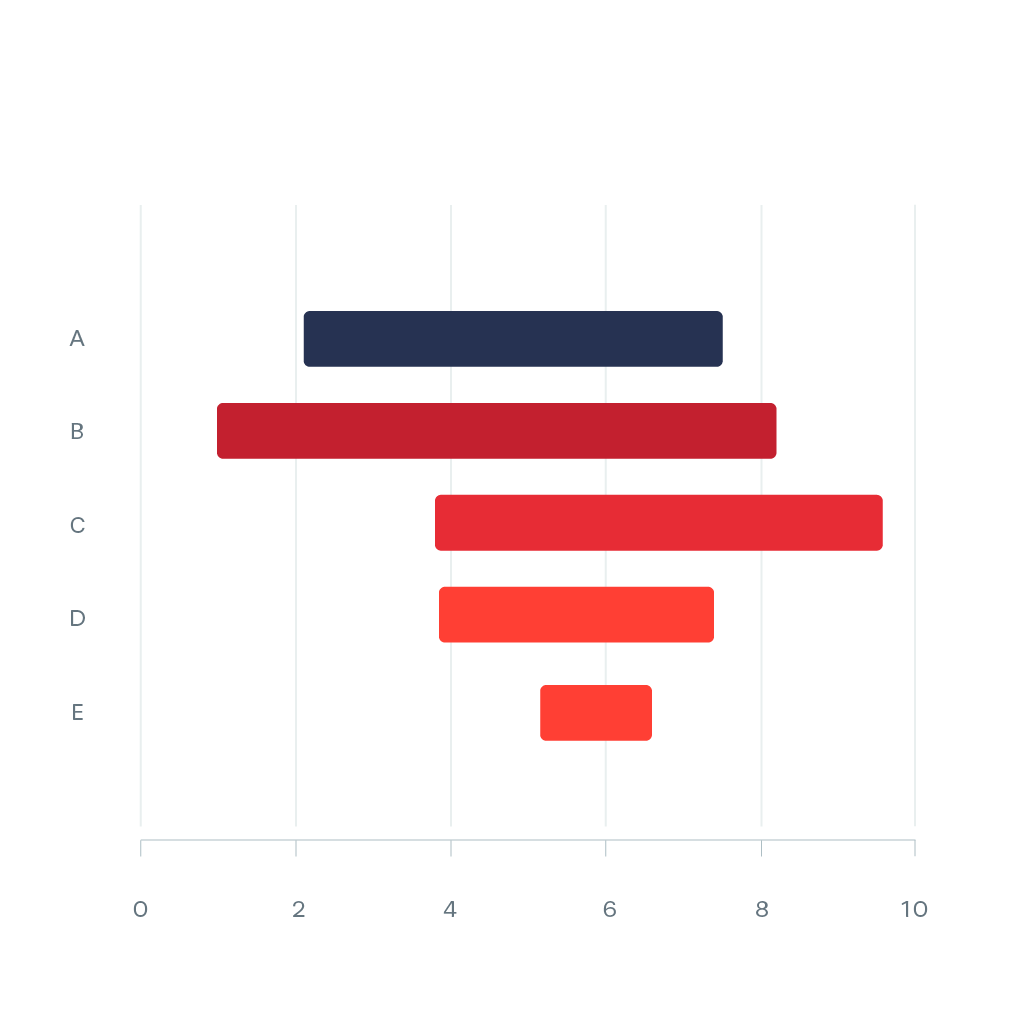
The Column Range displays a range of data by plotting two Y values per data point. Each Y value used is drawn as the upper, and lower bounds of a column. Sometimes range charts are referred as “floating” column charts. Some data may look very nice and are easily understood in this form, in which the column floats in the chart, spanning a region from a minimum value to a maximum value.