Gantt Chart
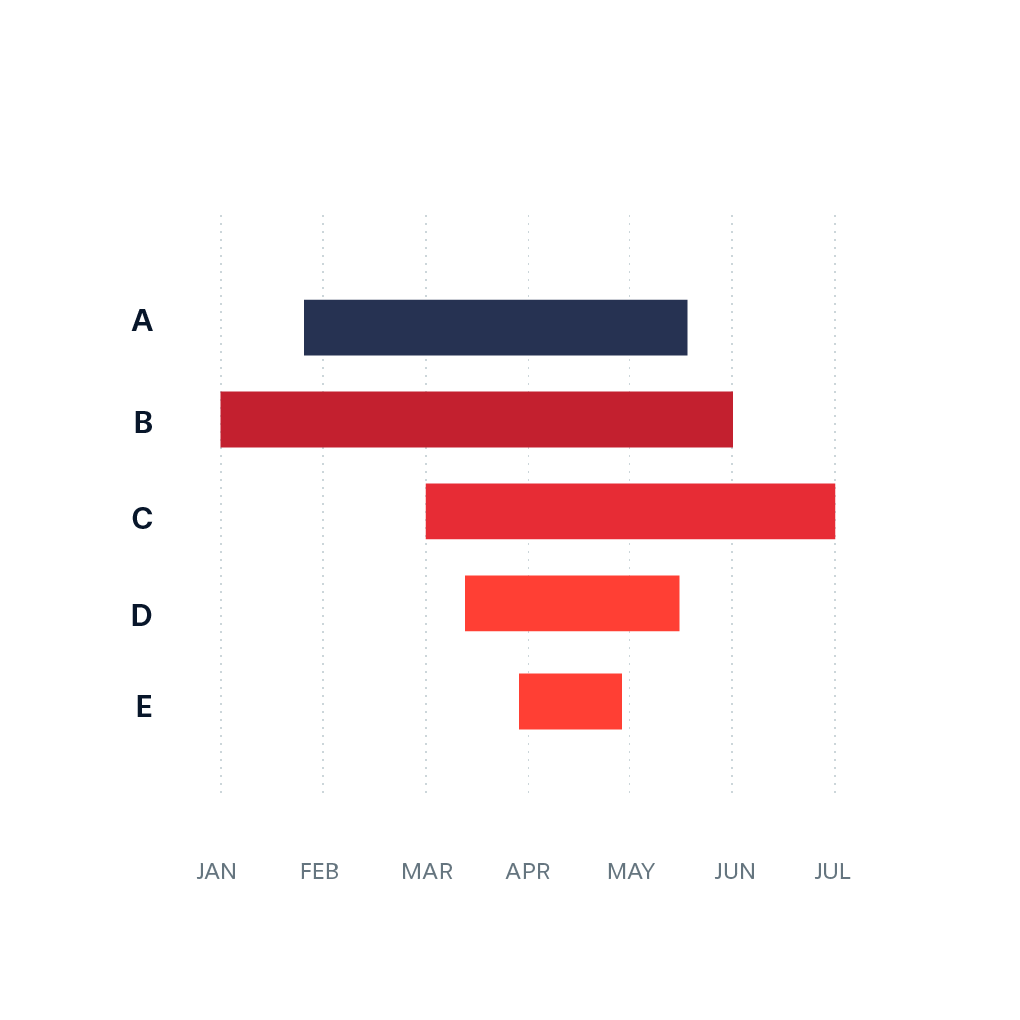
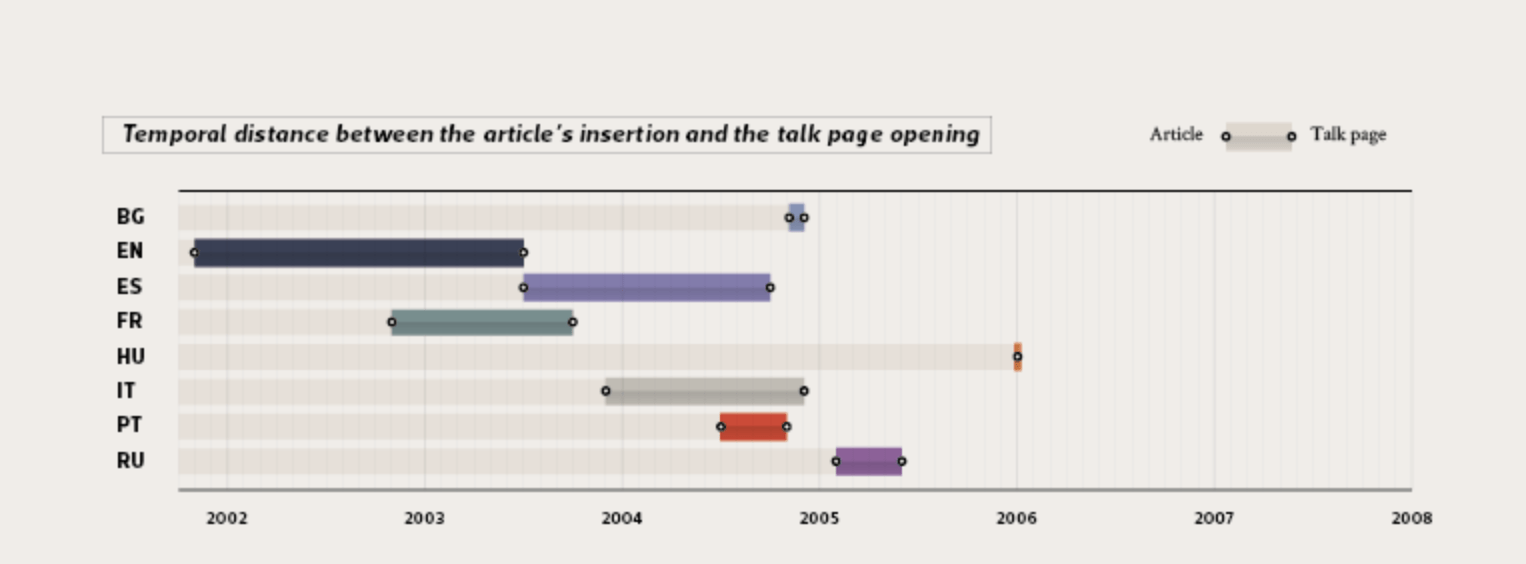
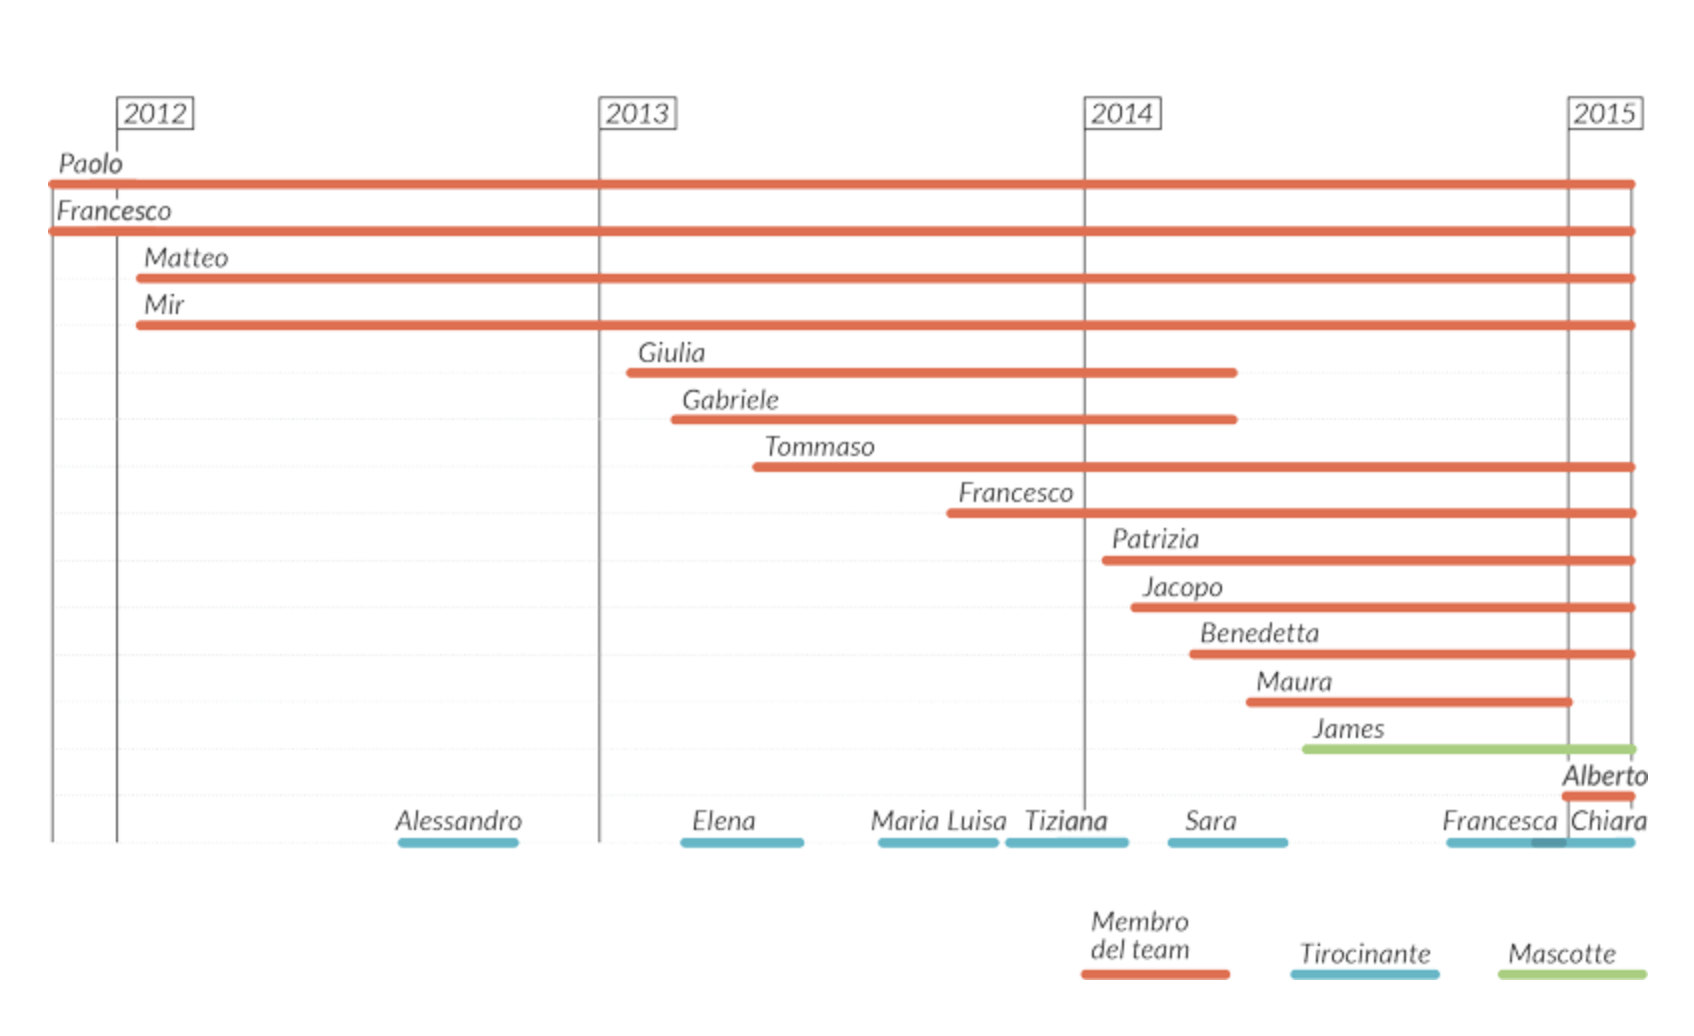
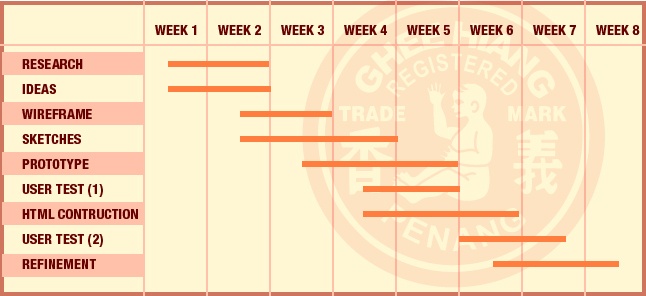
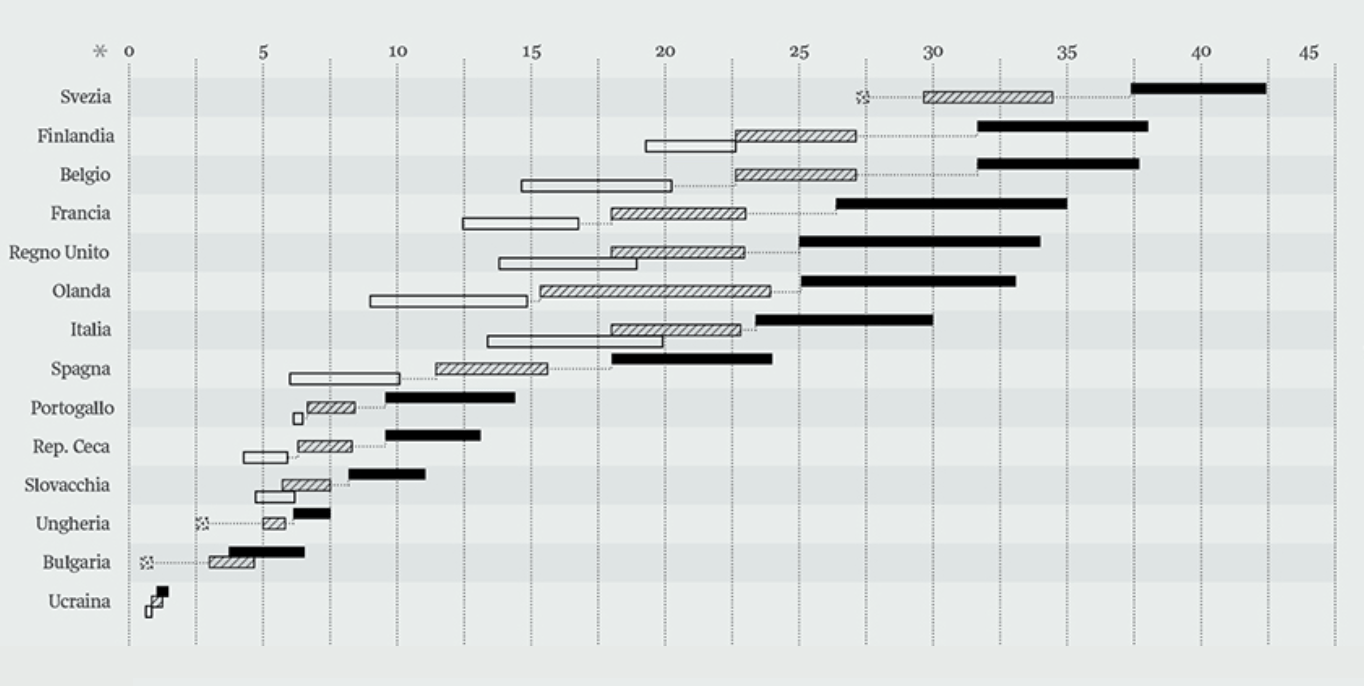
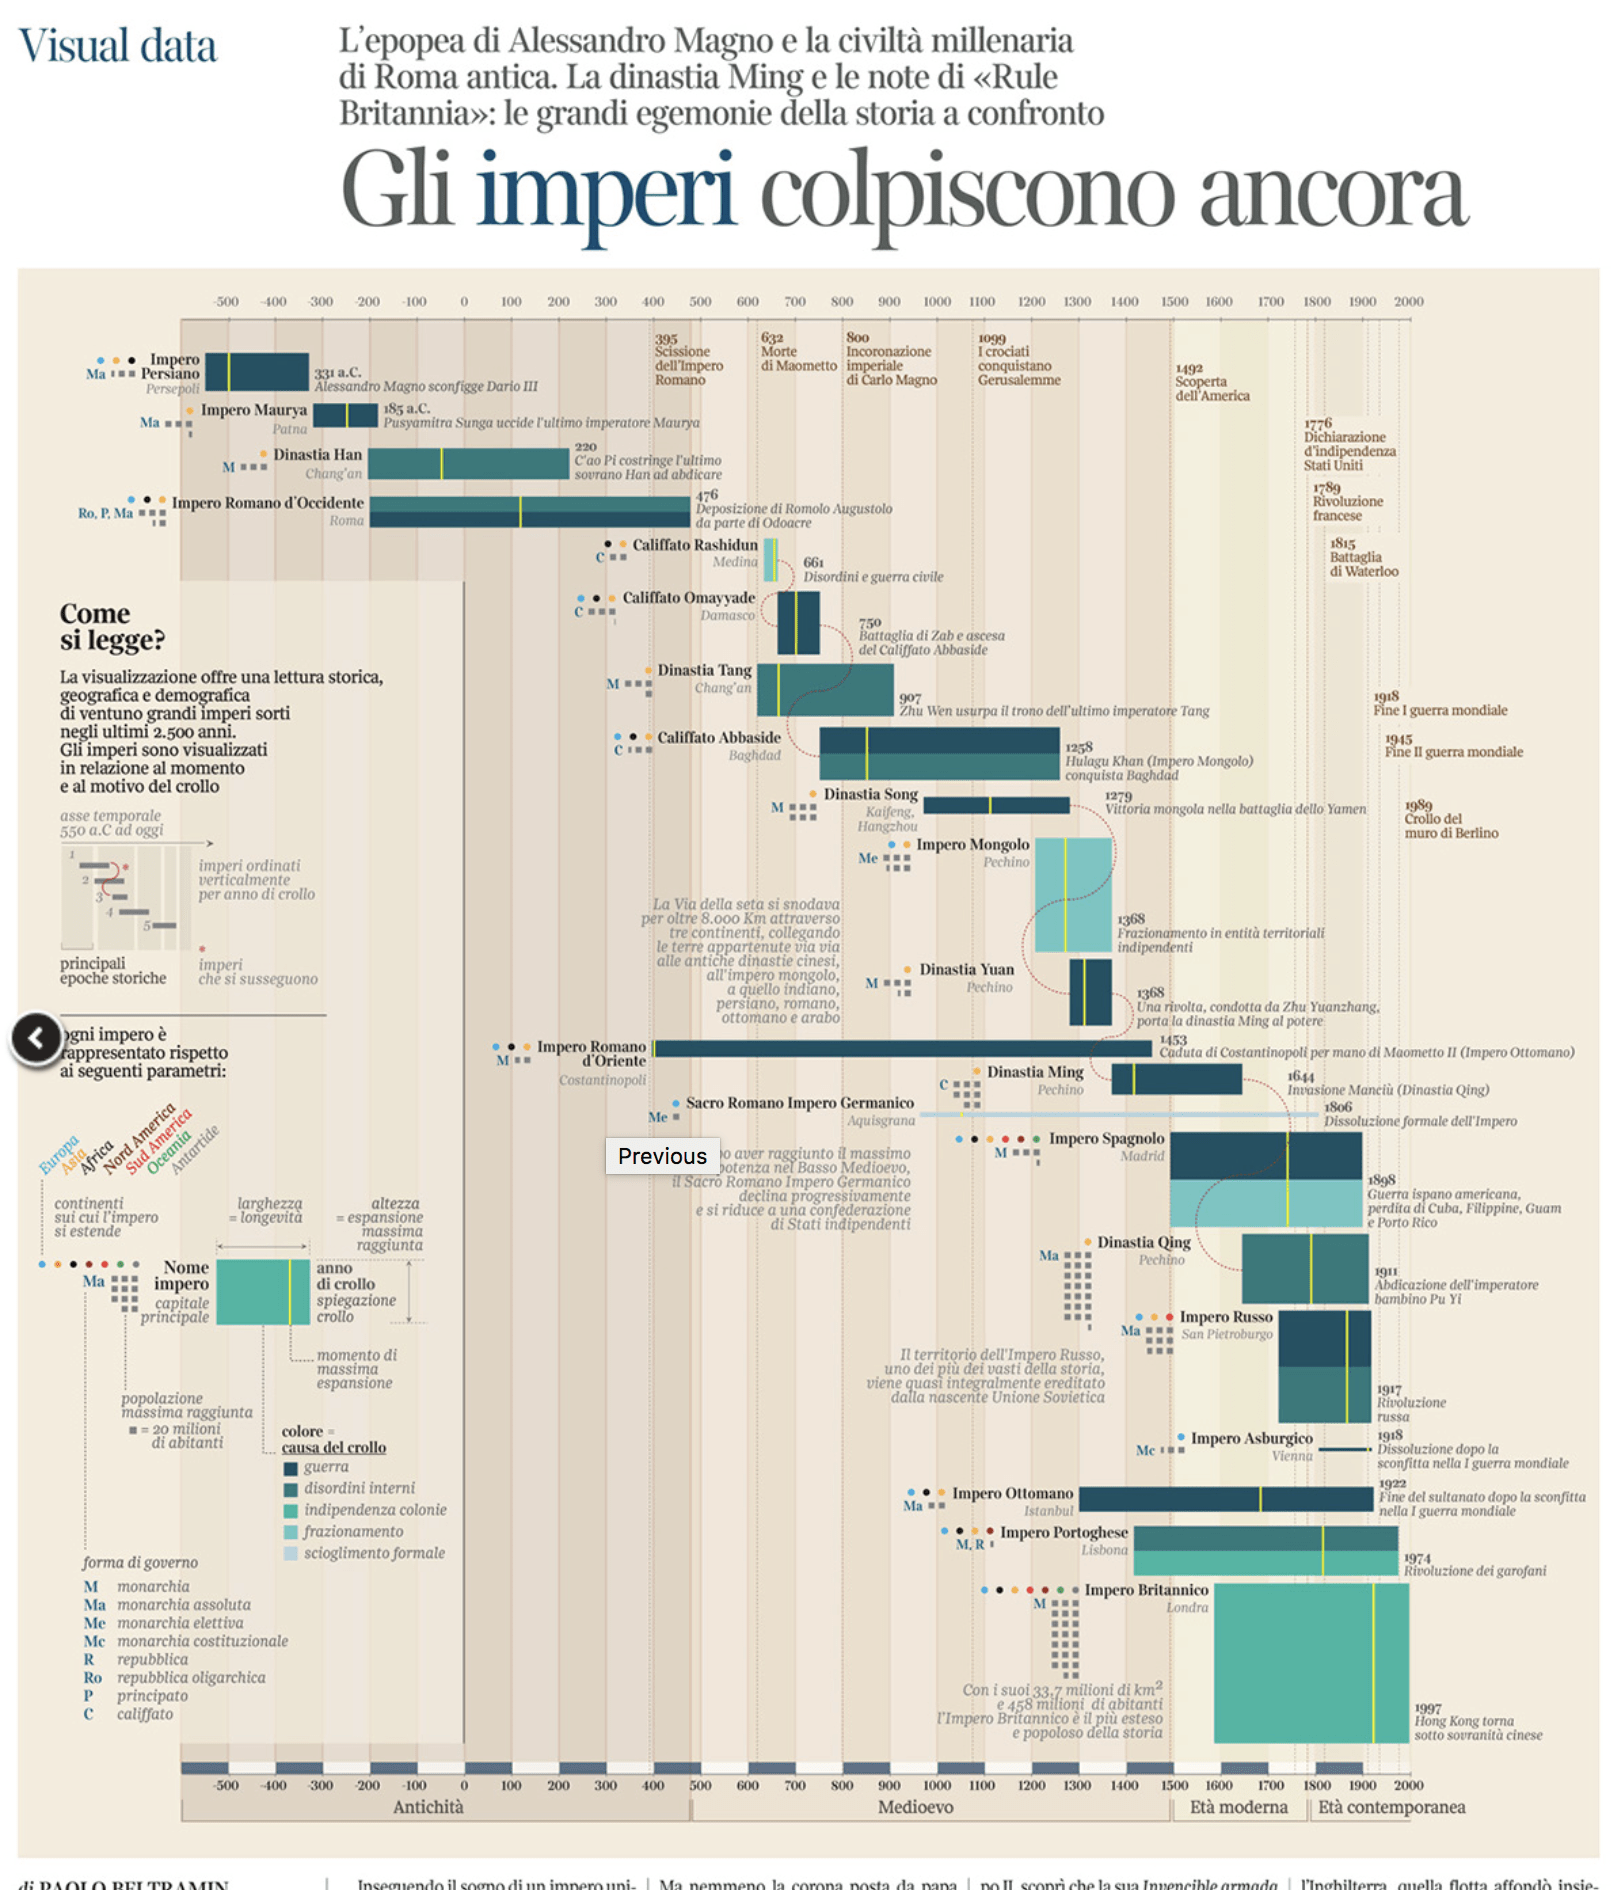
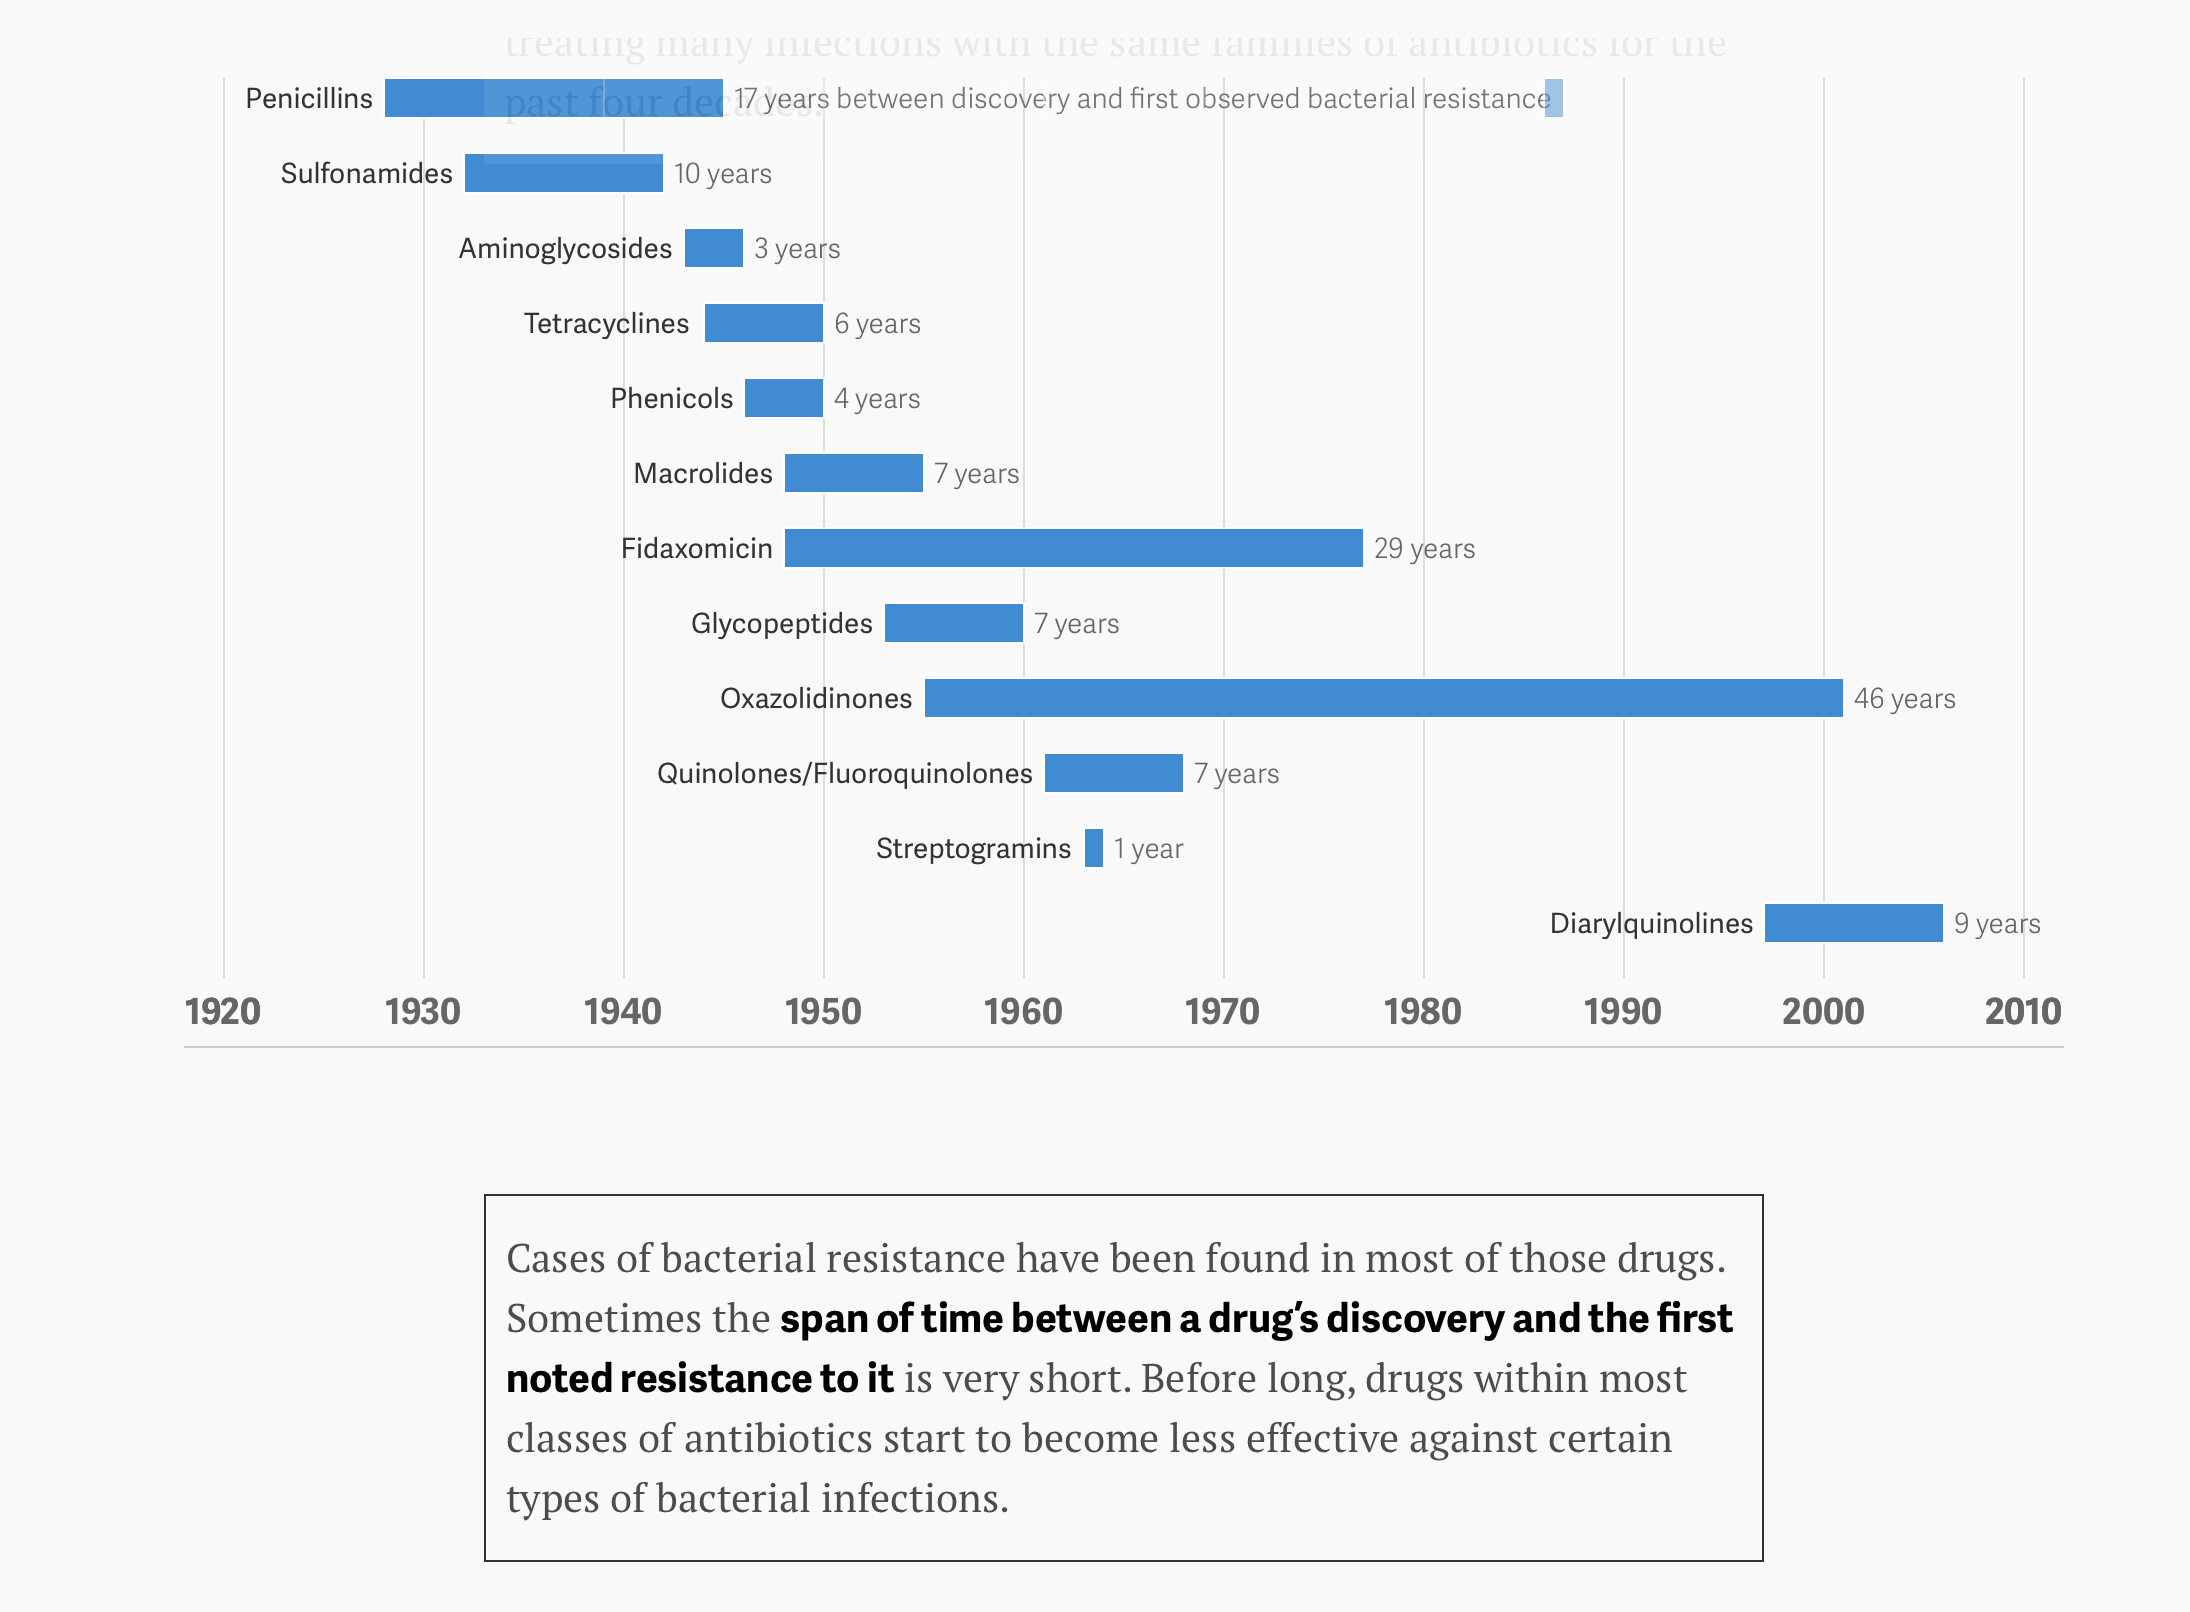
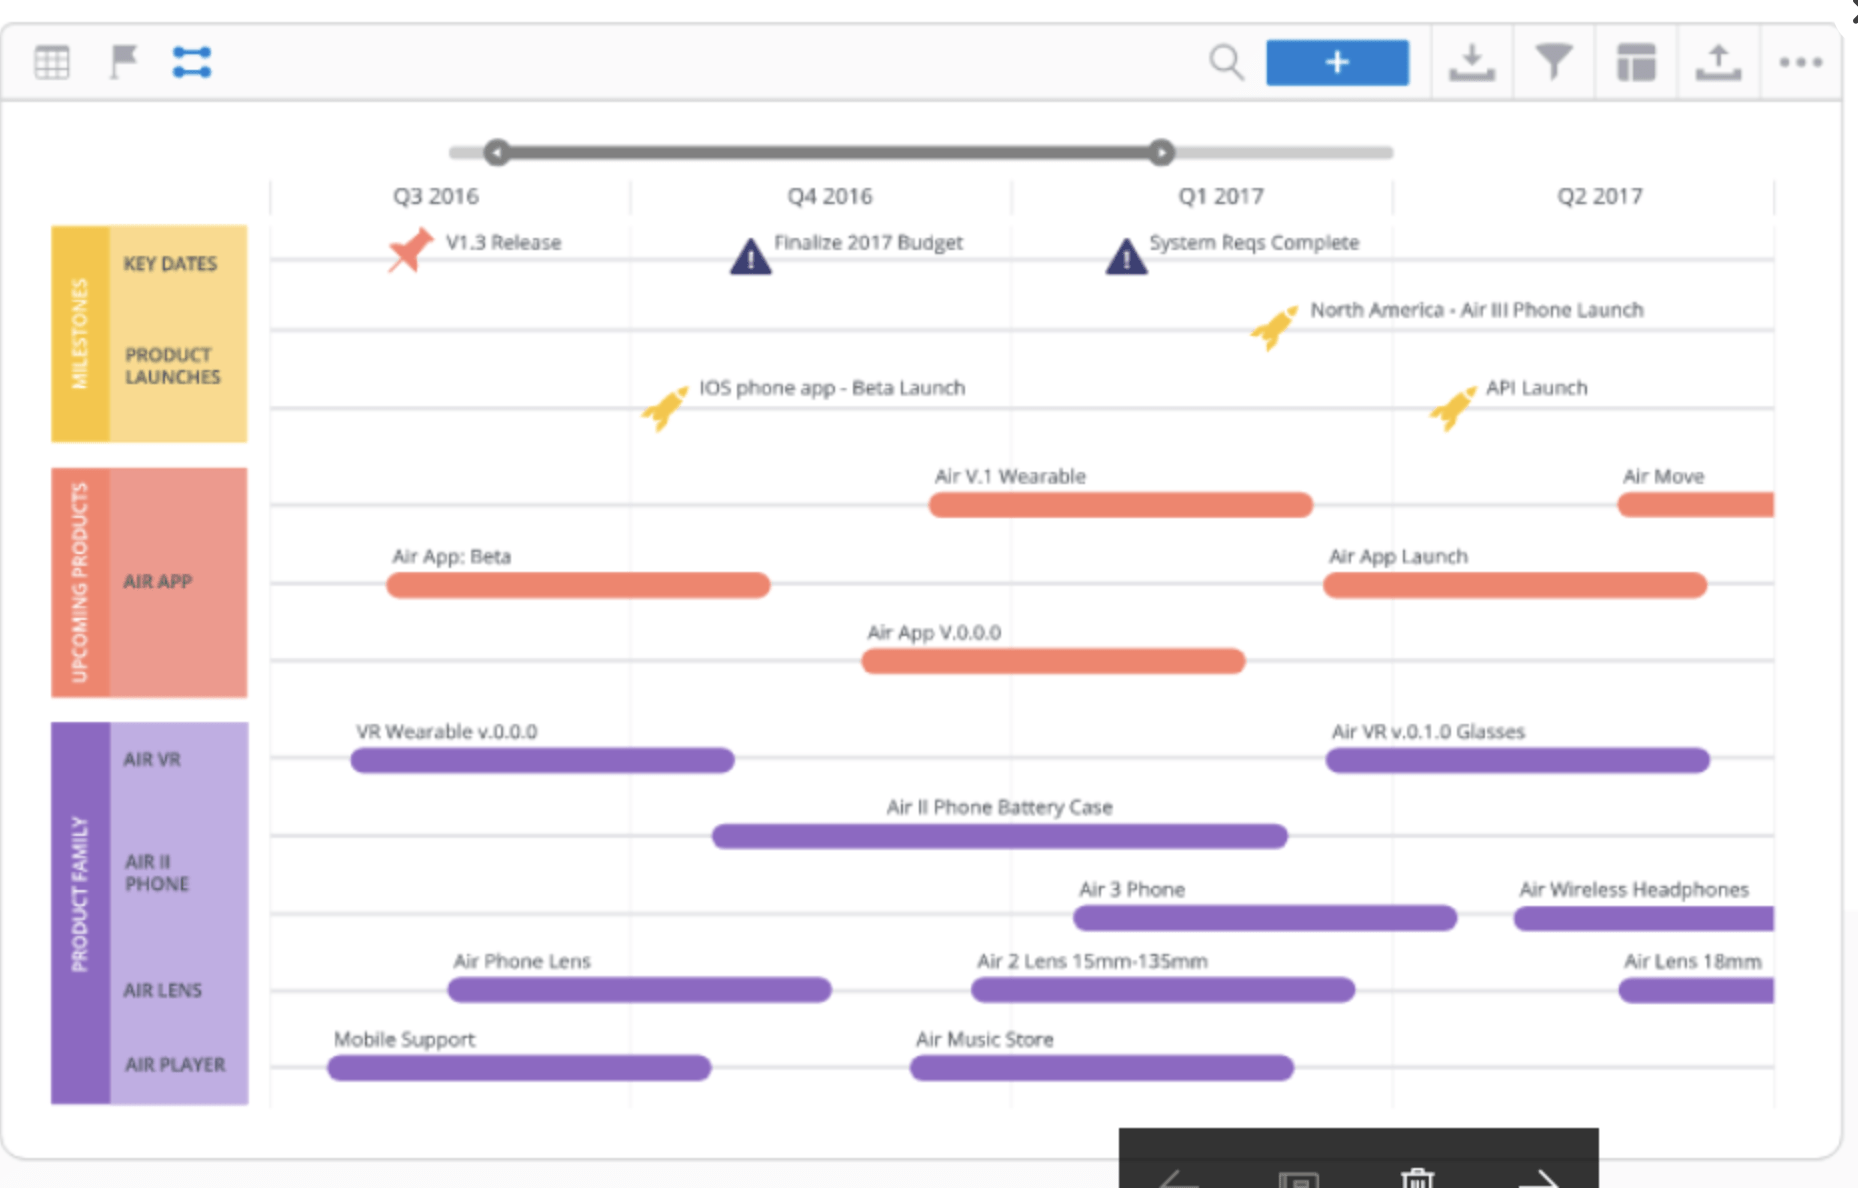
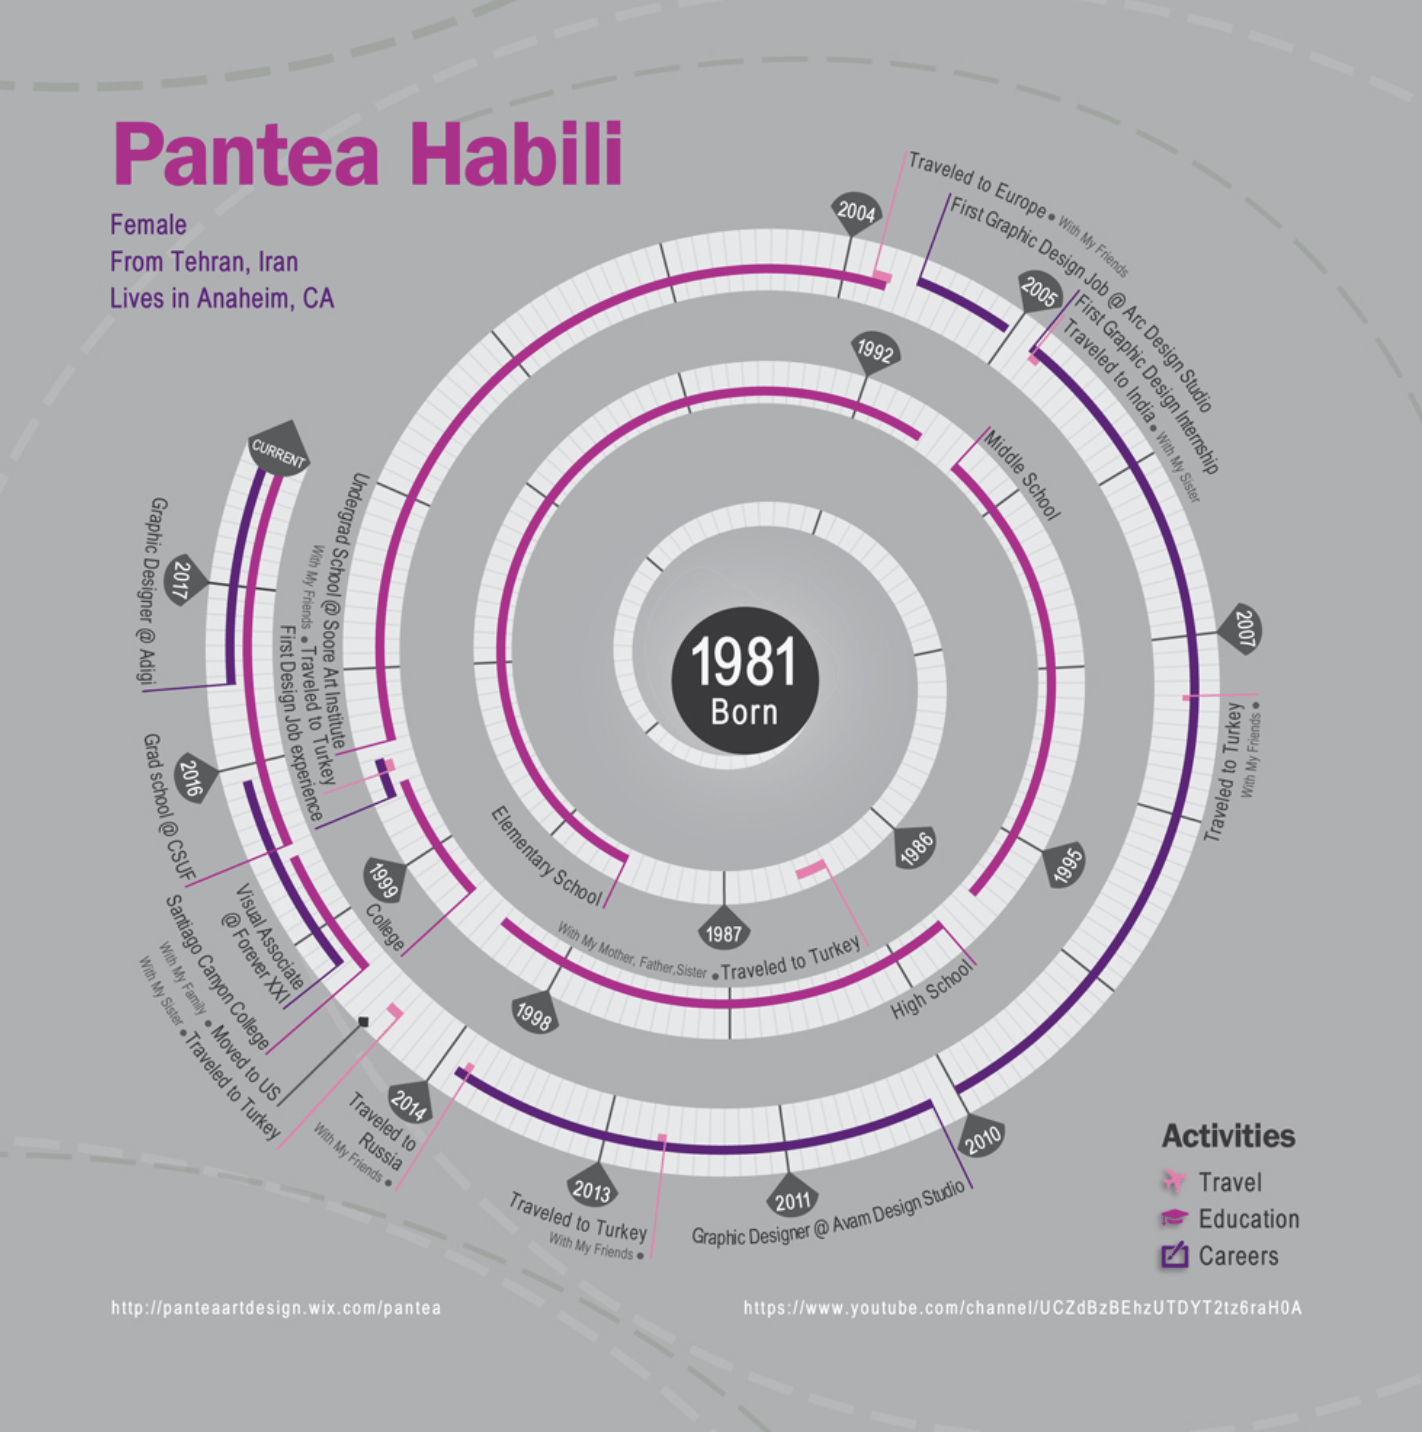
A Gantt chart is a type of bar chart, that visualises various categories into time series. Gantt charts illustrate the start and finish time in time period blocks.
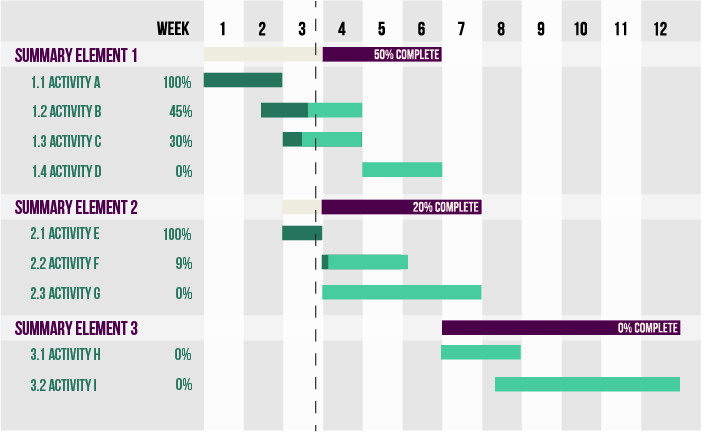
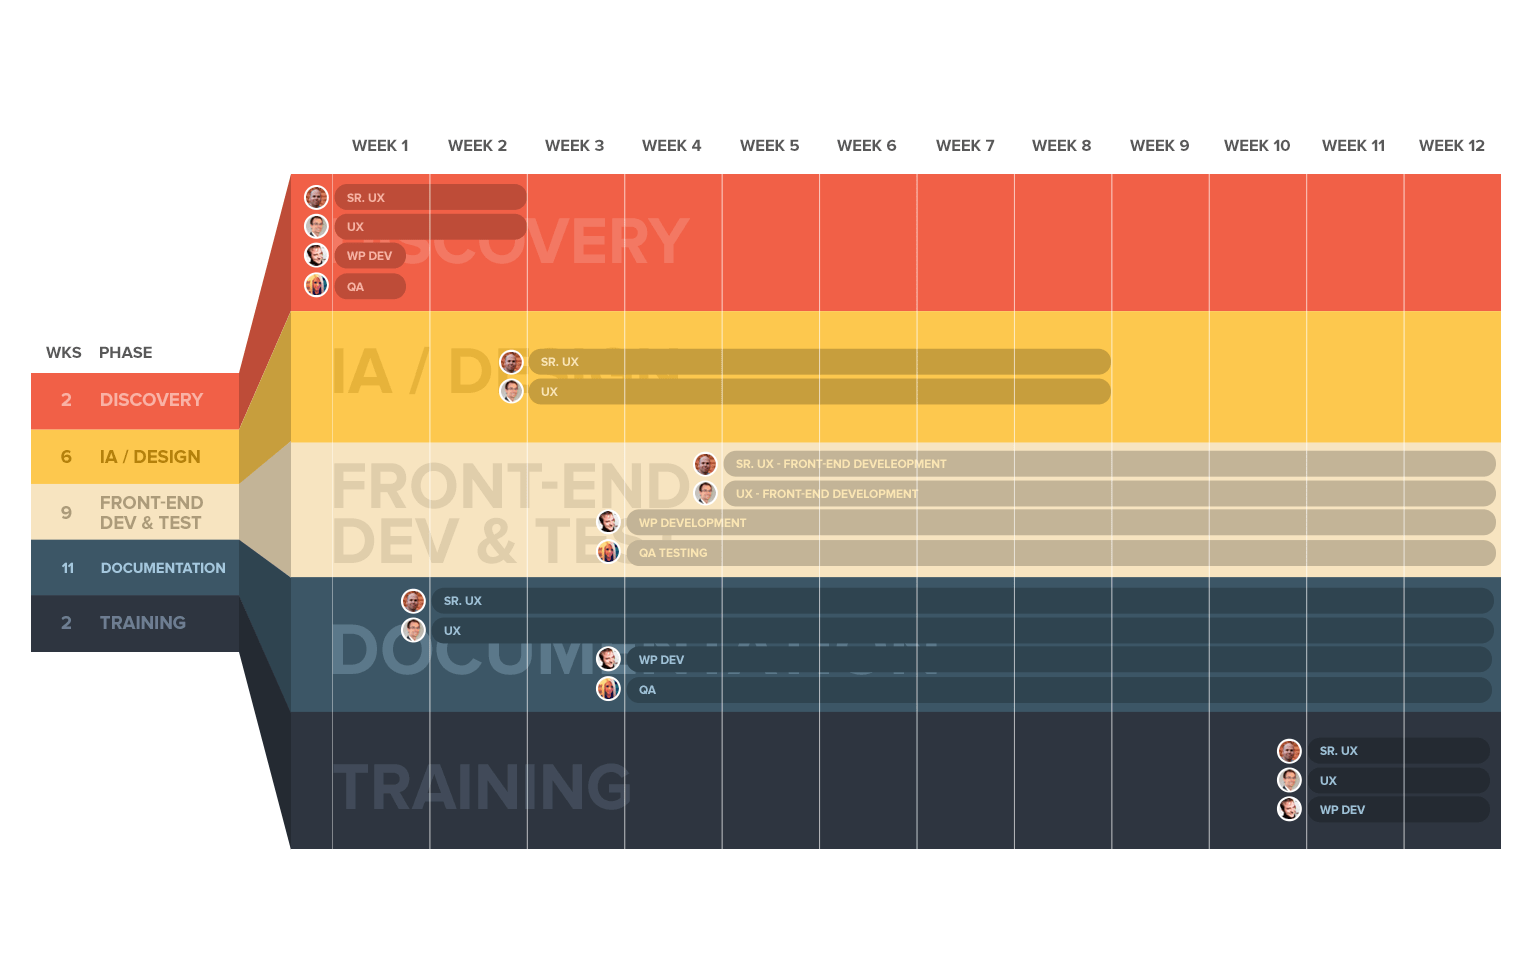
A Gantt chart is often used in project management as one of the most popular and useful ways of showing activities (tasks or events) displayed against time. On the left of the chart is a list of the activities and along the top is a suitable time scale. Each activity is represented by a bar; the position and length of the bar reflects the start date, duration and end date of the activity.
It is similar to the Column Range with the difference of indicating time.