Control Chart
Also called: Shewhart Chart or Process-behavior Chart

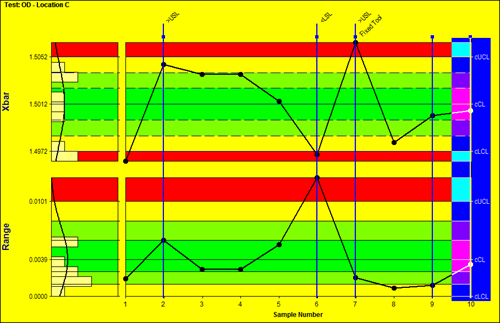
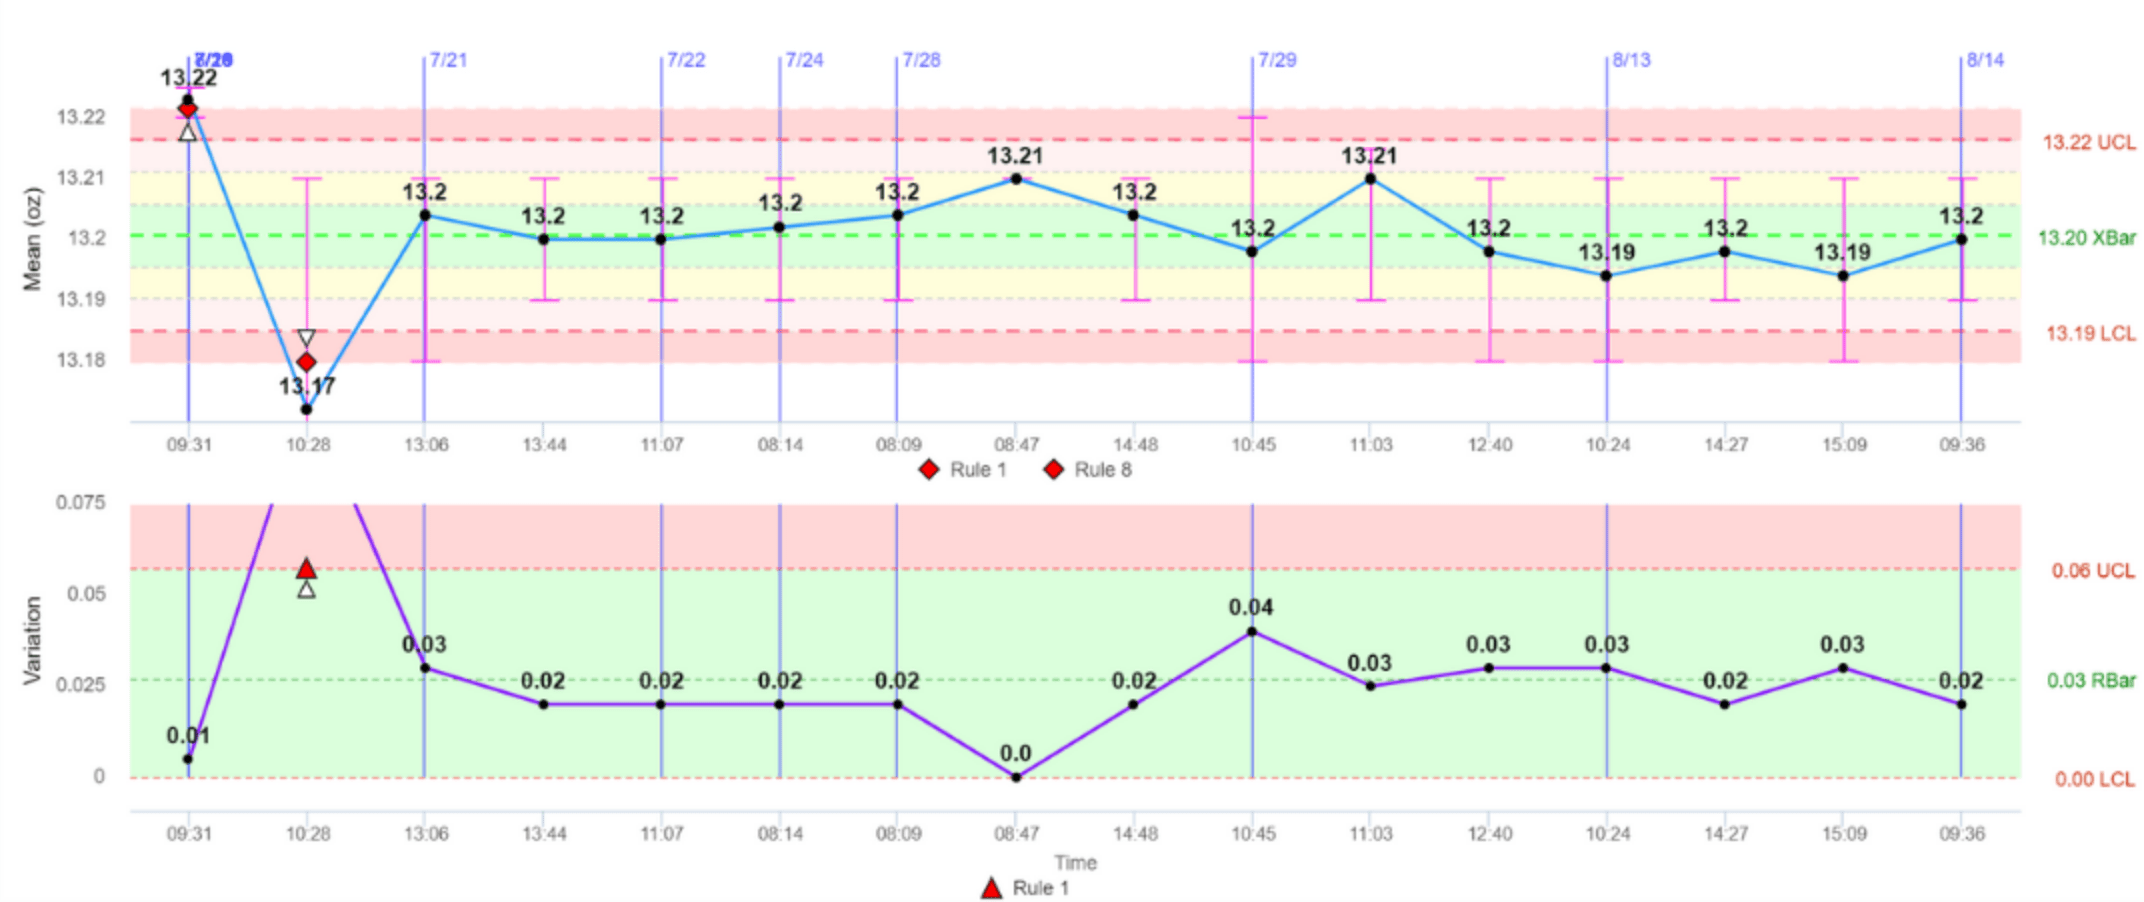
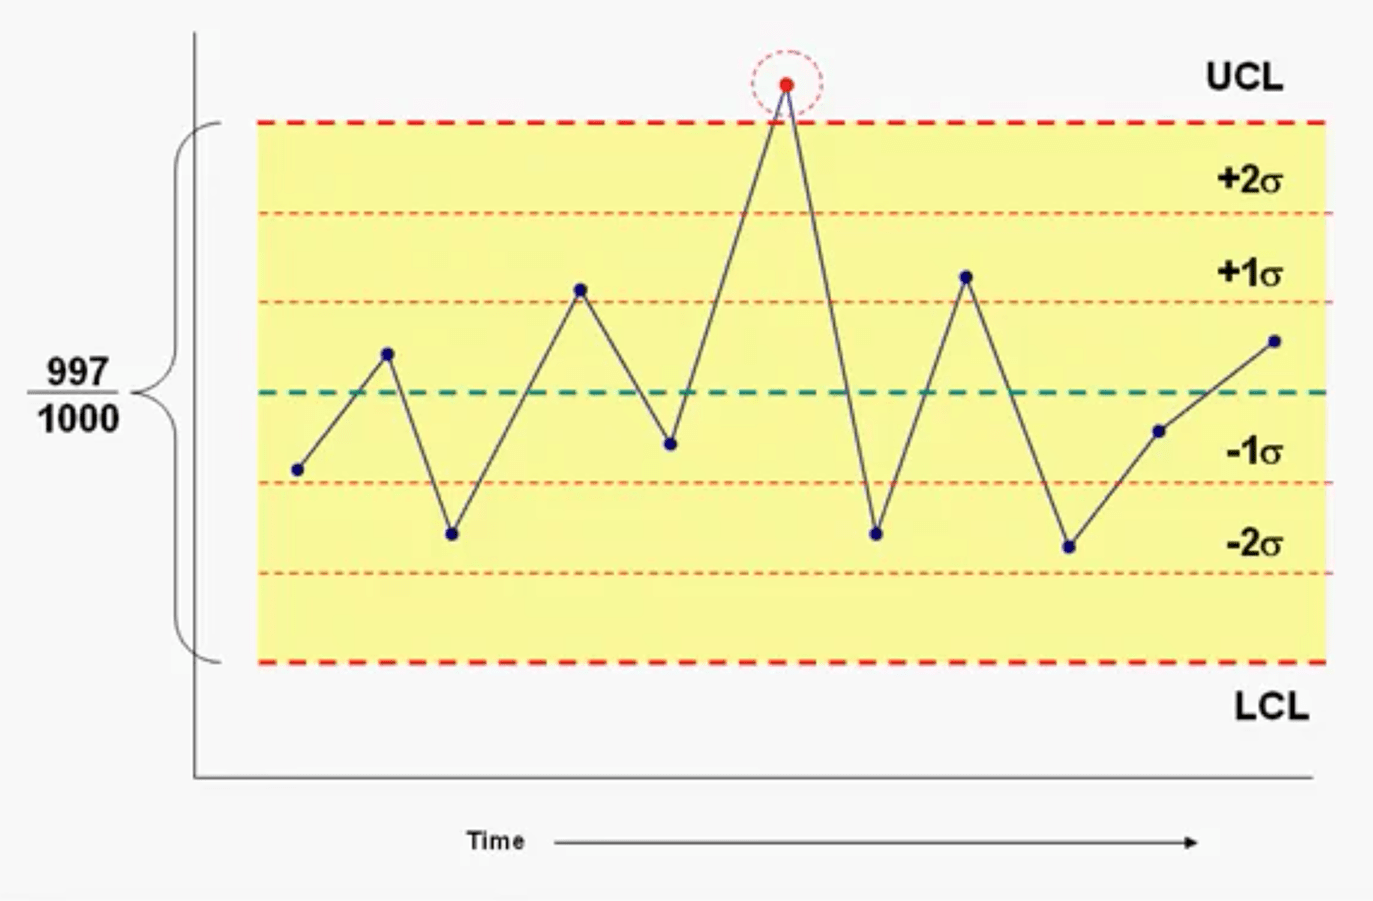
A control chart is a tool for statistical process control. It is a line graph of a variable from the process, with added control lines that are used to monitor if the process behave differently than usual. To make a control graph, a time period of reference is first selected. From the values during that period, an average is calculated and plotted as an horizontal line. Above and below the average, three standard deviations are calculated to plot extra lines, ending with the upper control limit (UCL) and the lower control limit (LCL), at an equal distance above and below the average.
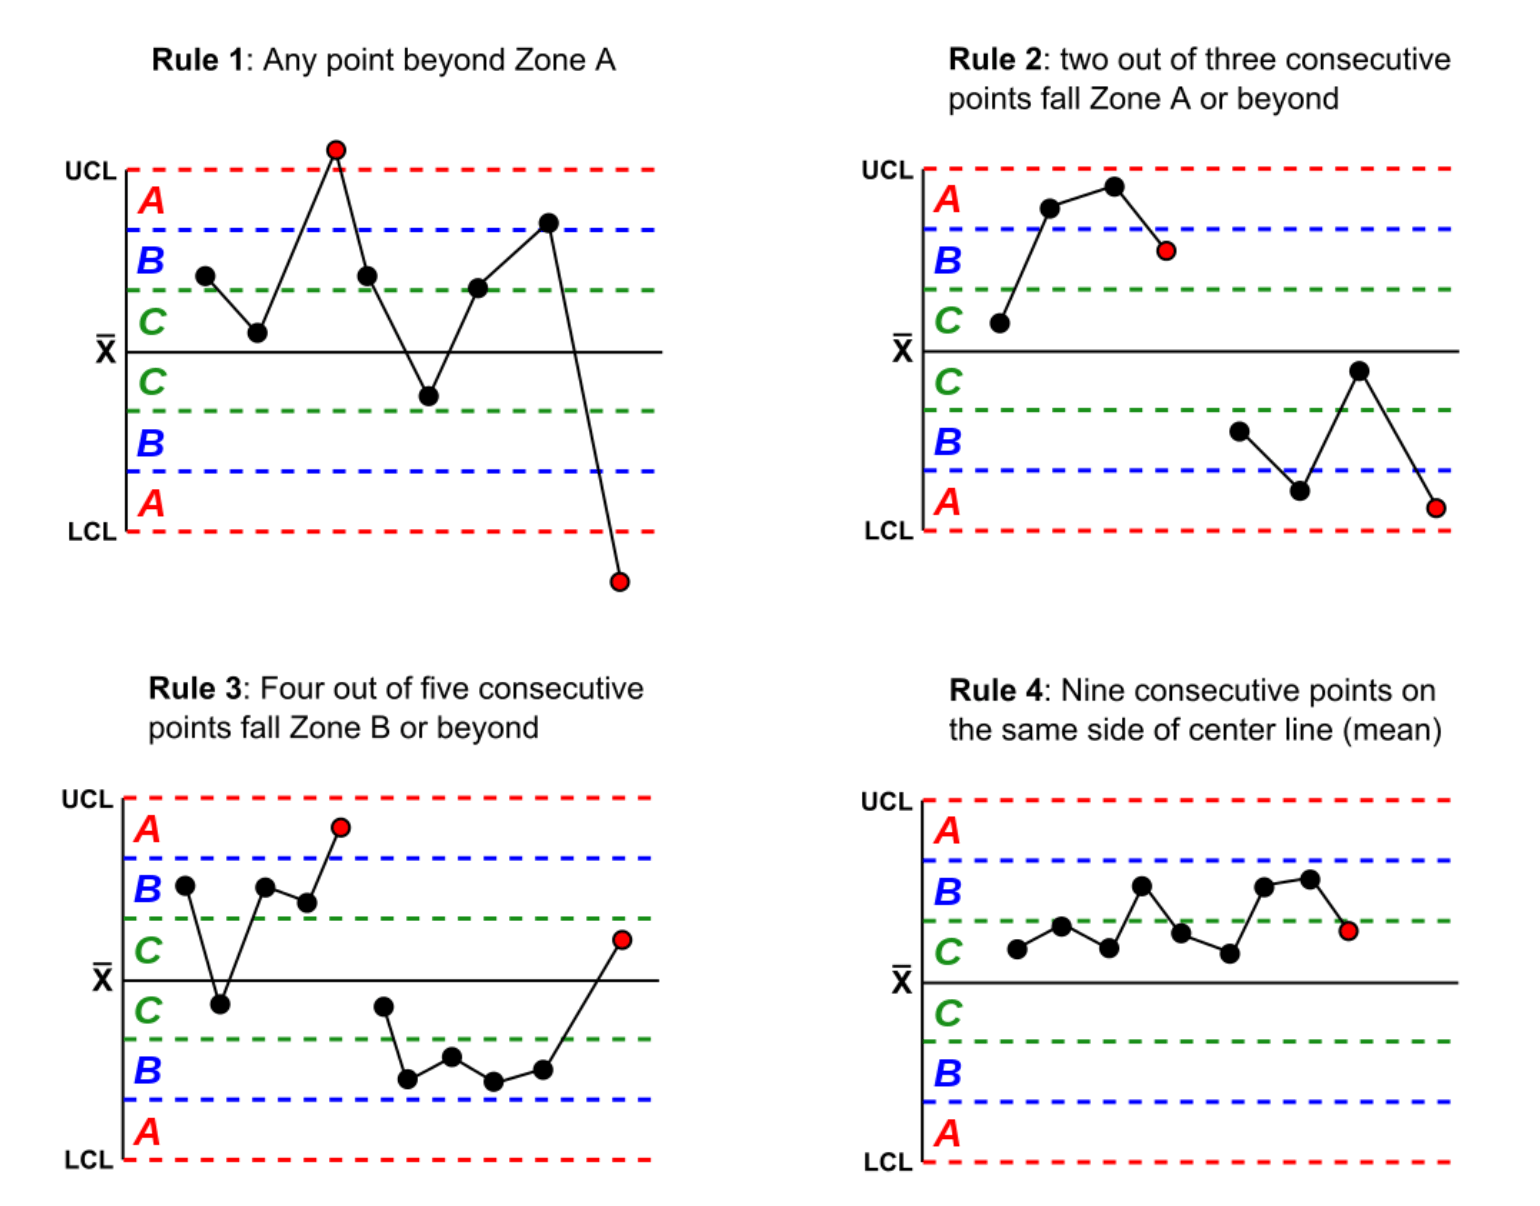
Data beyond the chosen time period can then be plotted over the control lines. Different rules are be applied to read the chart to detect variations that are significant. For instance, data points beyond the control limits are considered suspect, as are long series of consecutive data points above or below the average.