Waterfall Plot
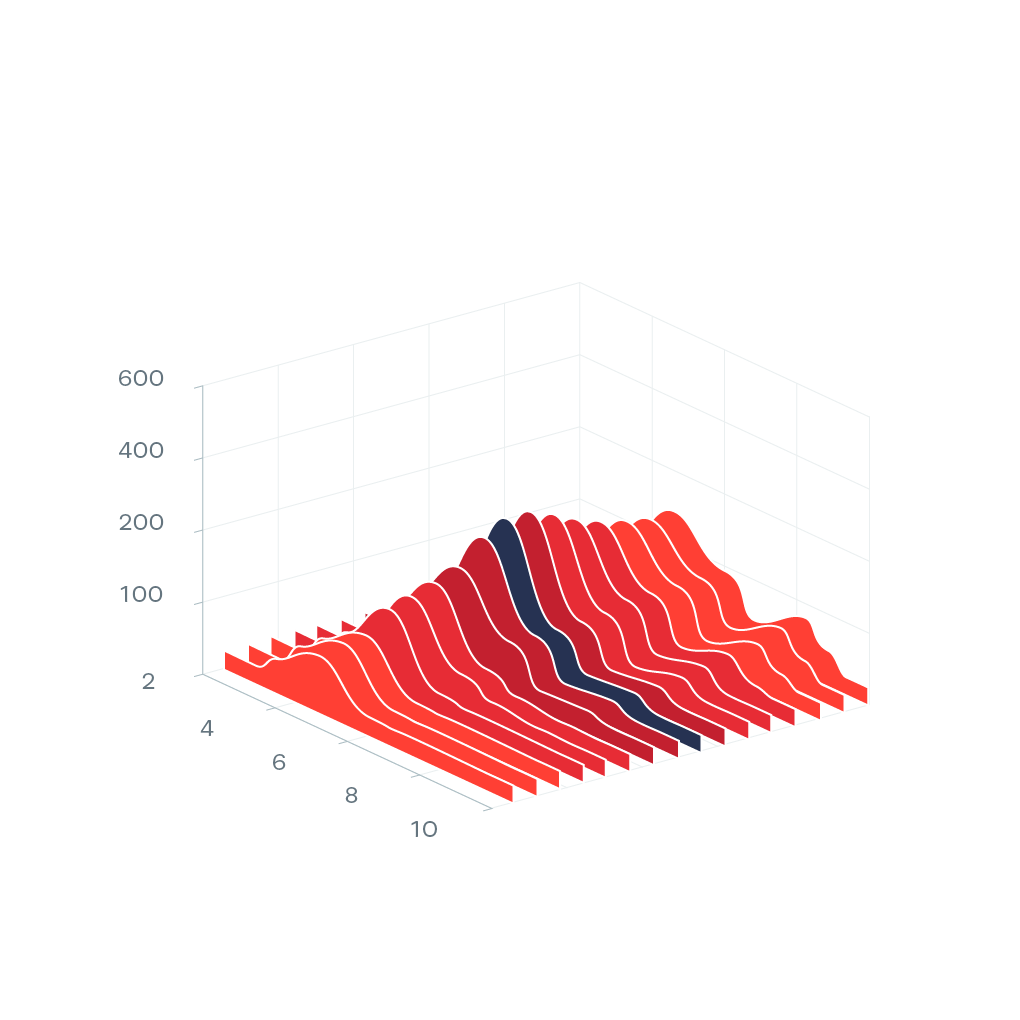
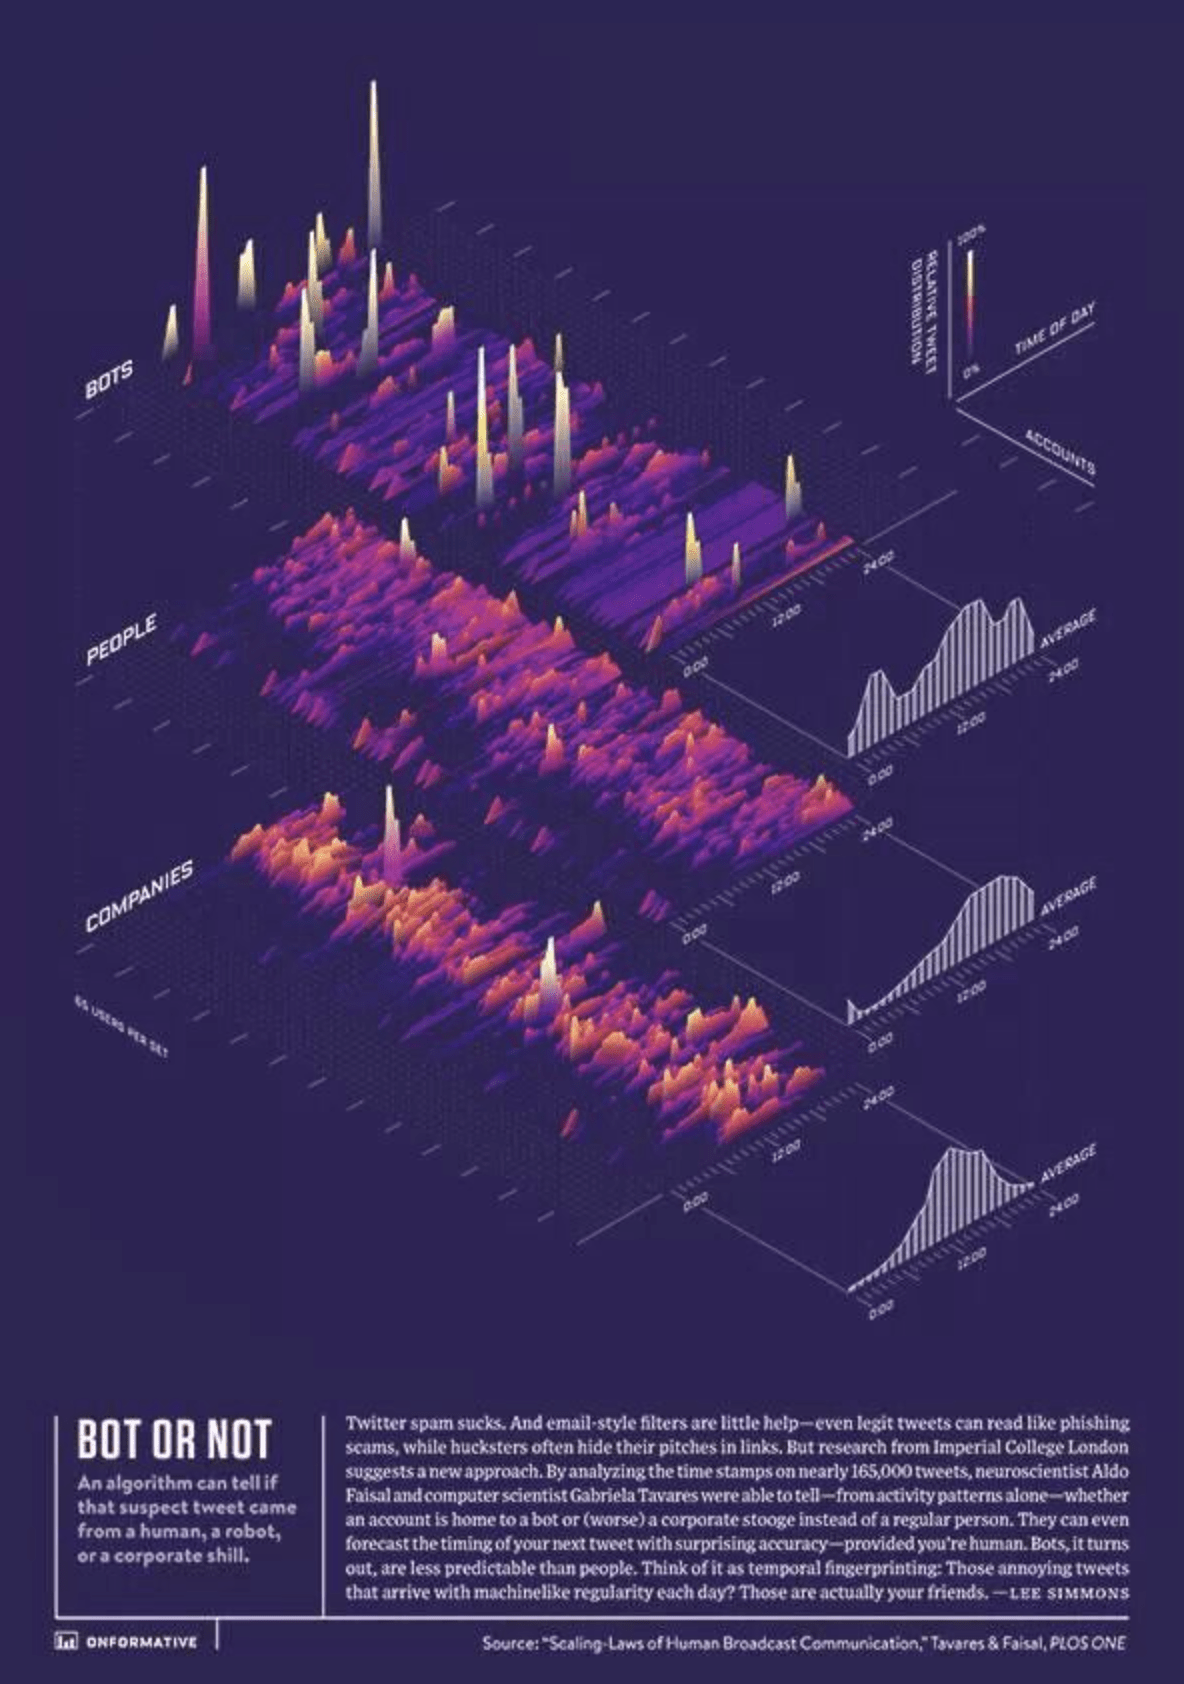
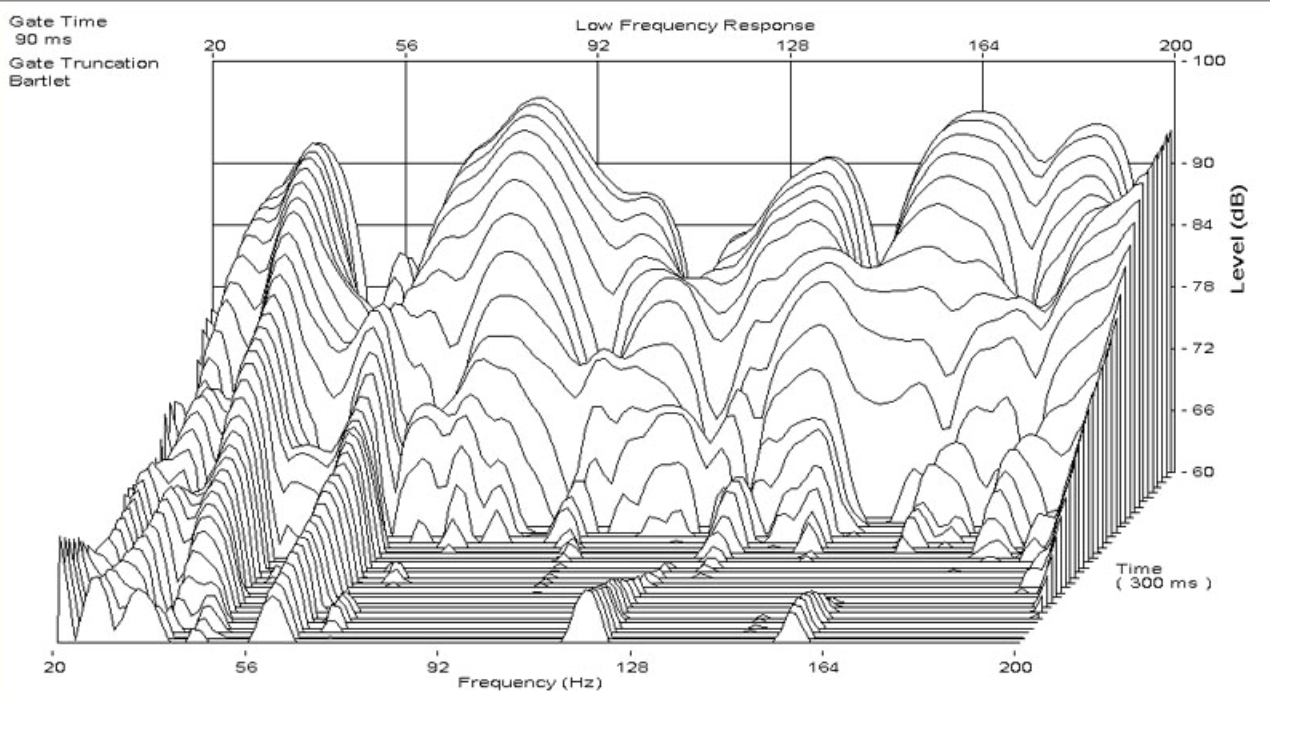
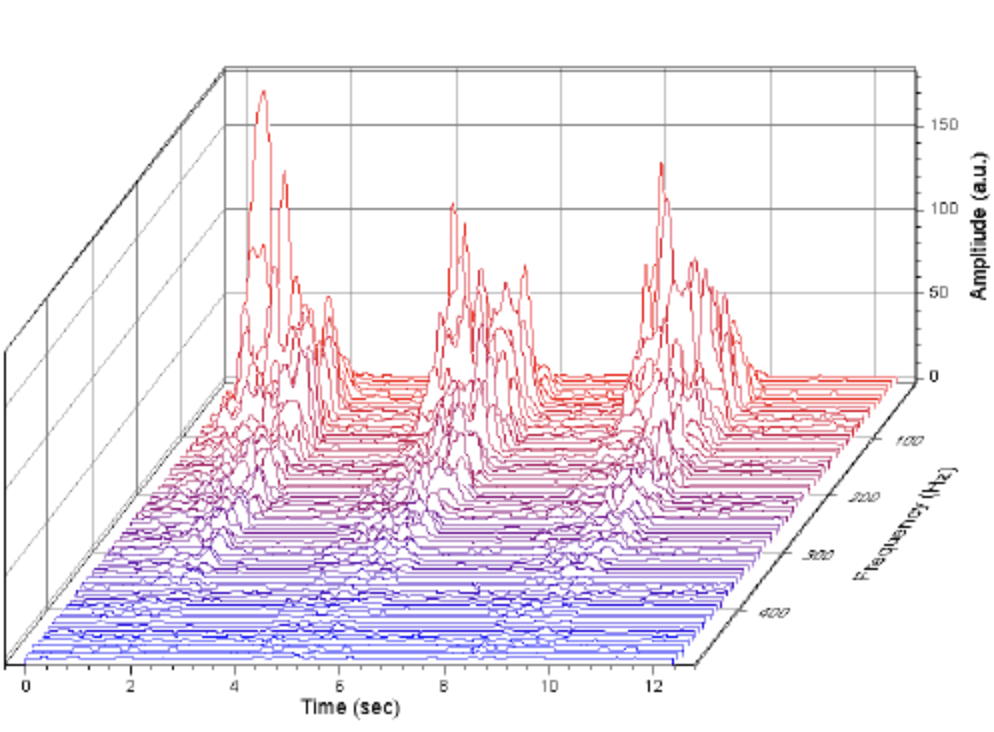
A Waterfall Plot is a three-dimensional plot in which multiple curves of data, typically spectra, are displayed simultaneously. Typically the curves are staggered both across the screen and vertically, with ‘nearer’ curves masking the ones behind. The result is a series of “mountain” shapes that appear to be side by side. The waterfall plot is often used to show how two-dimensional information changes over time or some other variable such as rpm.
Not to be confused with the similarly named Waterfall Chart.