Line Graph
Also called: Line Chart

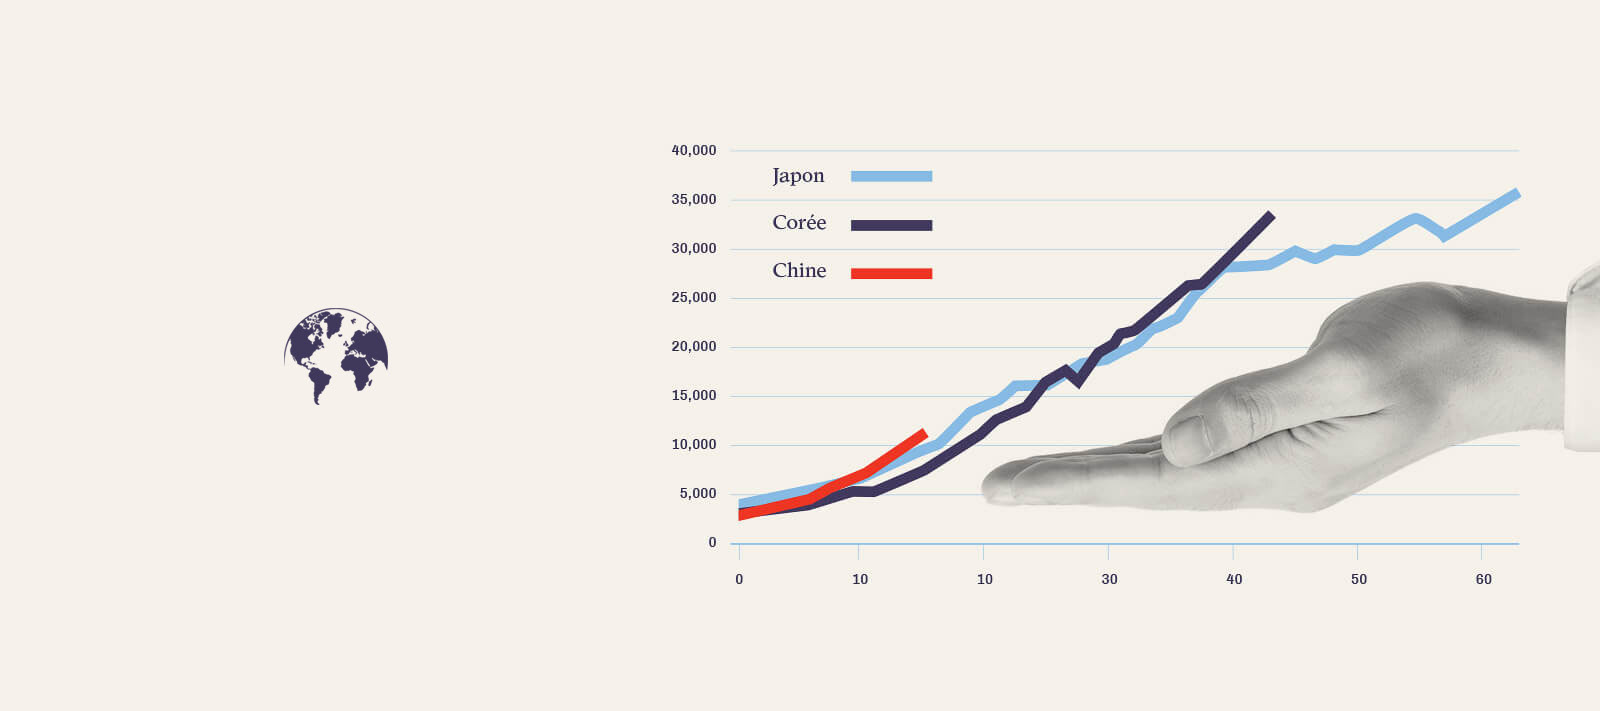
A line chart or line graph is a type of chart which displays information as a series of data points called ‘markers’ connected by straight line segments.
It is similar to a scatter plot except that the measurement points are ordered (typically by their x-axis value) and joined with straight line segments. Line Charts show how a particular data changes at equal intervals of time.
A line chart is similar to the spline graph, but the spline graph draws a curved line between the points instead of the straight lines.