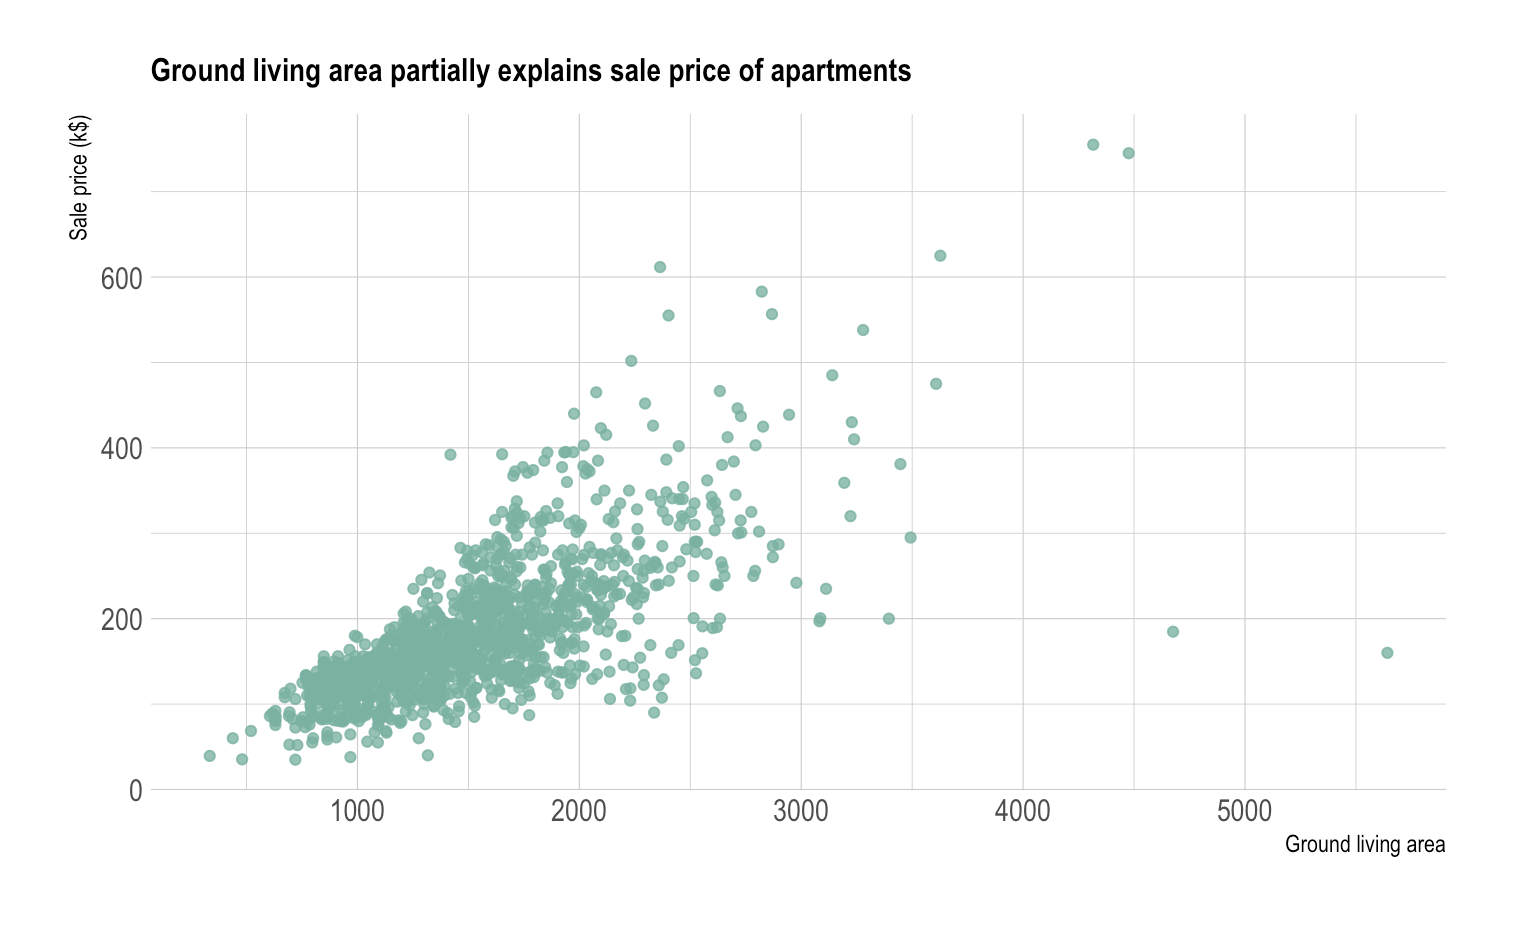
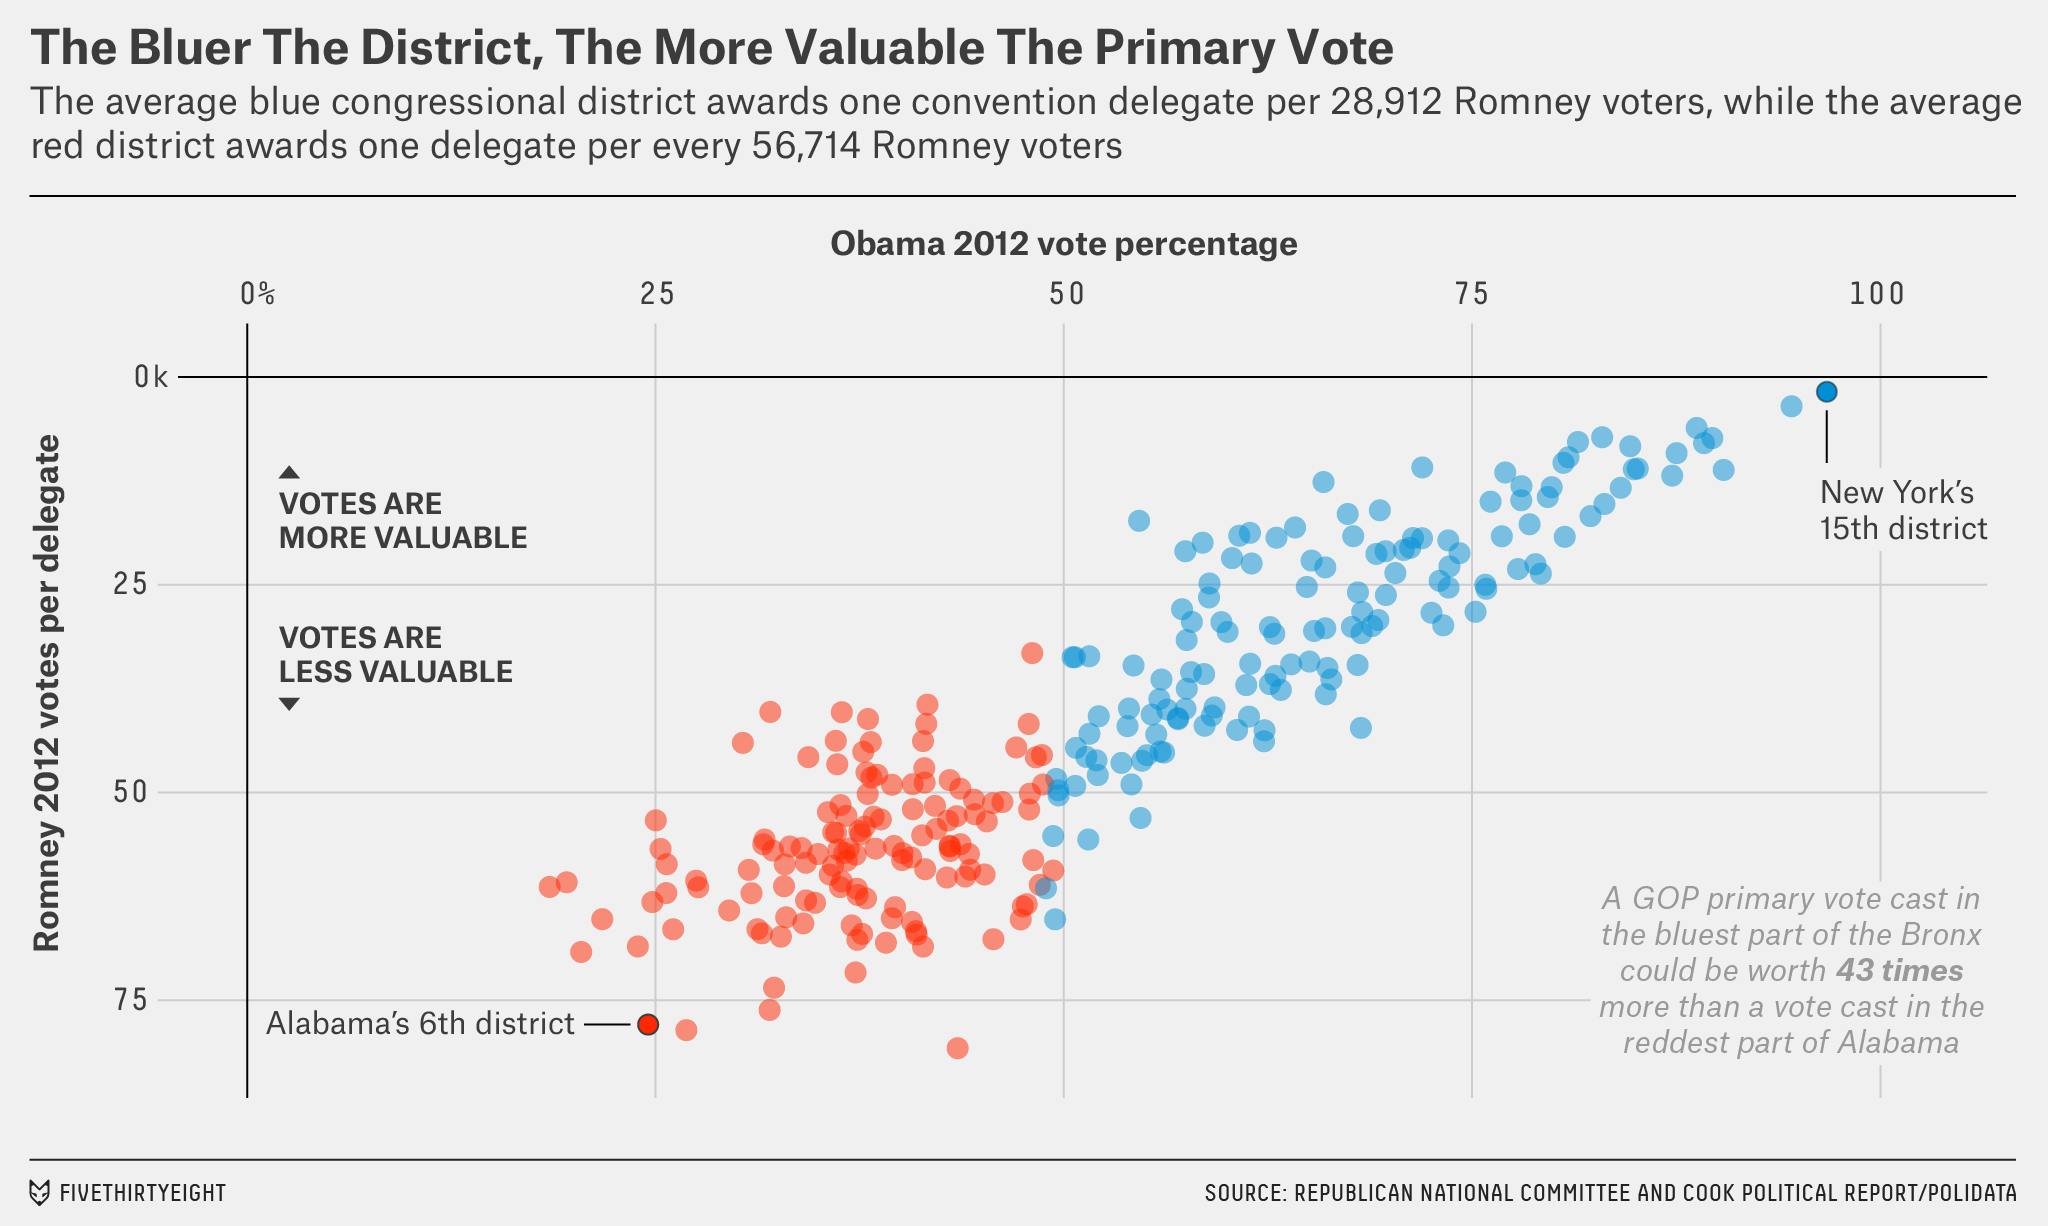
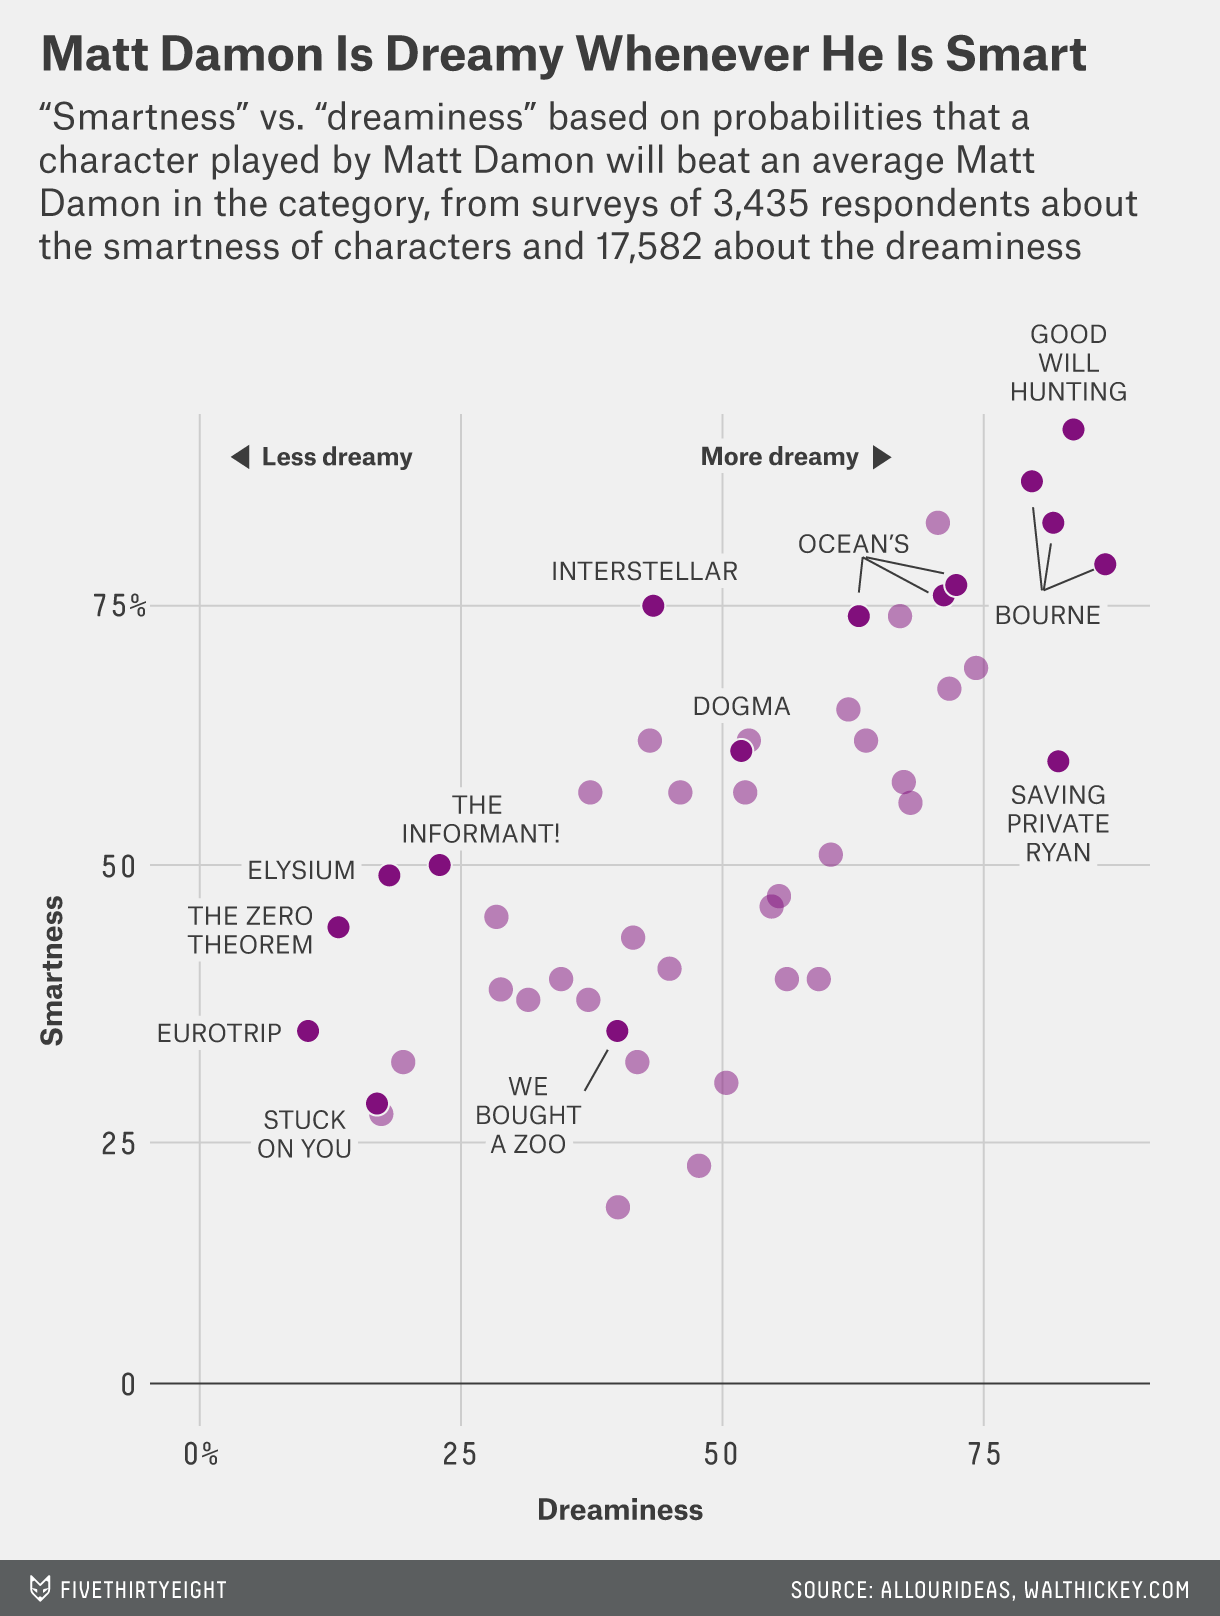
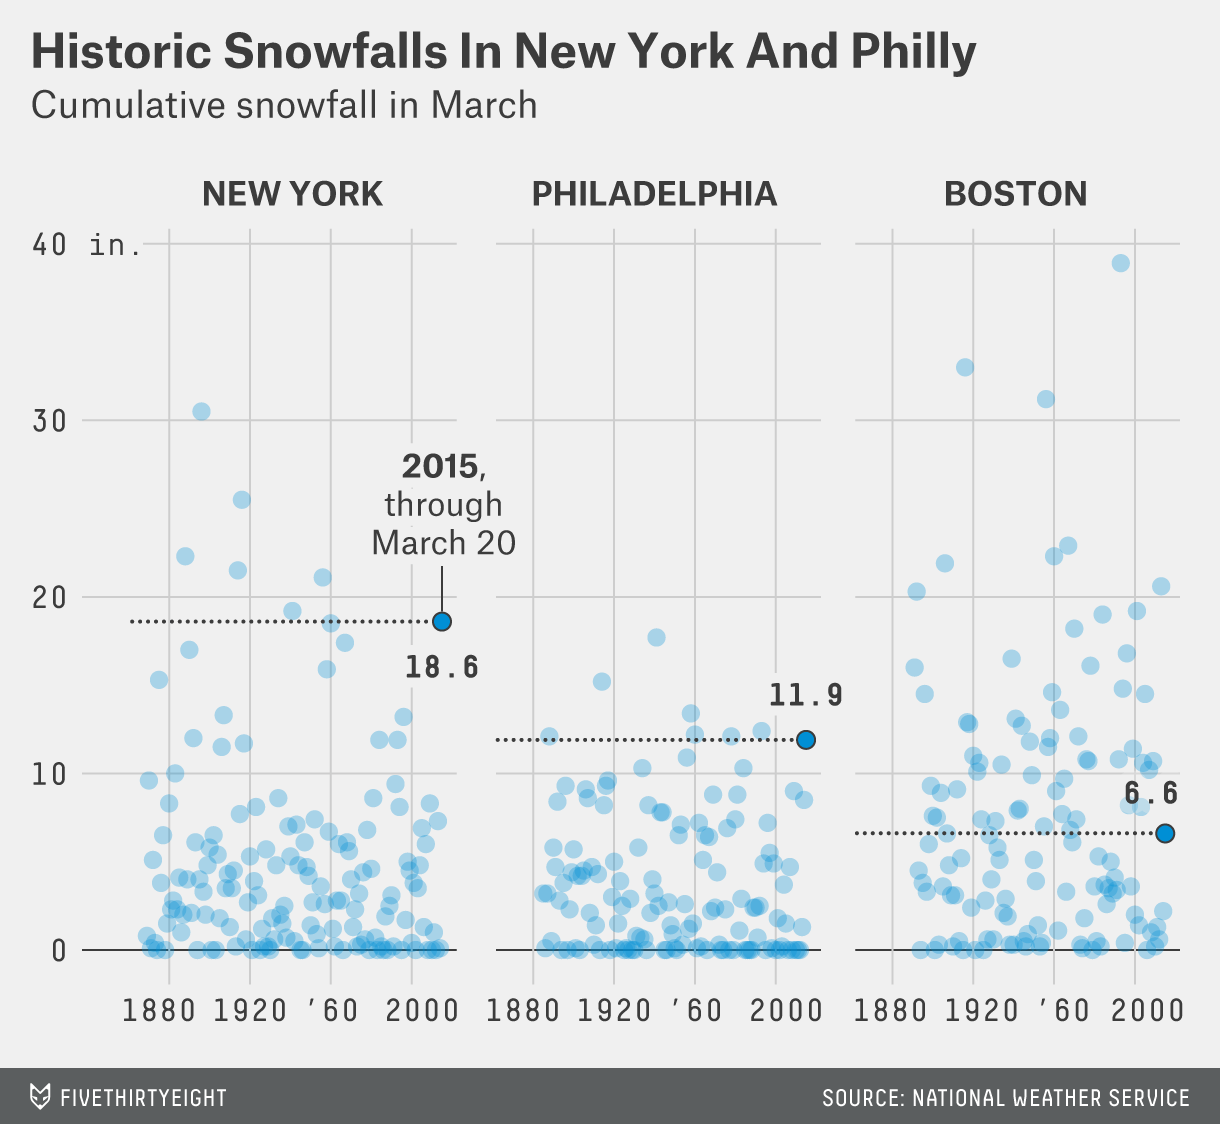
Scatter Plot
Also called: Scatter Chart, Scattergram, Scatter Diagram, Scatter Graph

A scatter plot is a type of mathematical diagram using Cartesian coordinates to display values for two variables for a set of data. The data is displayed as a collection of points, each having the value of one variable determining the position on the horizontal axis and the value of the other variable determining the position on the vertical axis.