Area Chart
Also called: Area Graph
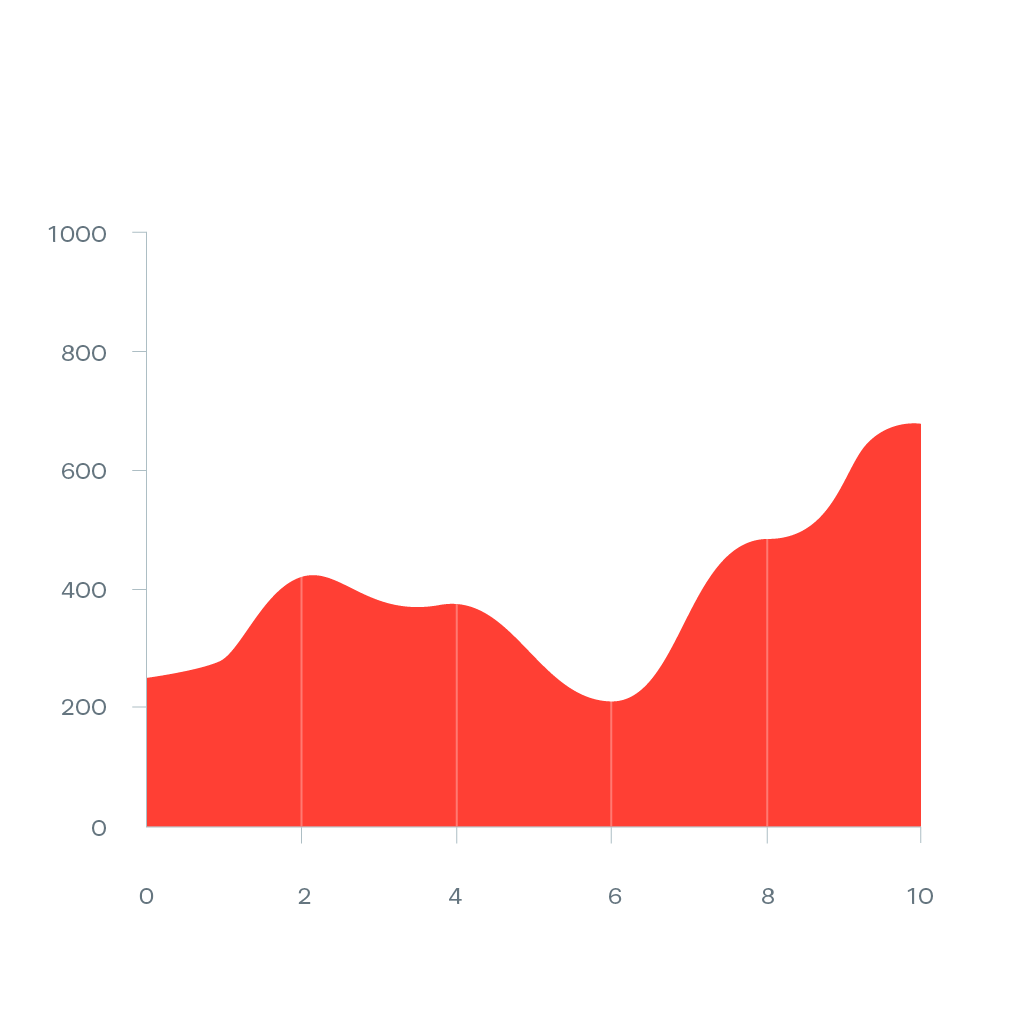
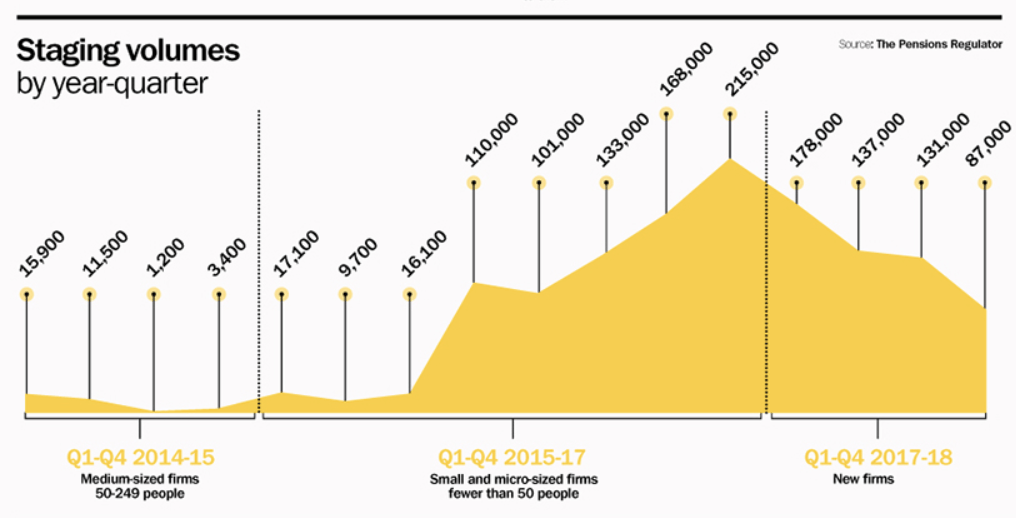
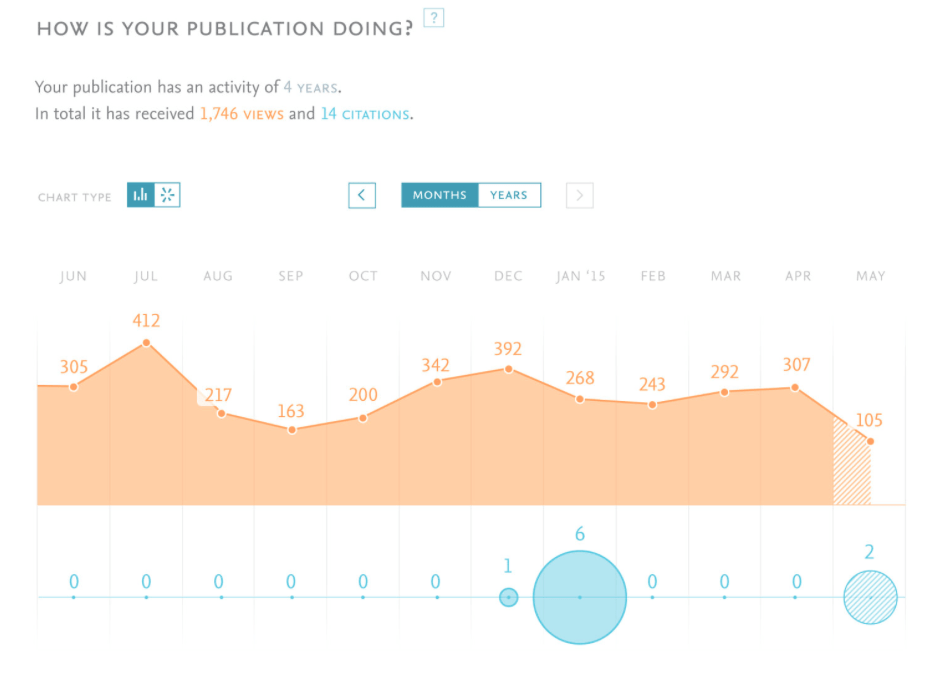
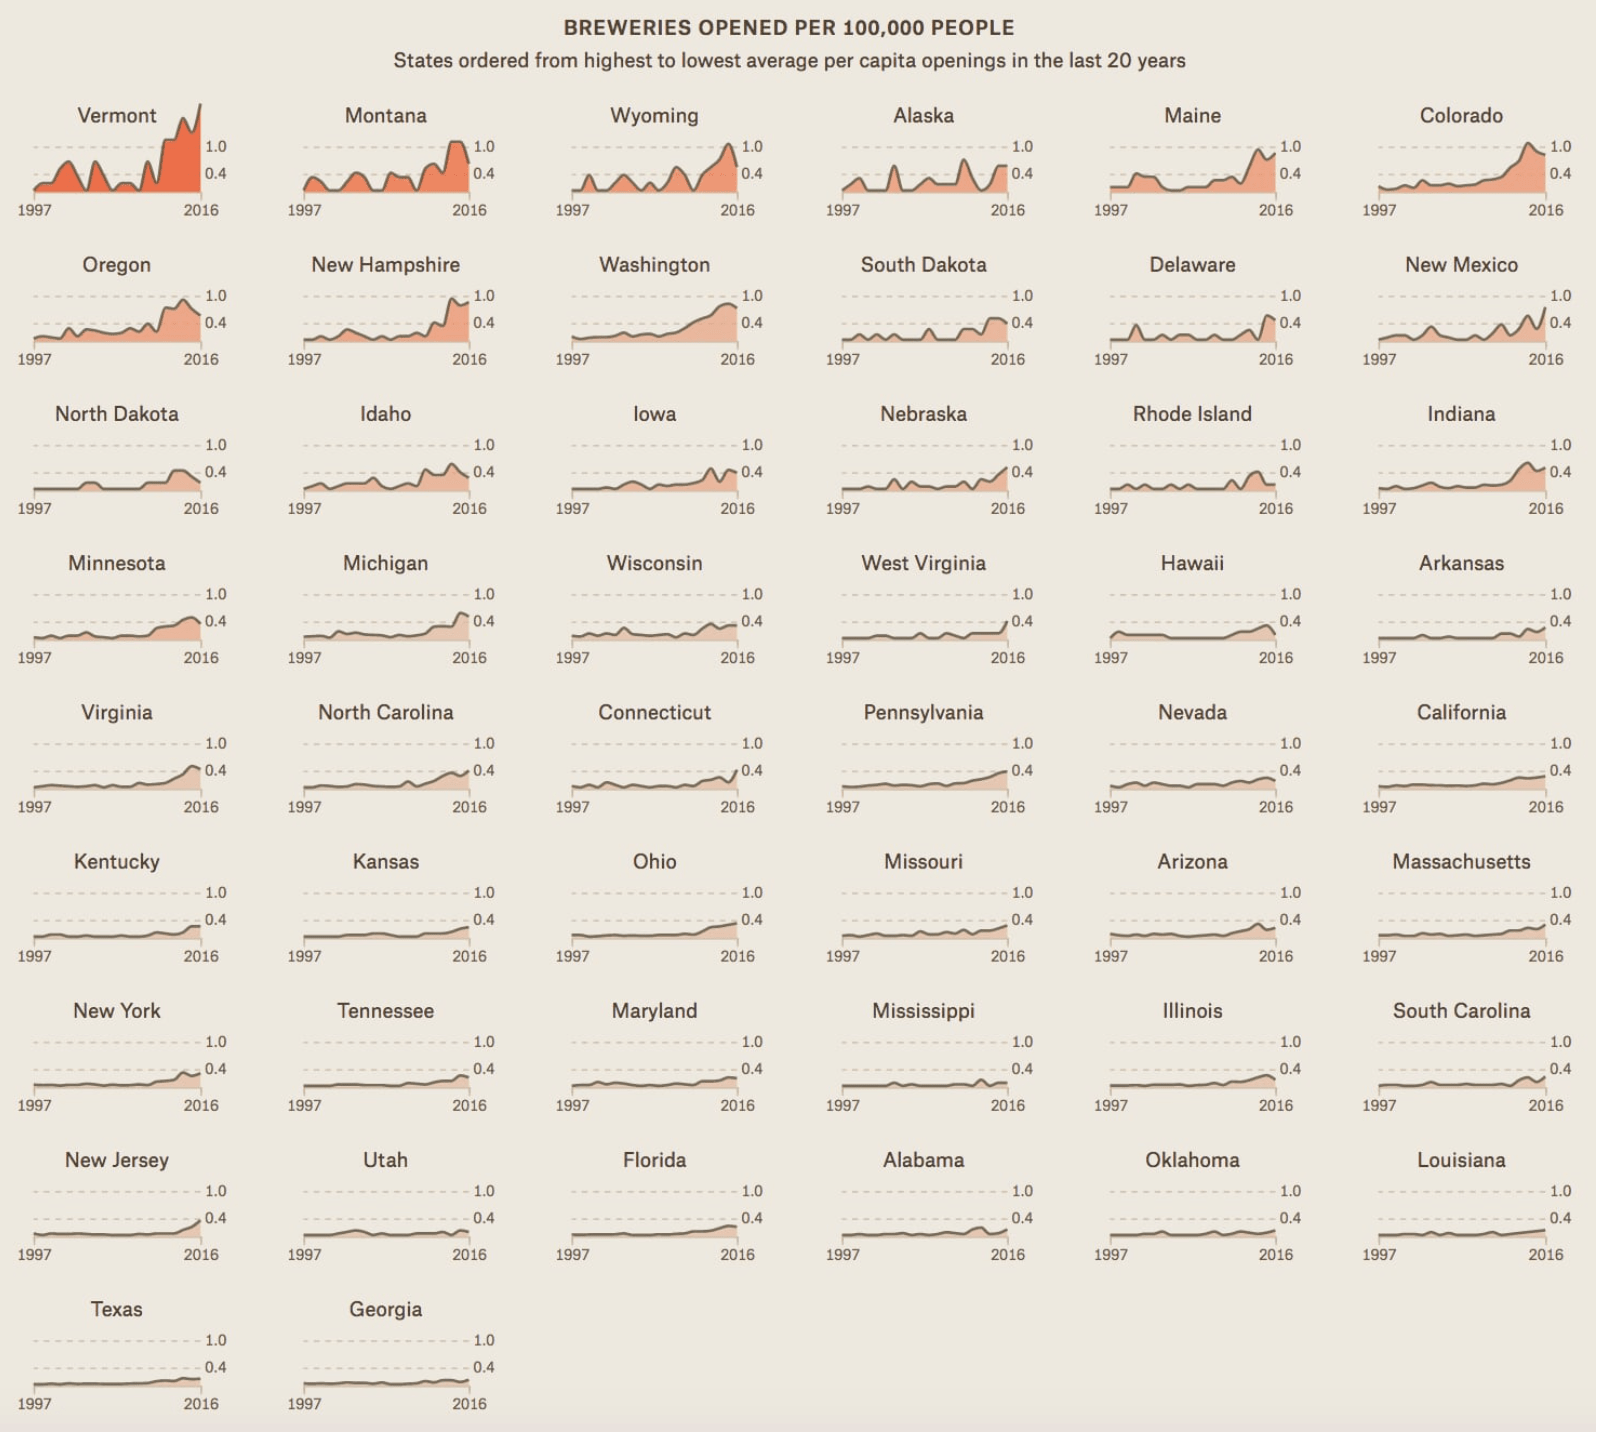
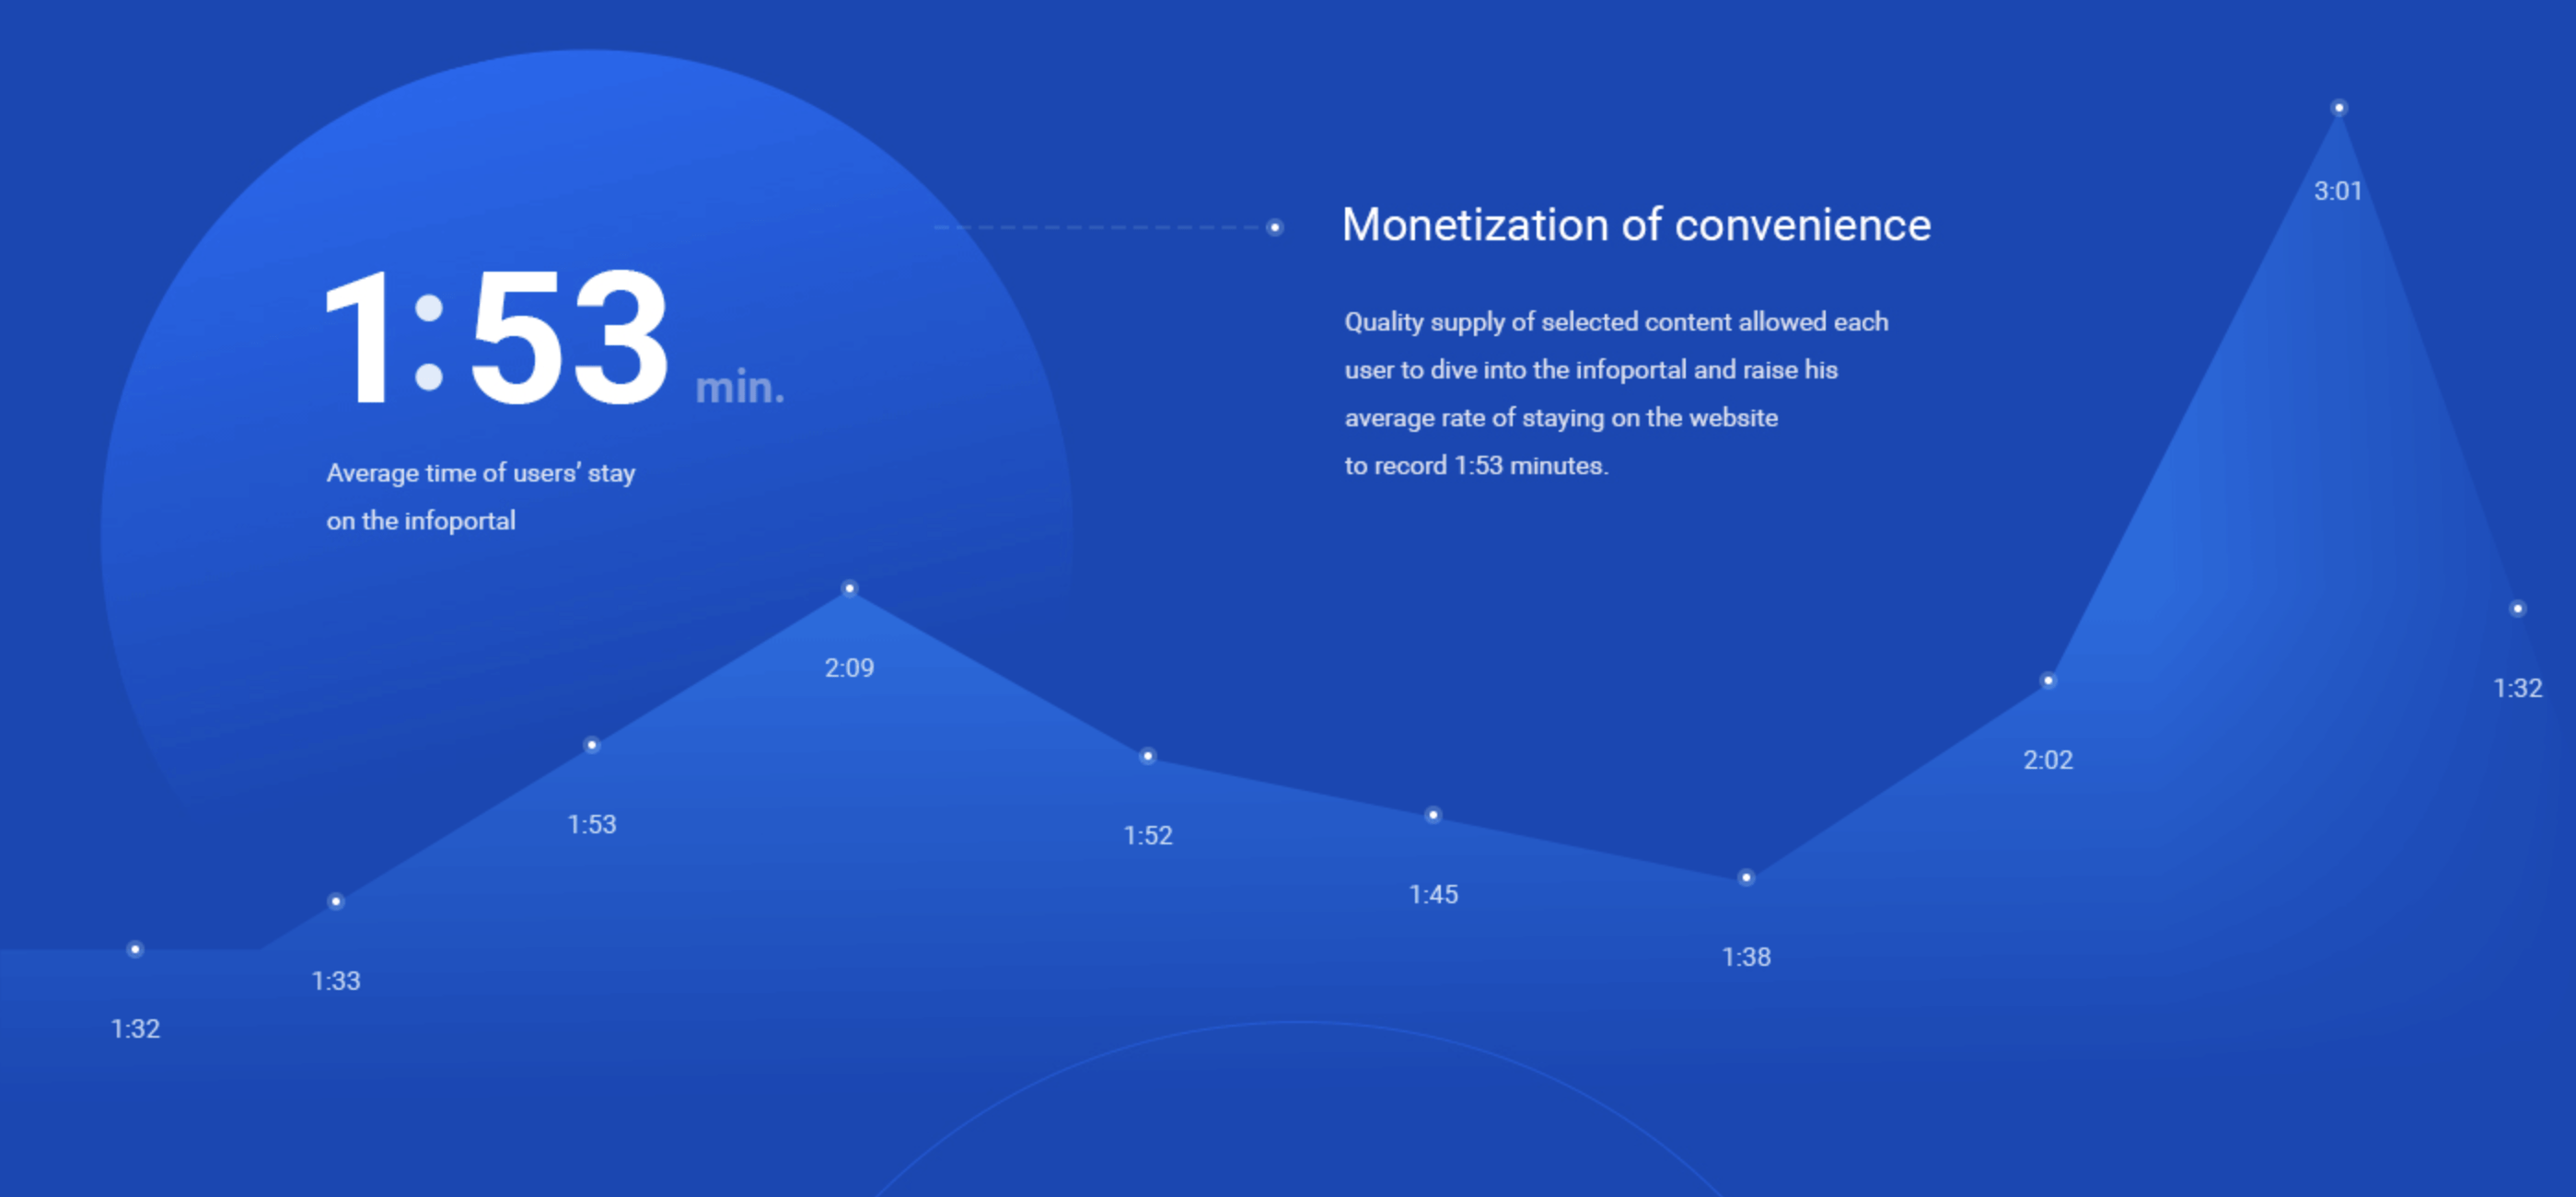
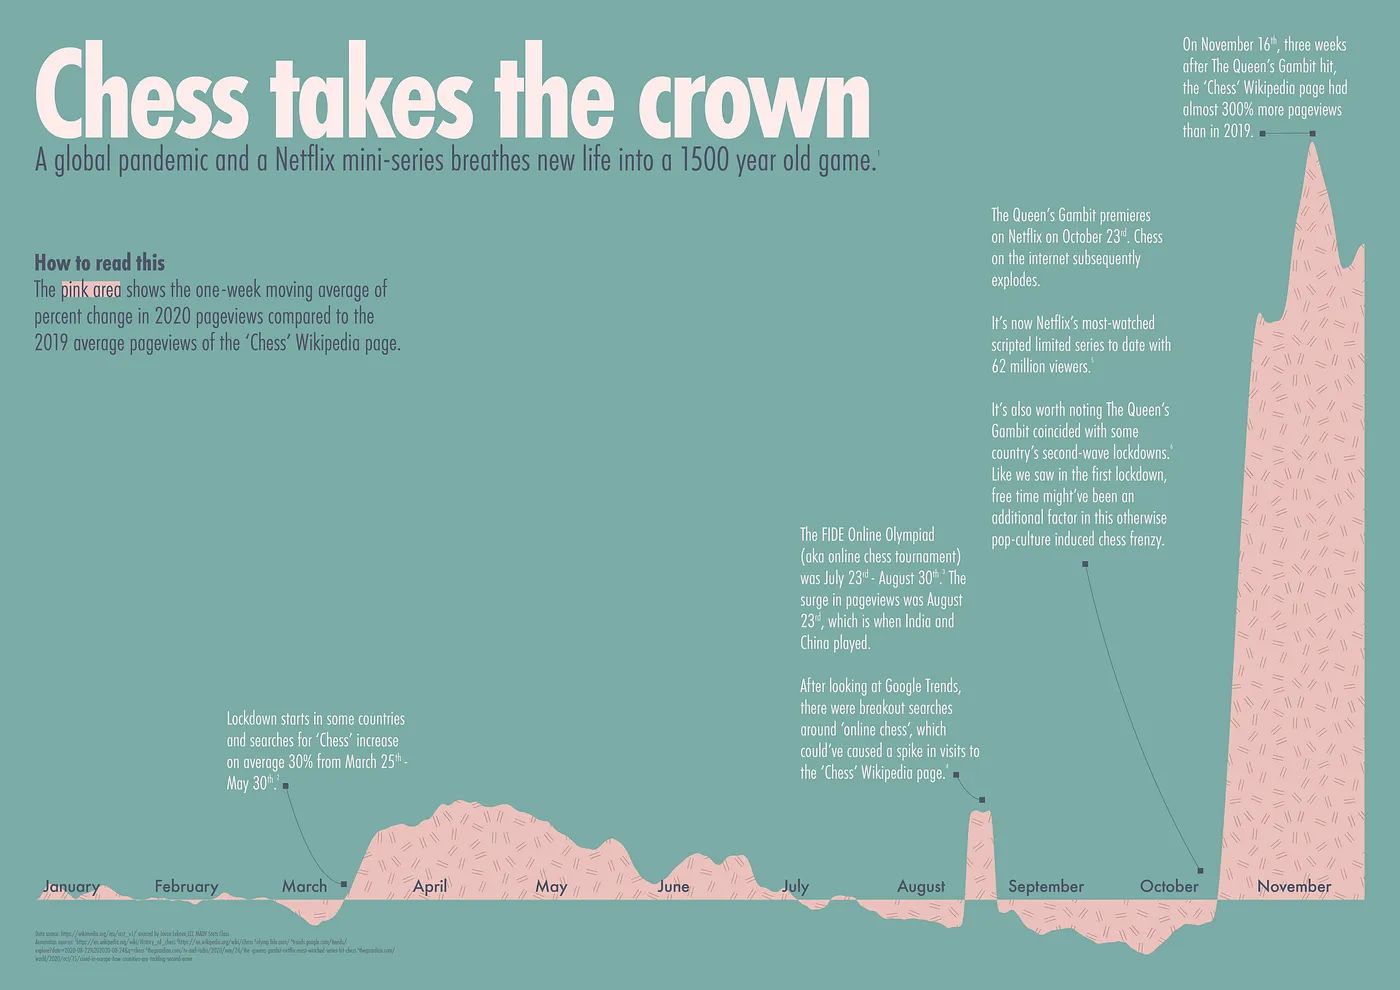
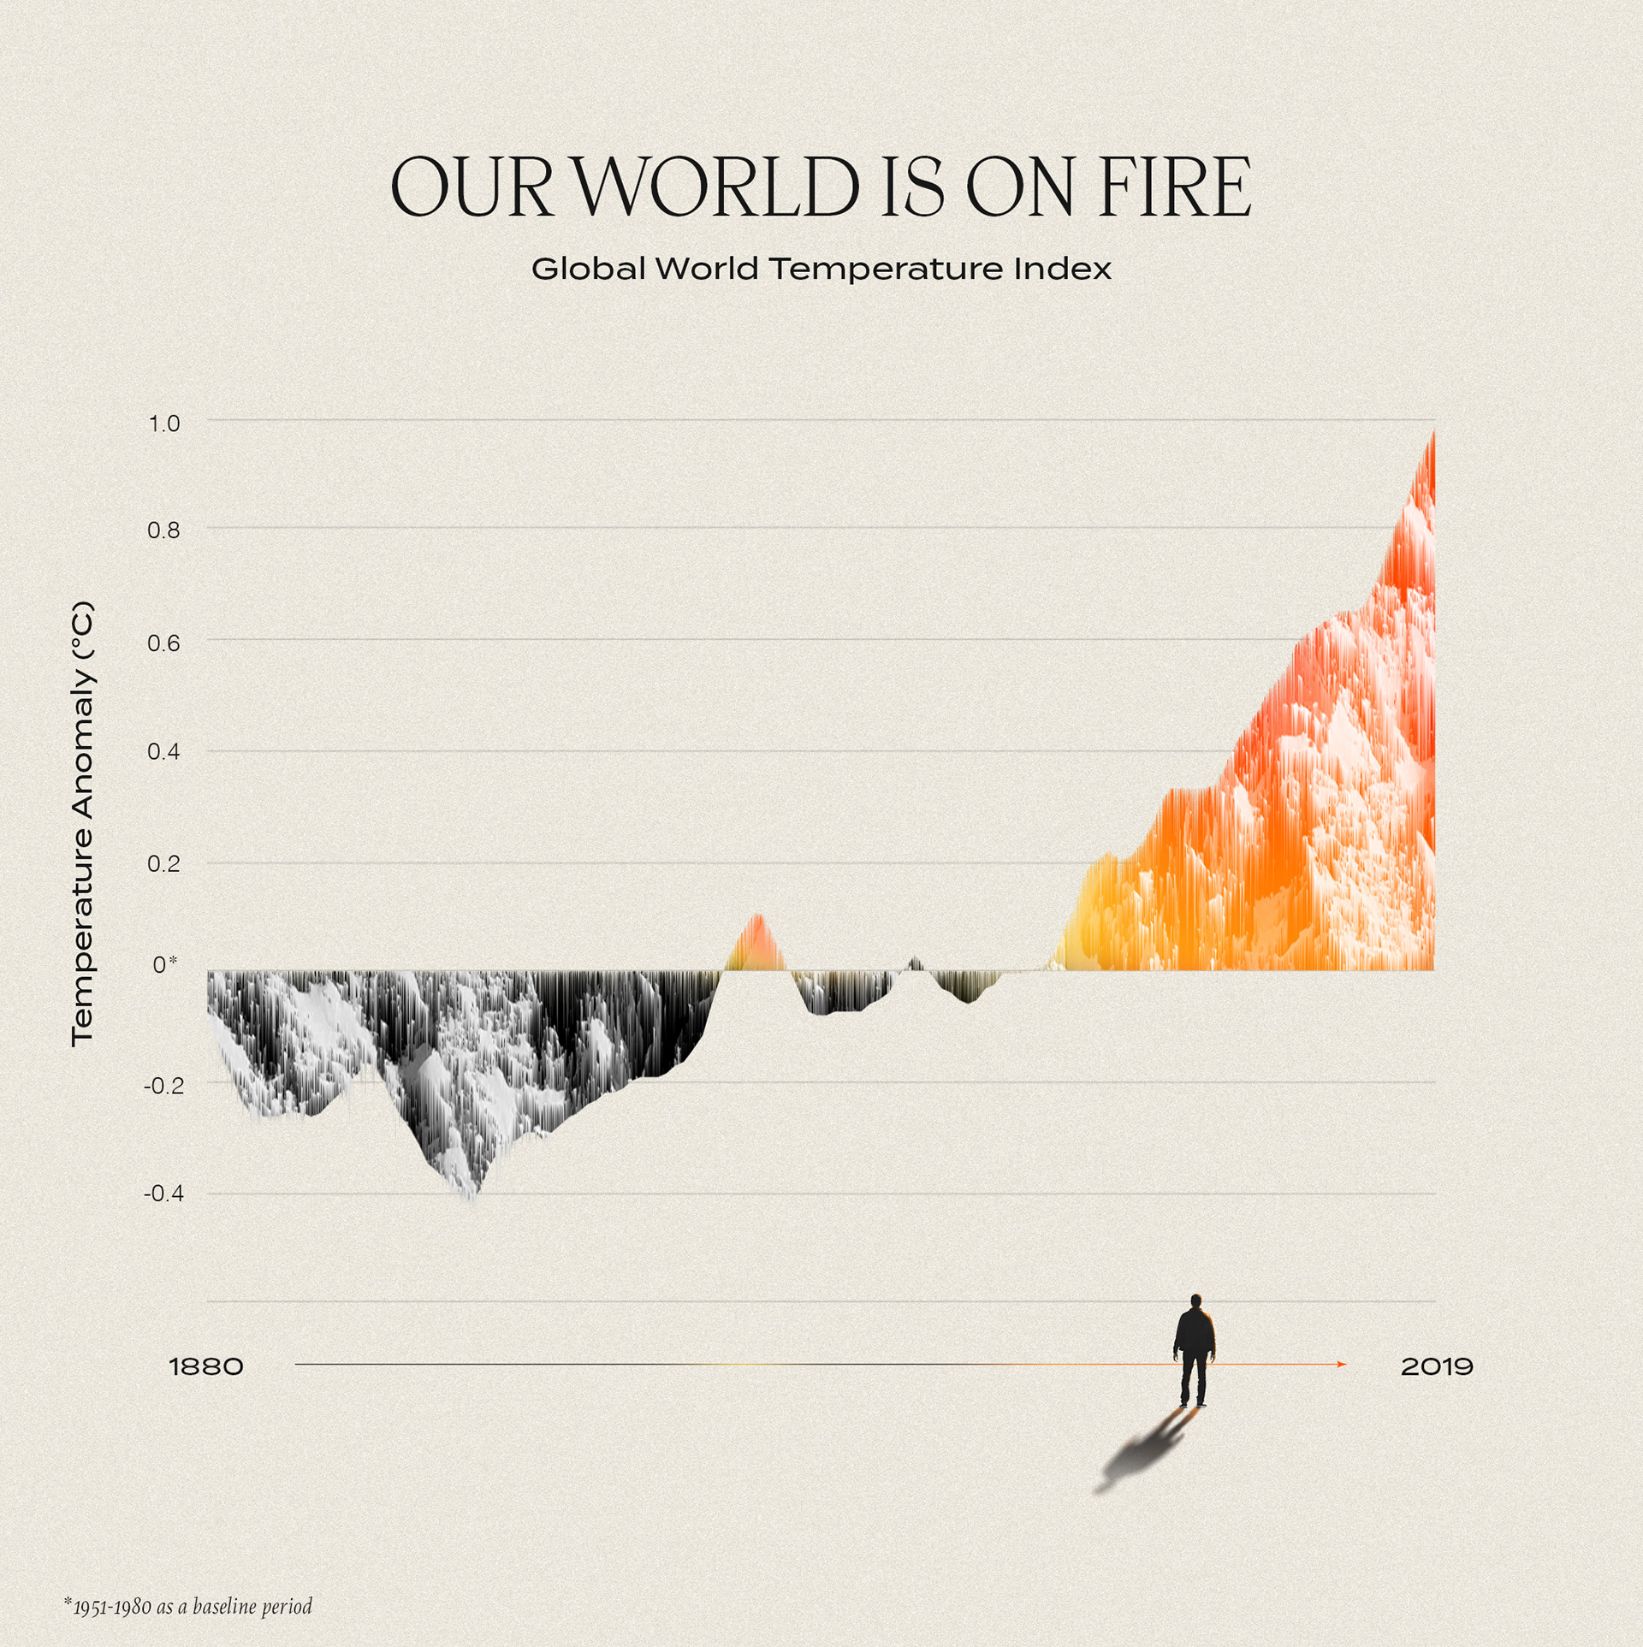
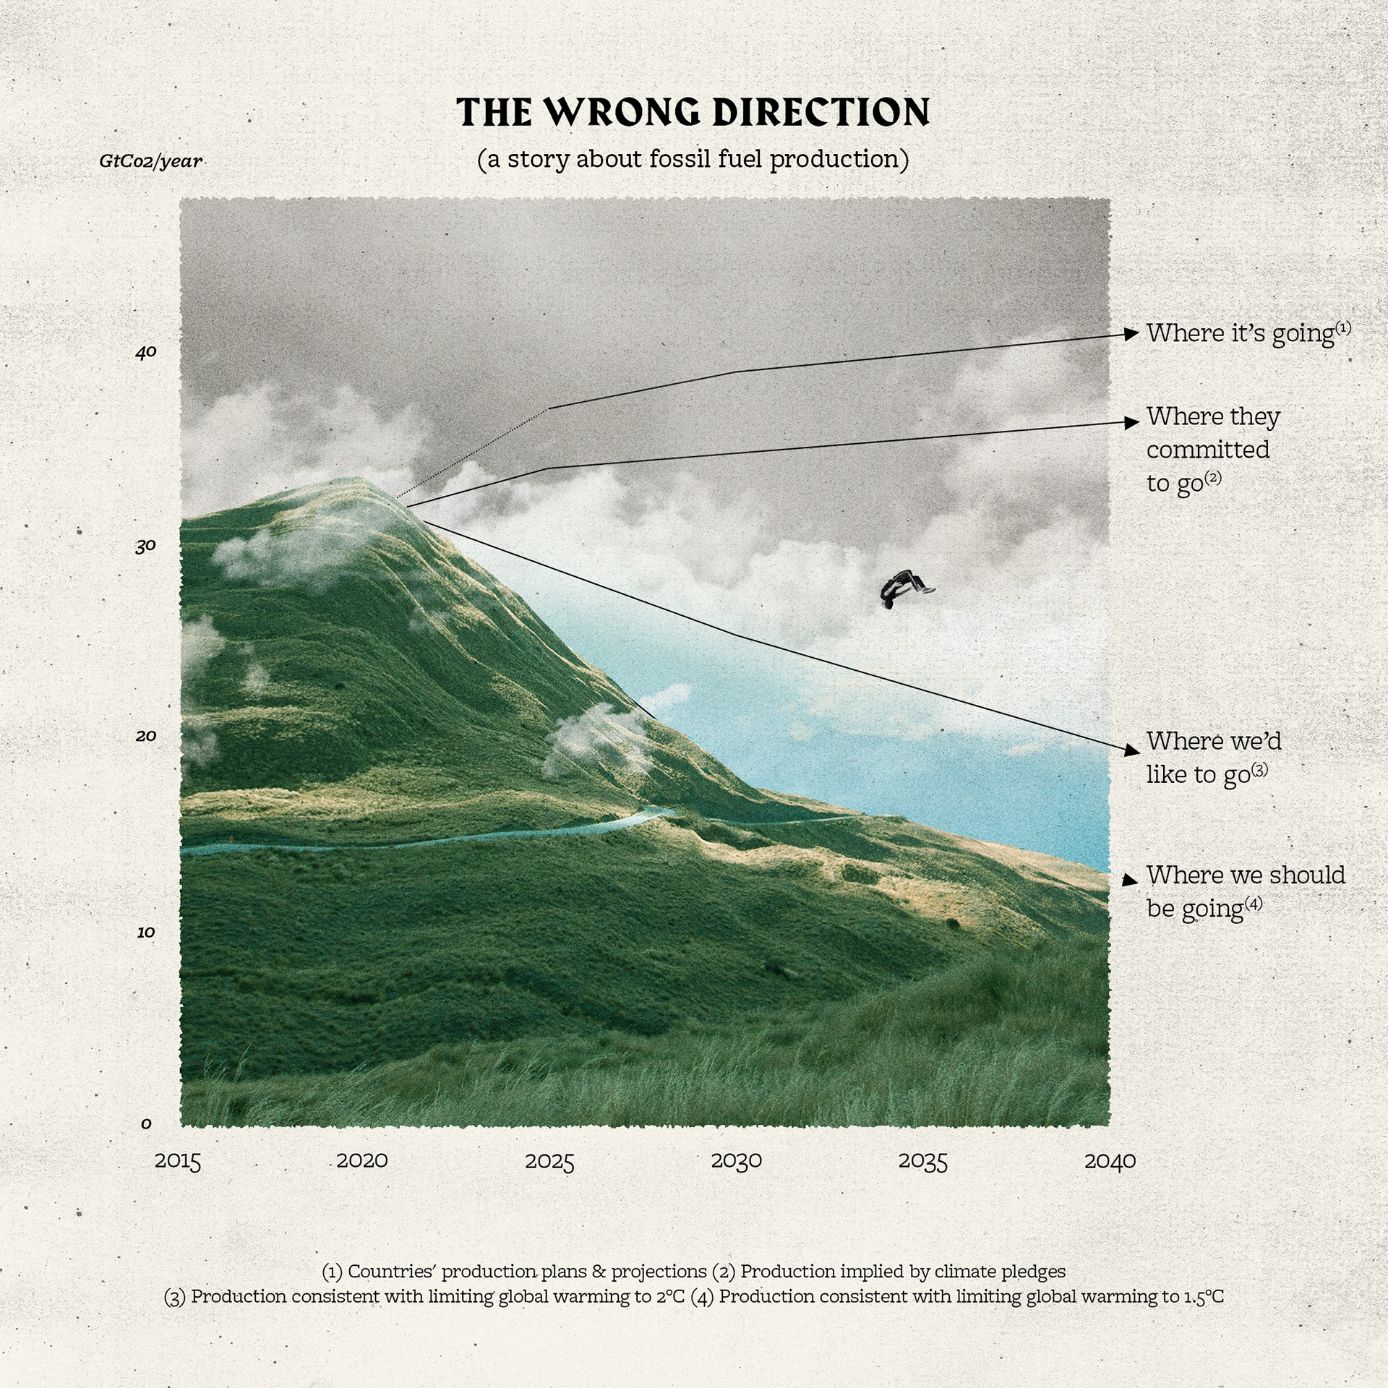
An Area Chart or area graph are basically a line graph with the area below the lined filled with colors or textures. Like line graphs area charts are used to represent the development of quantitative values over a time period. It can also be used to compare two or more categories and is similar to the Stacked Area Chart.
Area charts often used to show overall trends over time rather than specific values.