Network Visualisation
Also called: Network Graphs, Network Graph, Network Mapping
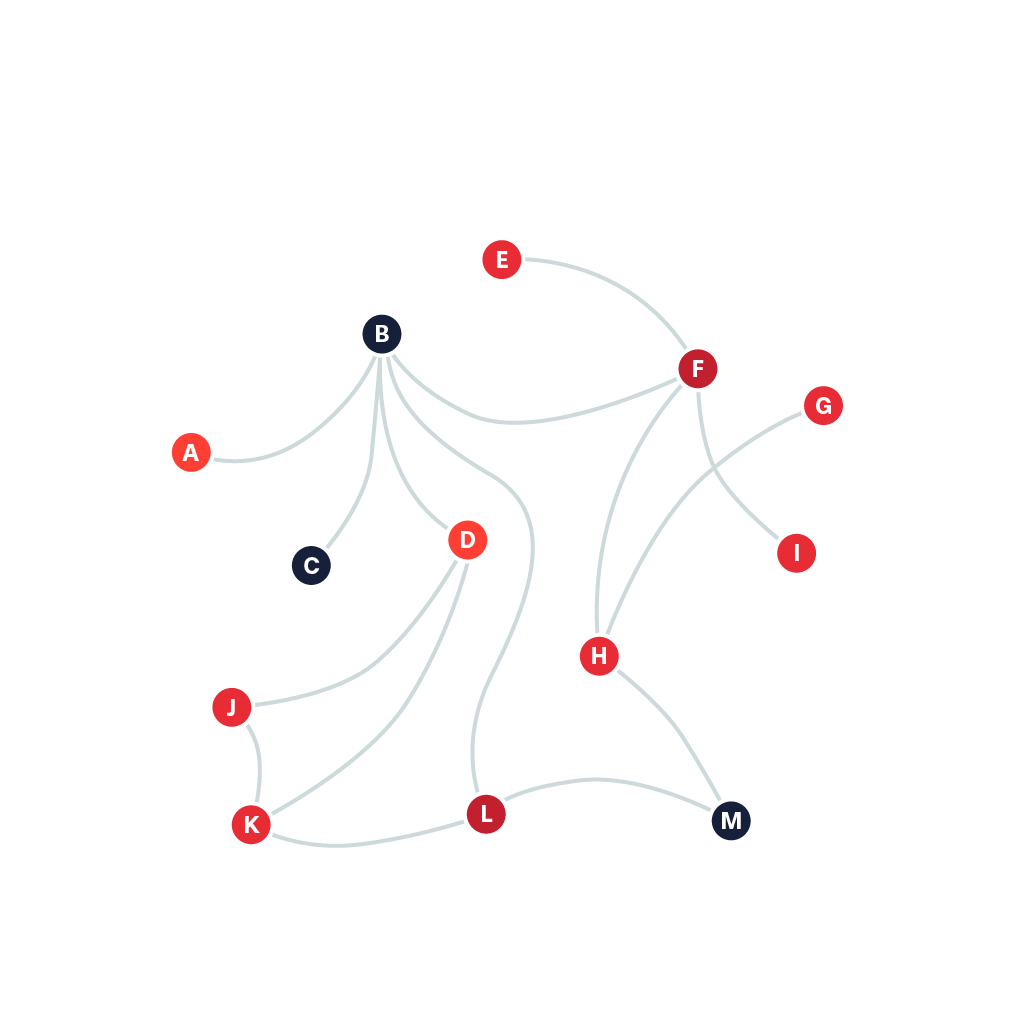
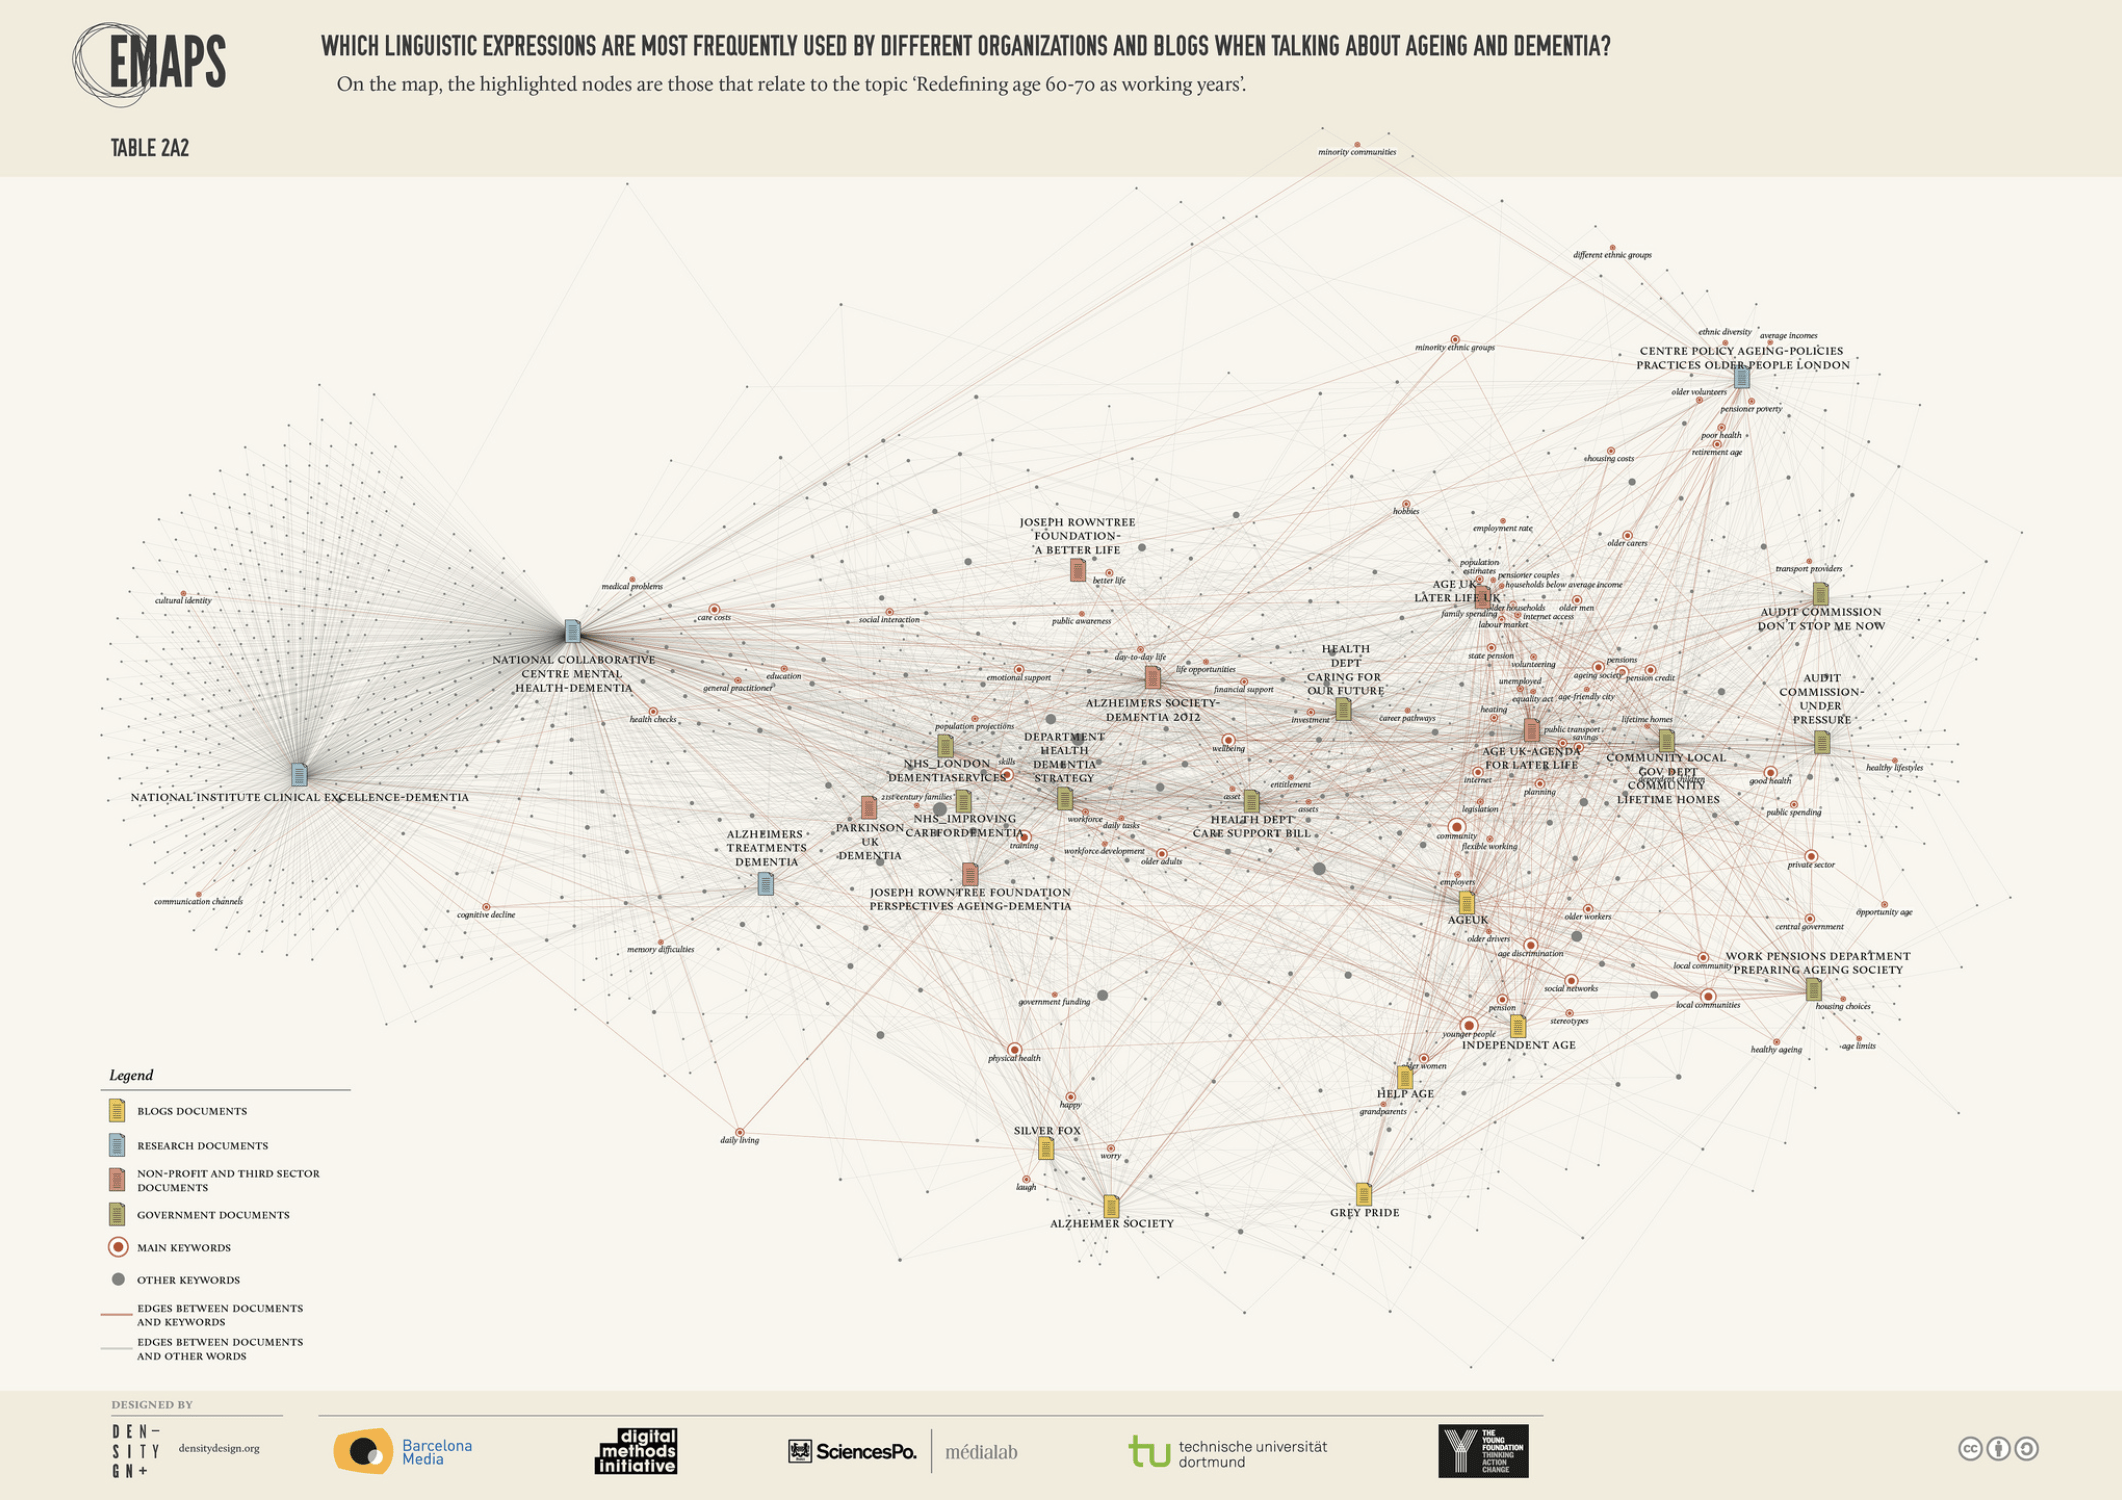
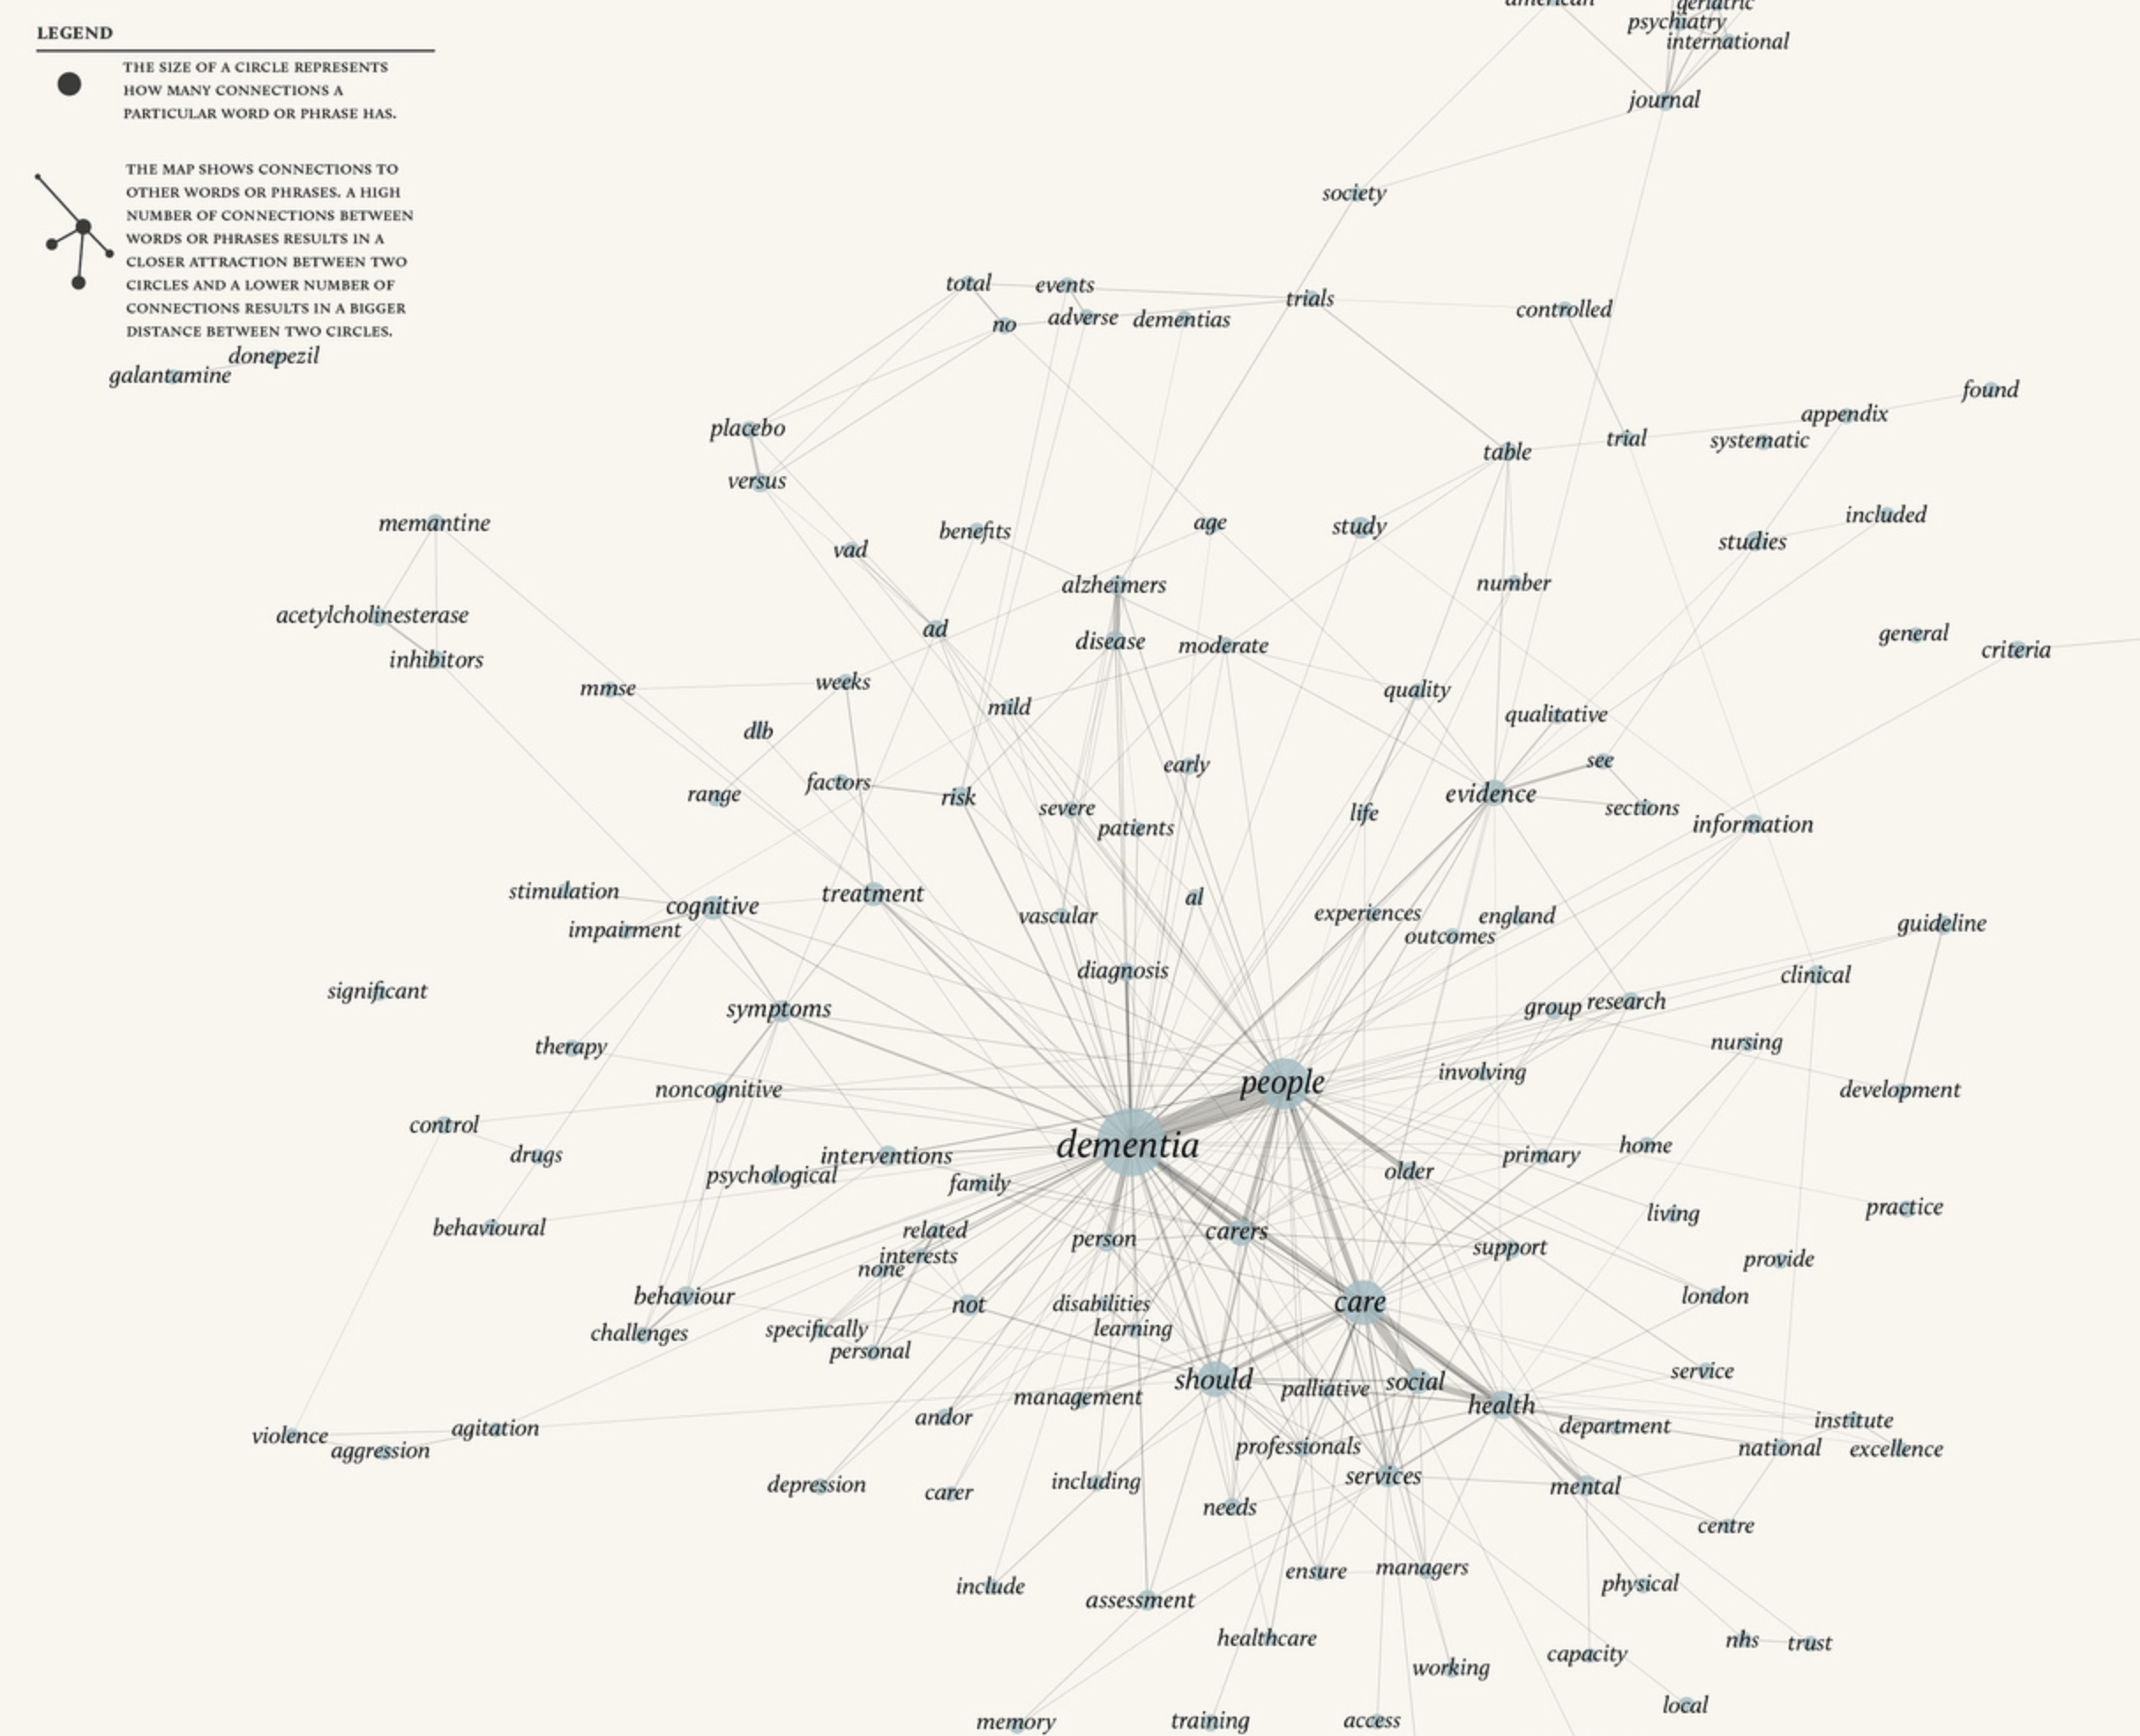
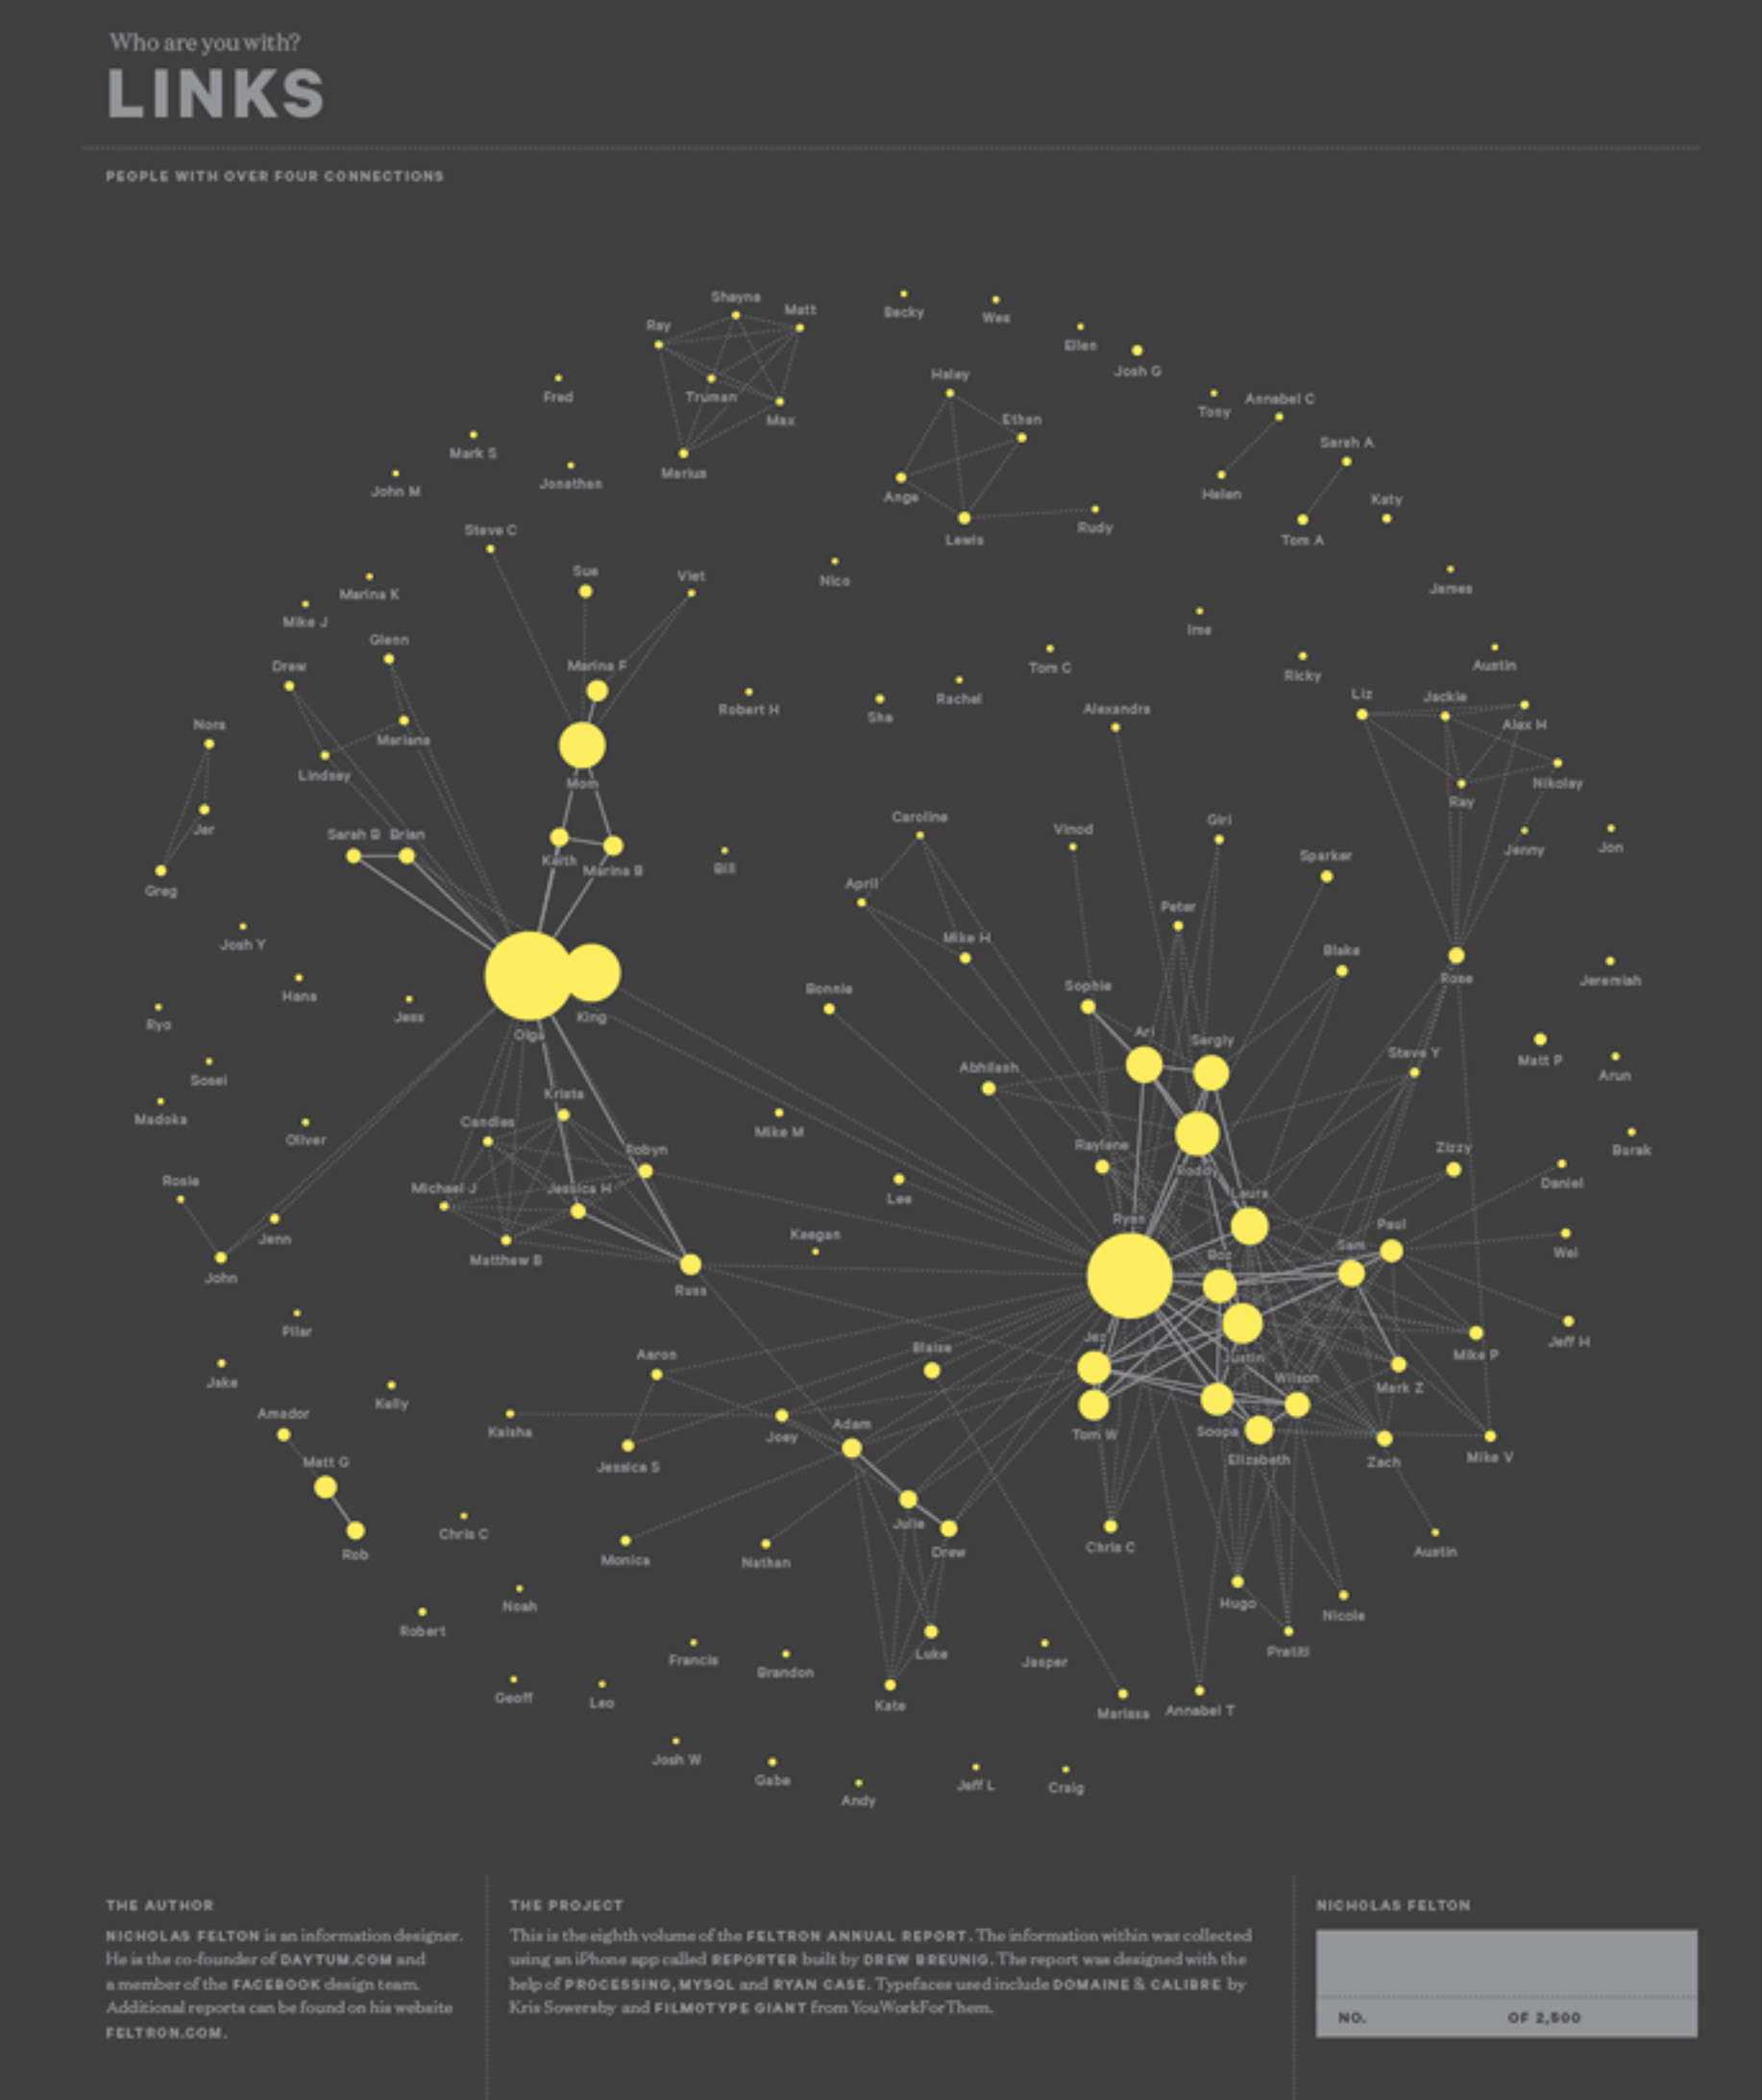
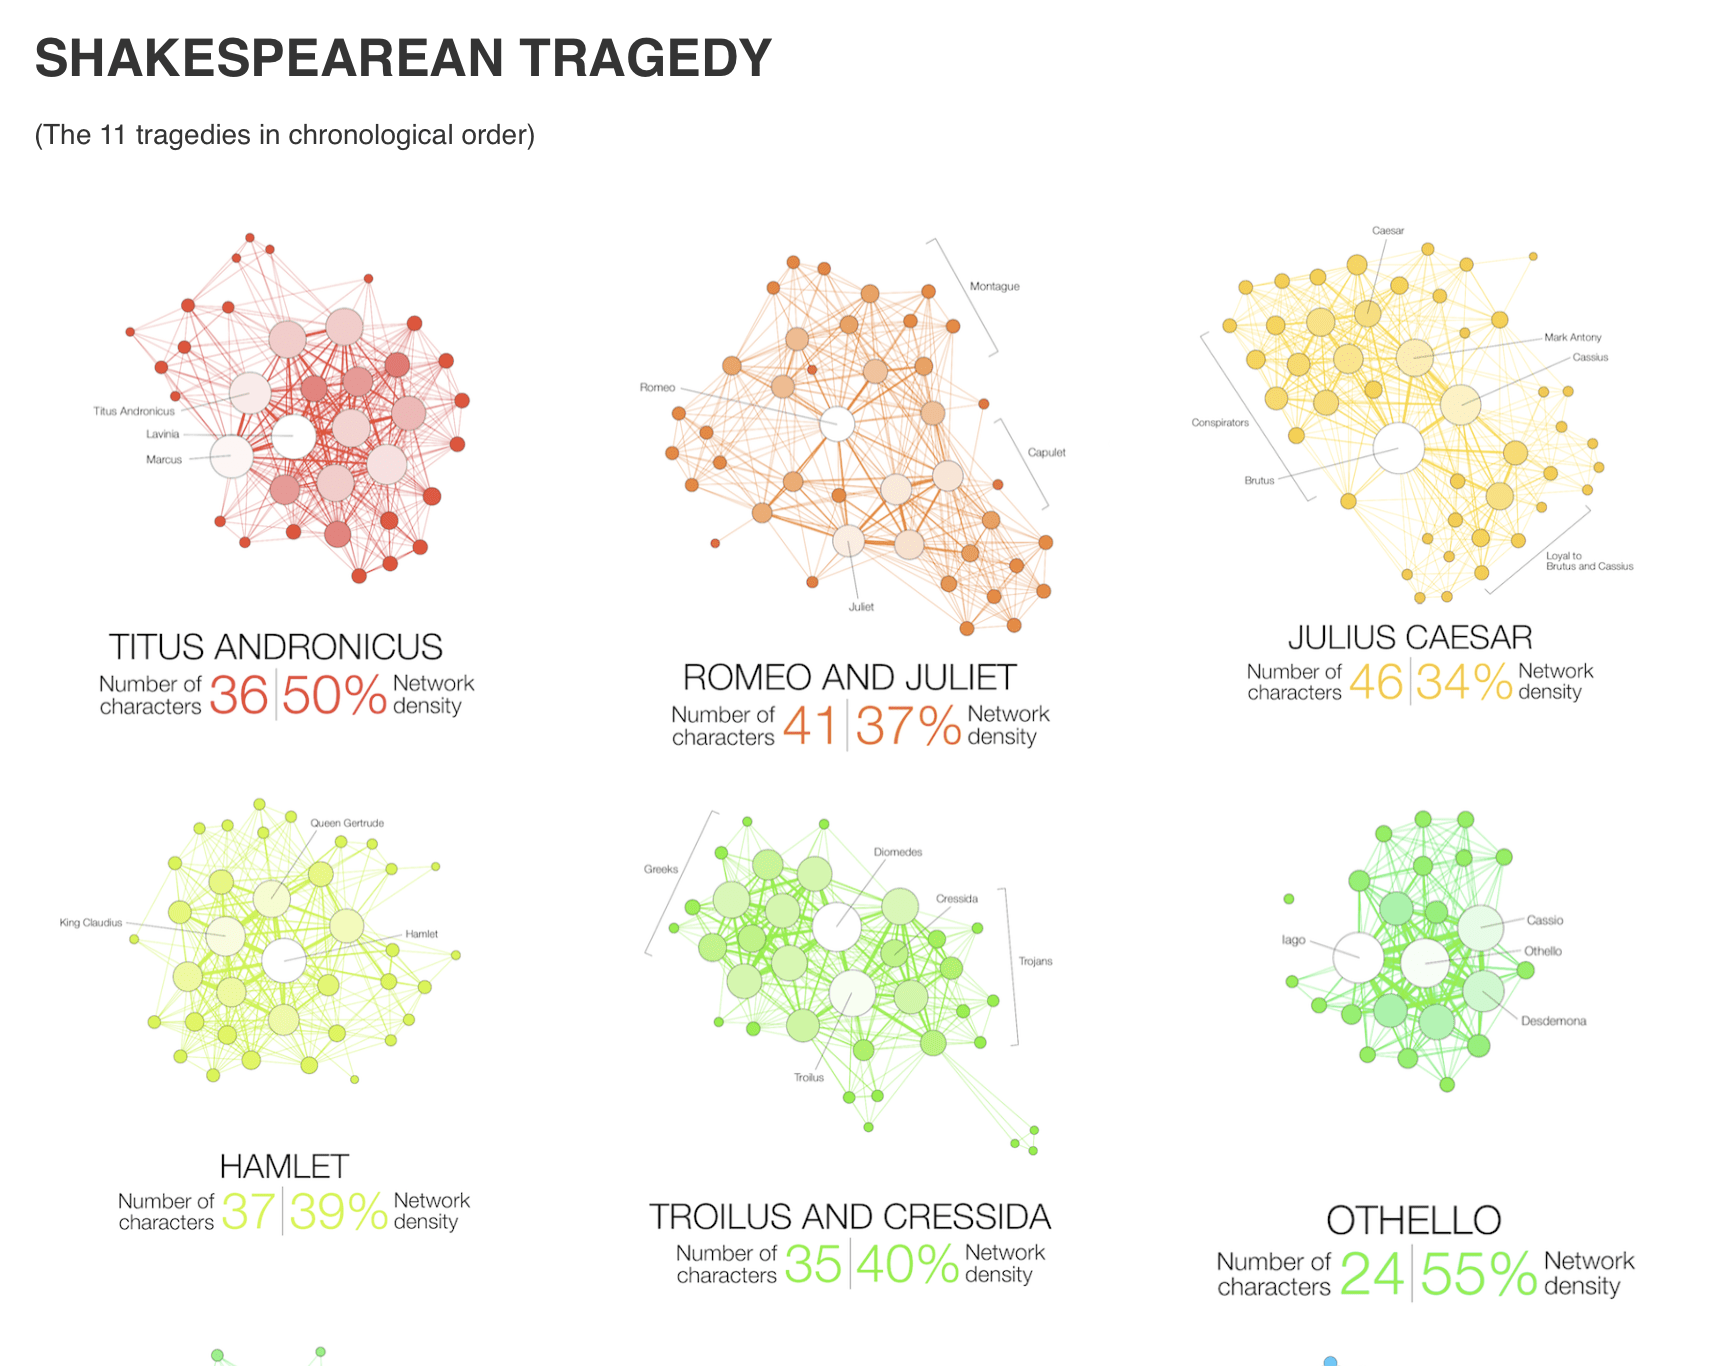
Network Visualisation (also called Network Graph) is often used to visualise complex relationships between a huge amount of elements. A network visualisation displays undirected and directed graph structures. This type of visualization illuminates relationships between entities. Entities are displayed as round nodes and lines show the relationships between them. The vivid display of network nodes can highlight non-trivial data discrepancies that may be otherwise be overlooked.