Waterfall Chart
Also called: Waterfall Plot, Flying Bricks Chart, Mario Chart
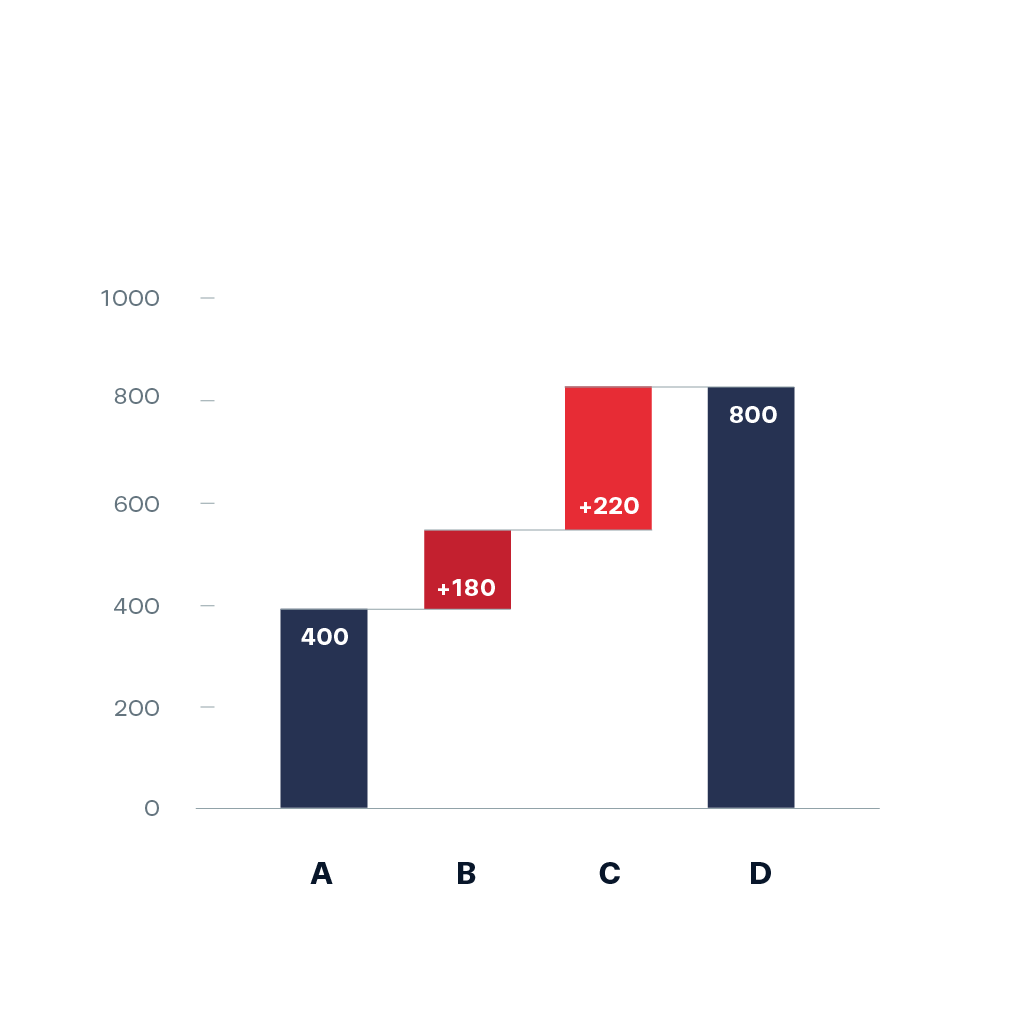
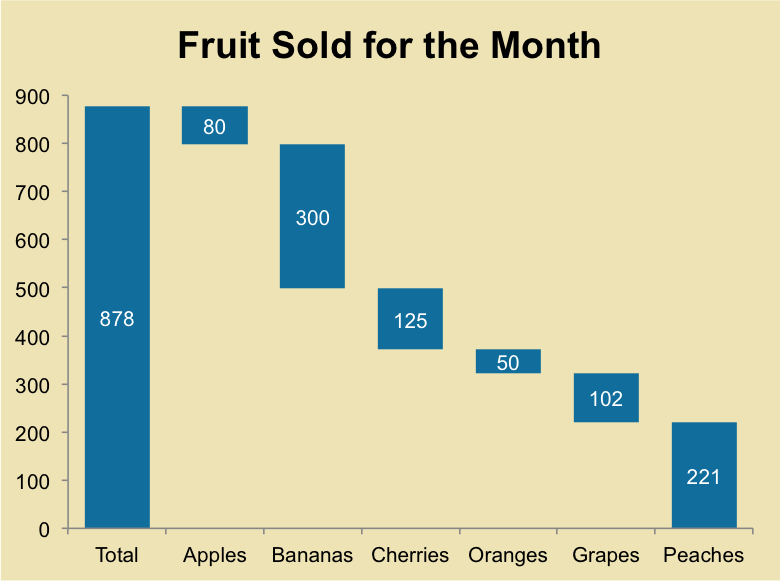
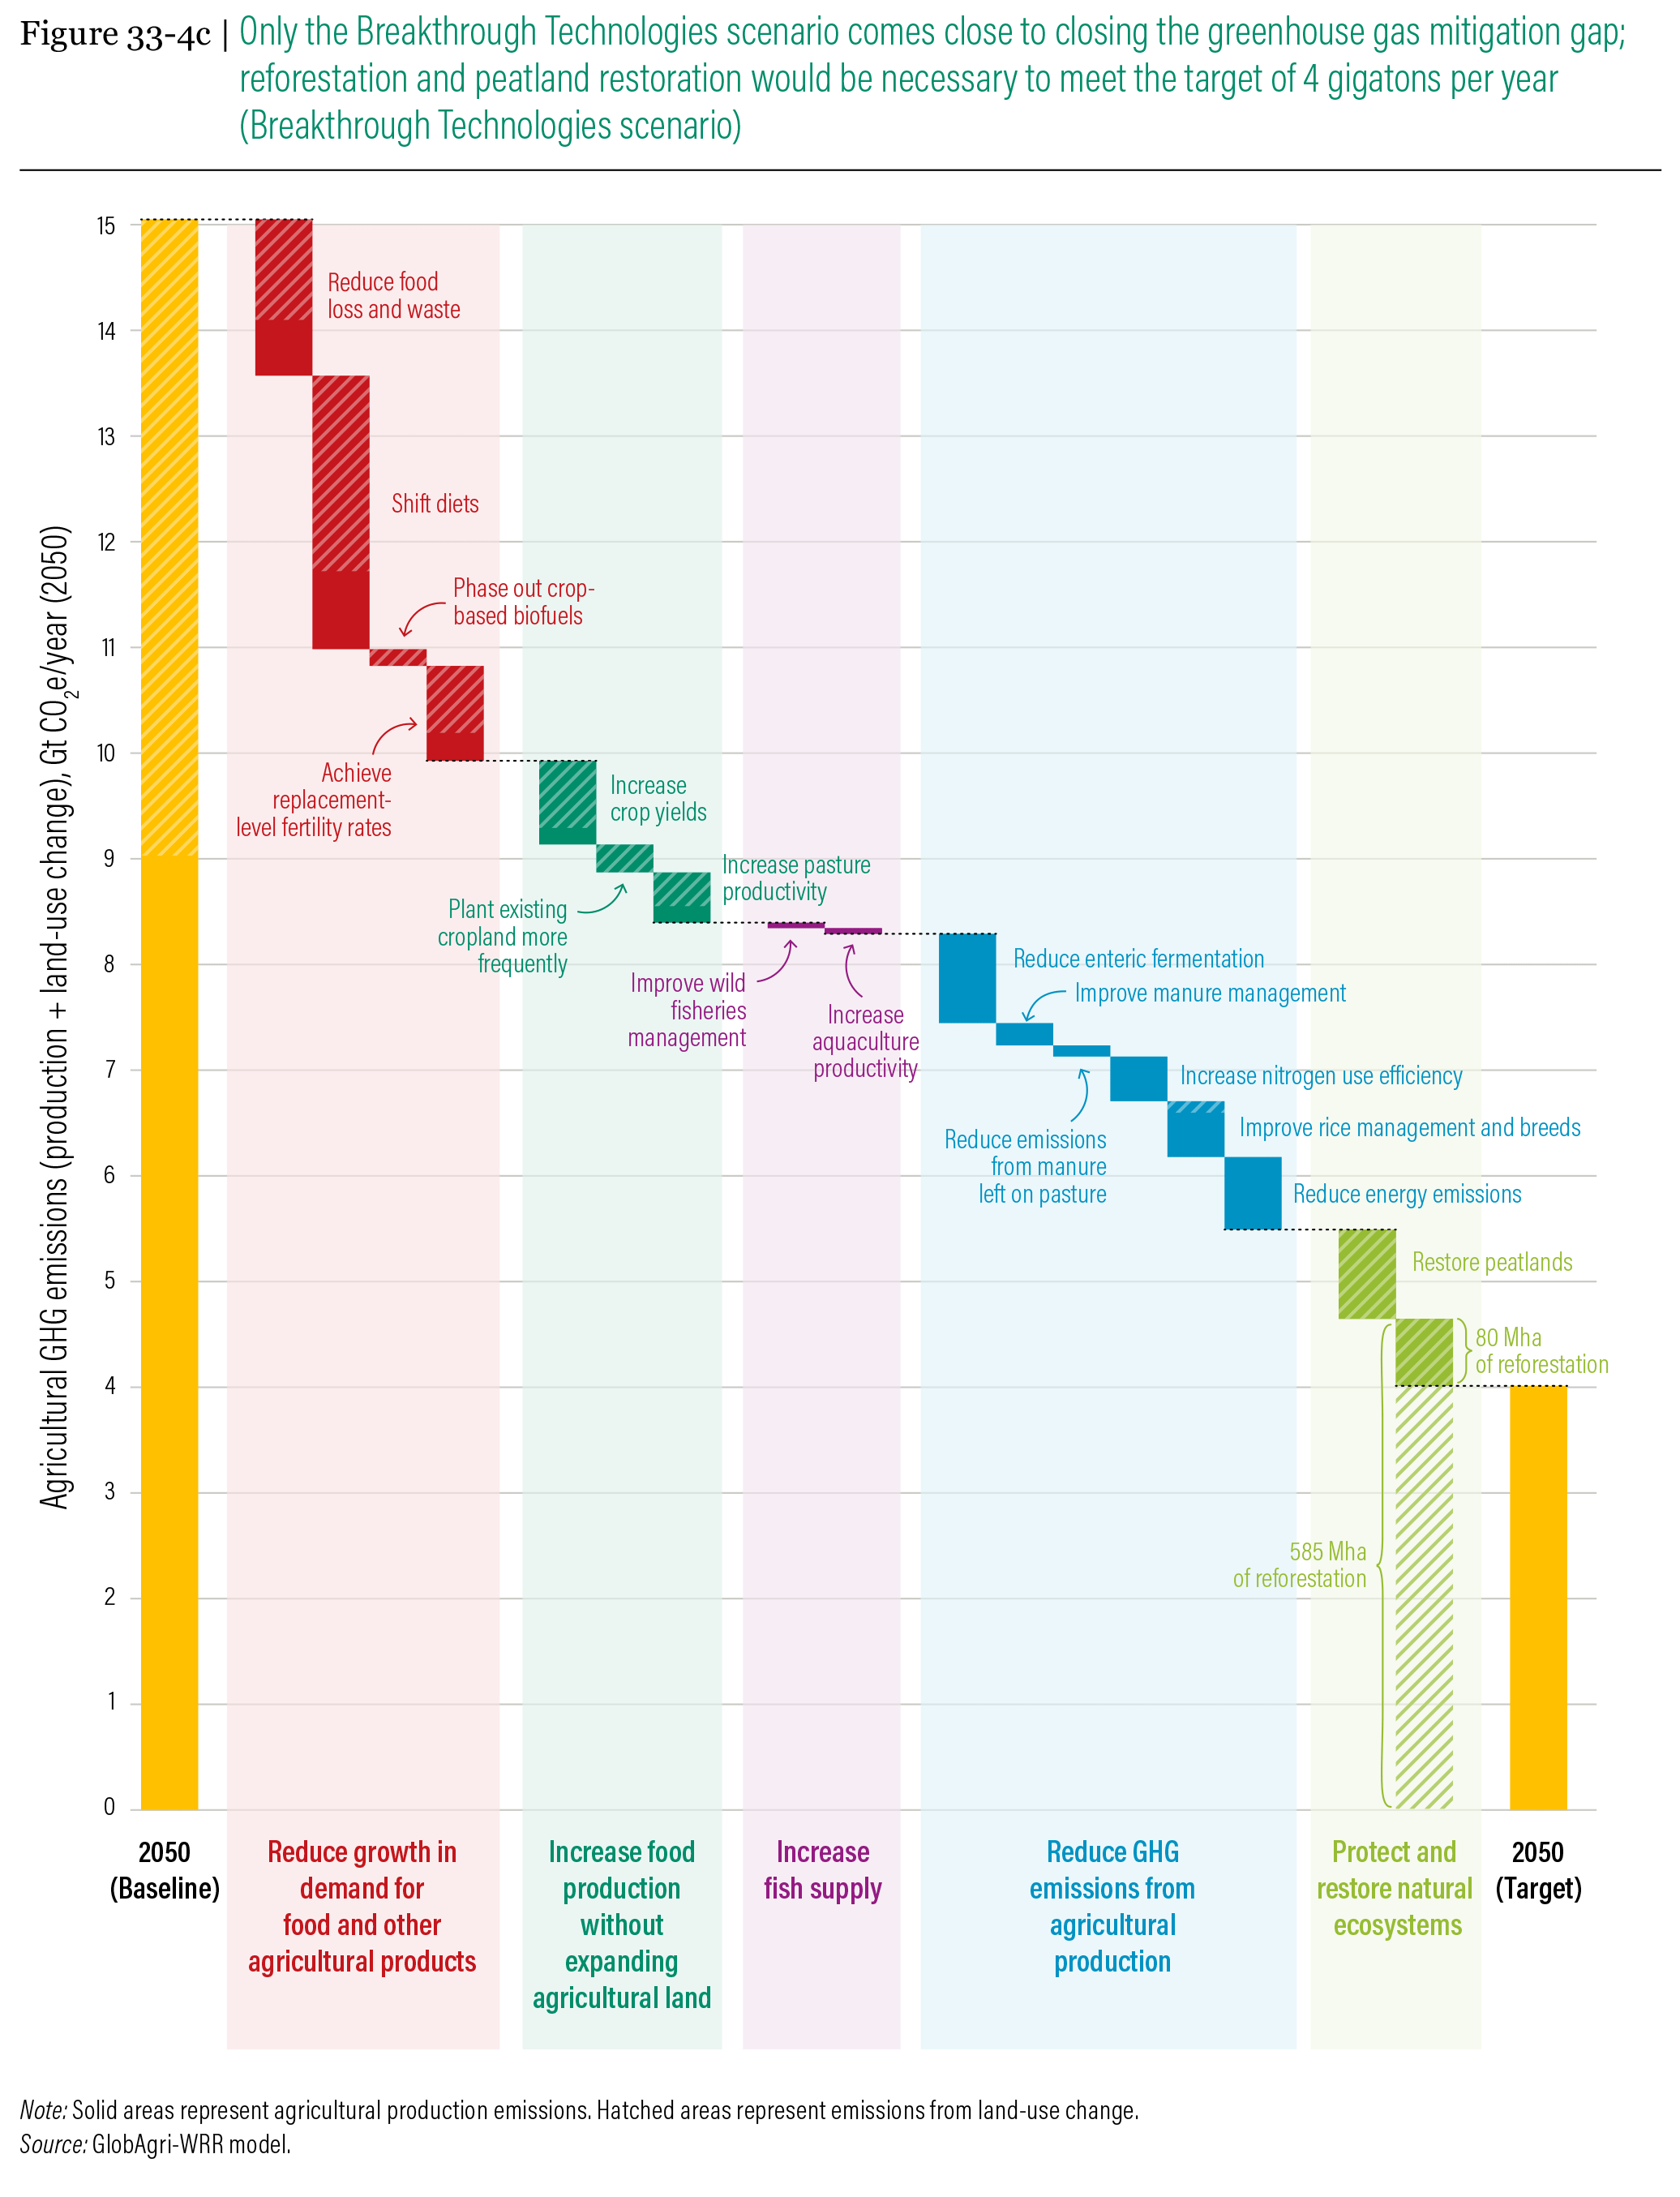
A waterfall chart helps in understanding the cumulative effect of sequentially introduced positive or negative values. The waterfall chart is also known as a flying bricks chart or Mario chart due to the apparent suspension of columns (bricks) in mid-air. Normally used for understanding how an initial value is affected by a series of intermediate positive or negative values.
Not to be confused with the likely named Waterfall Plot.