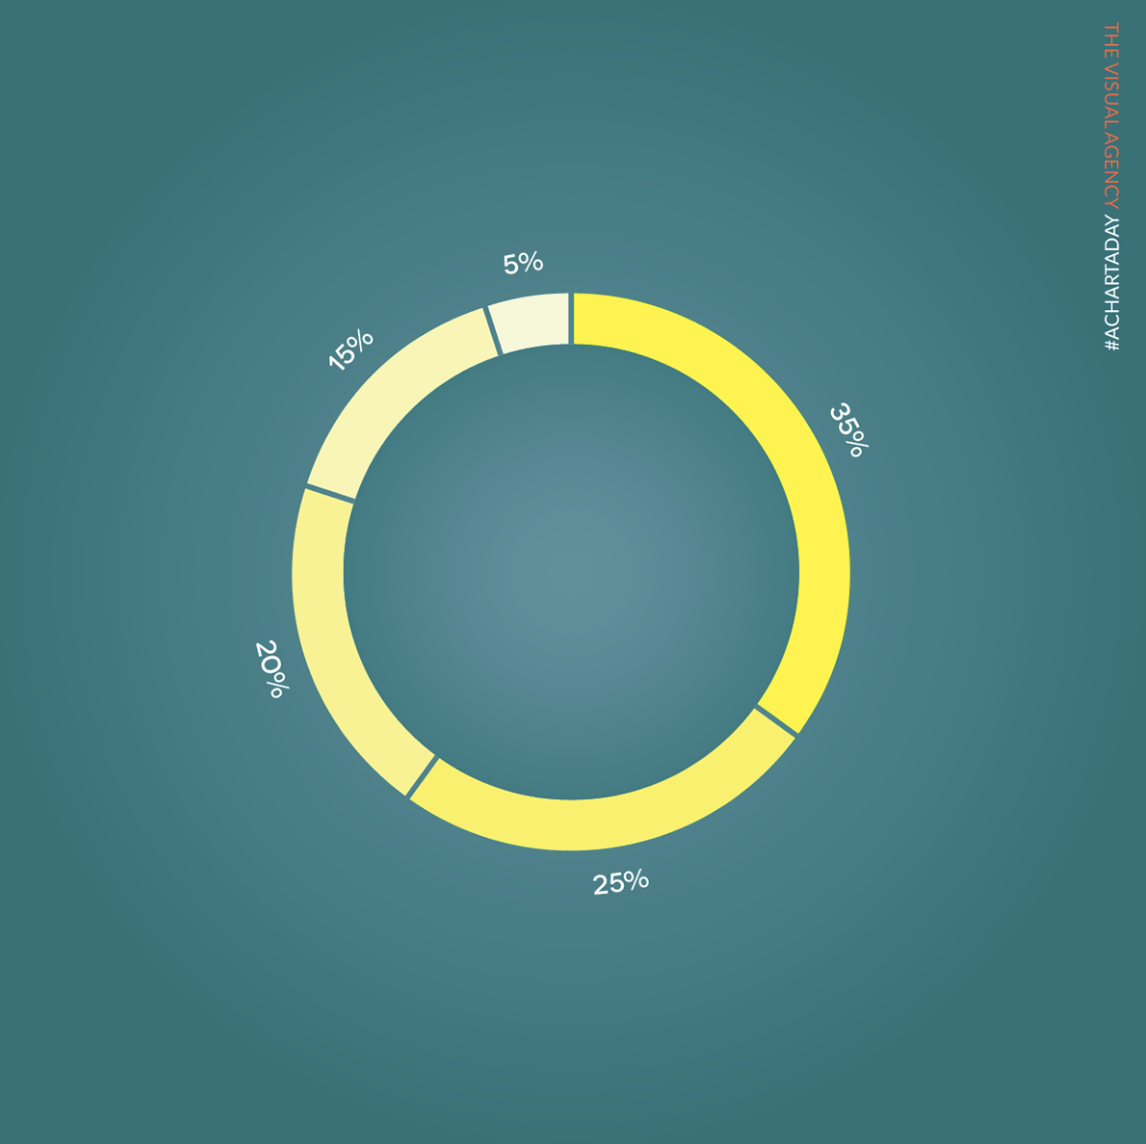
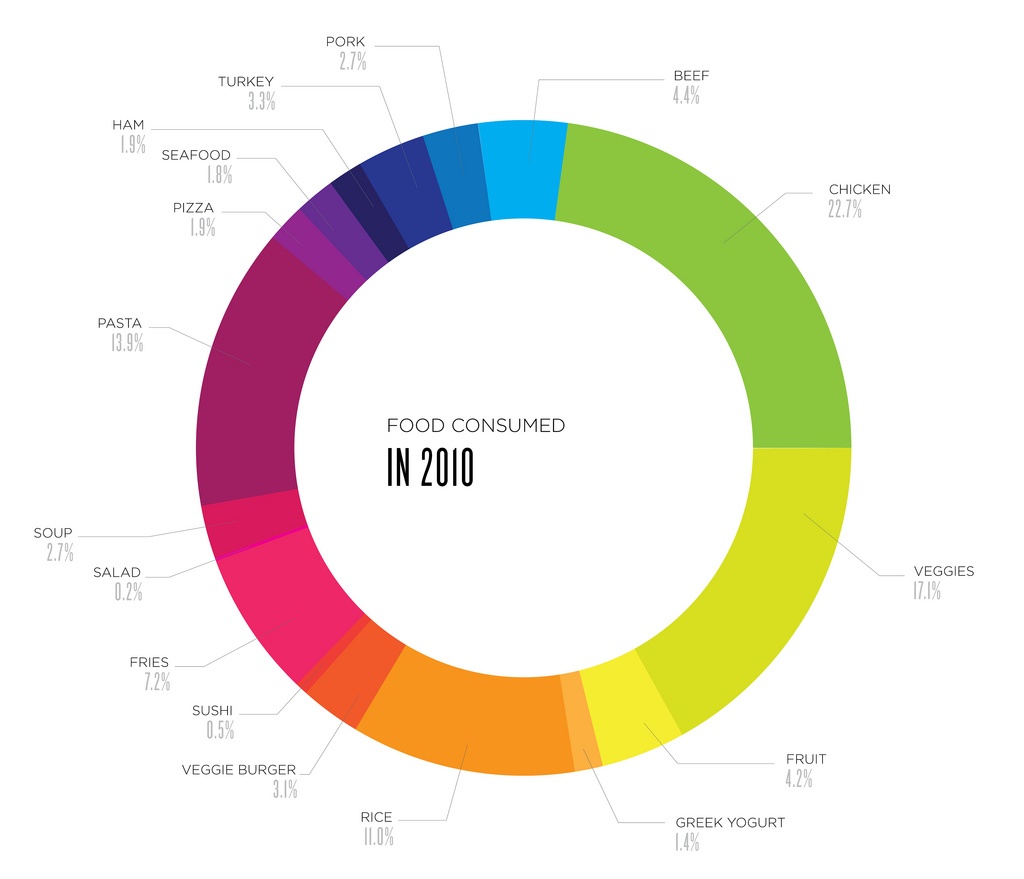
Donut Chart
Also called: doughnut chart
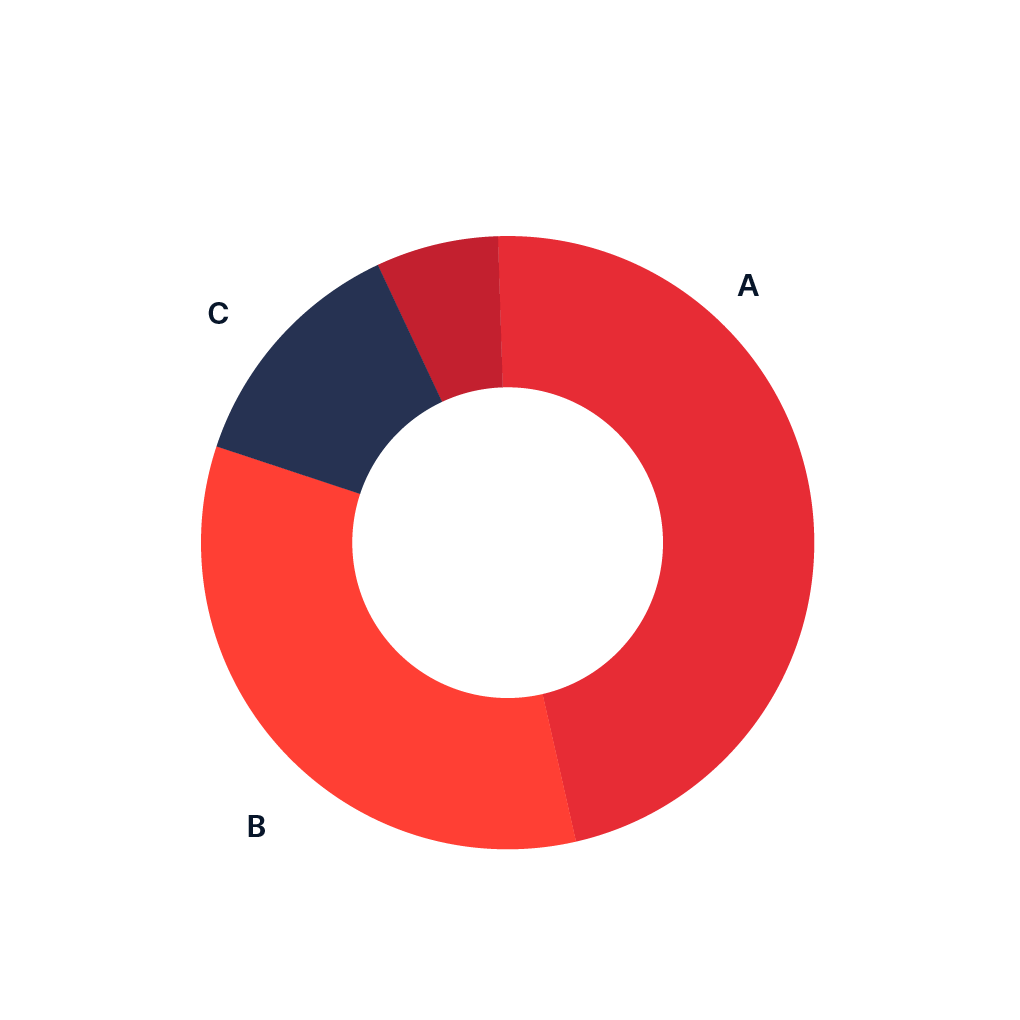
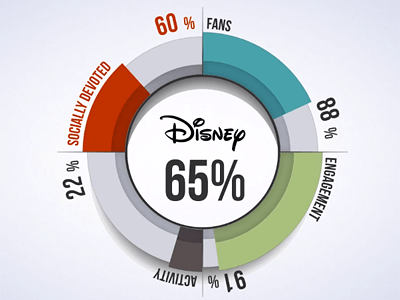
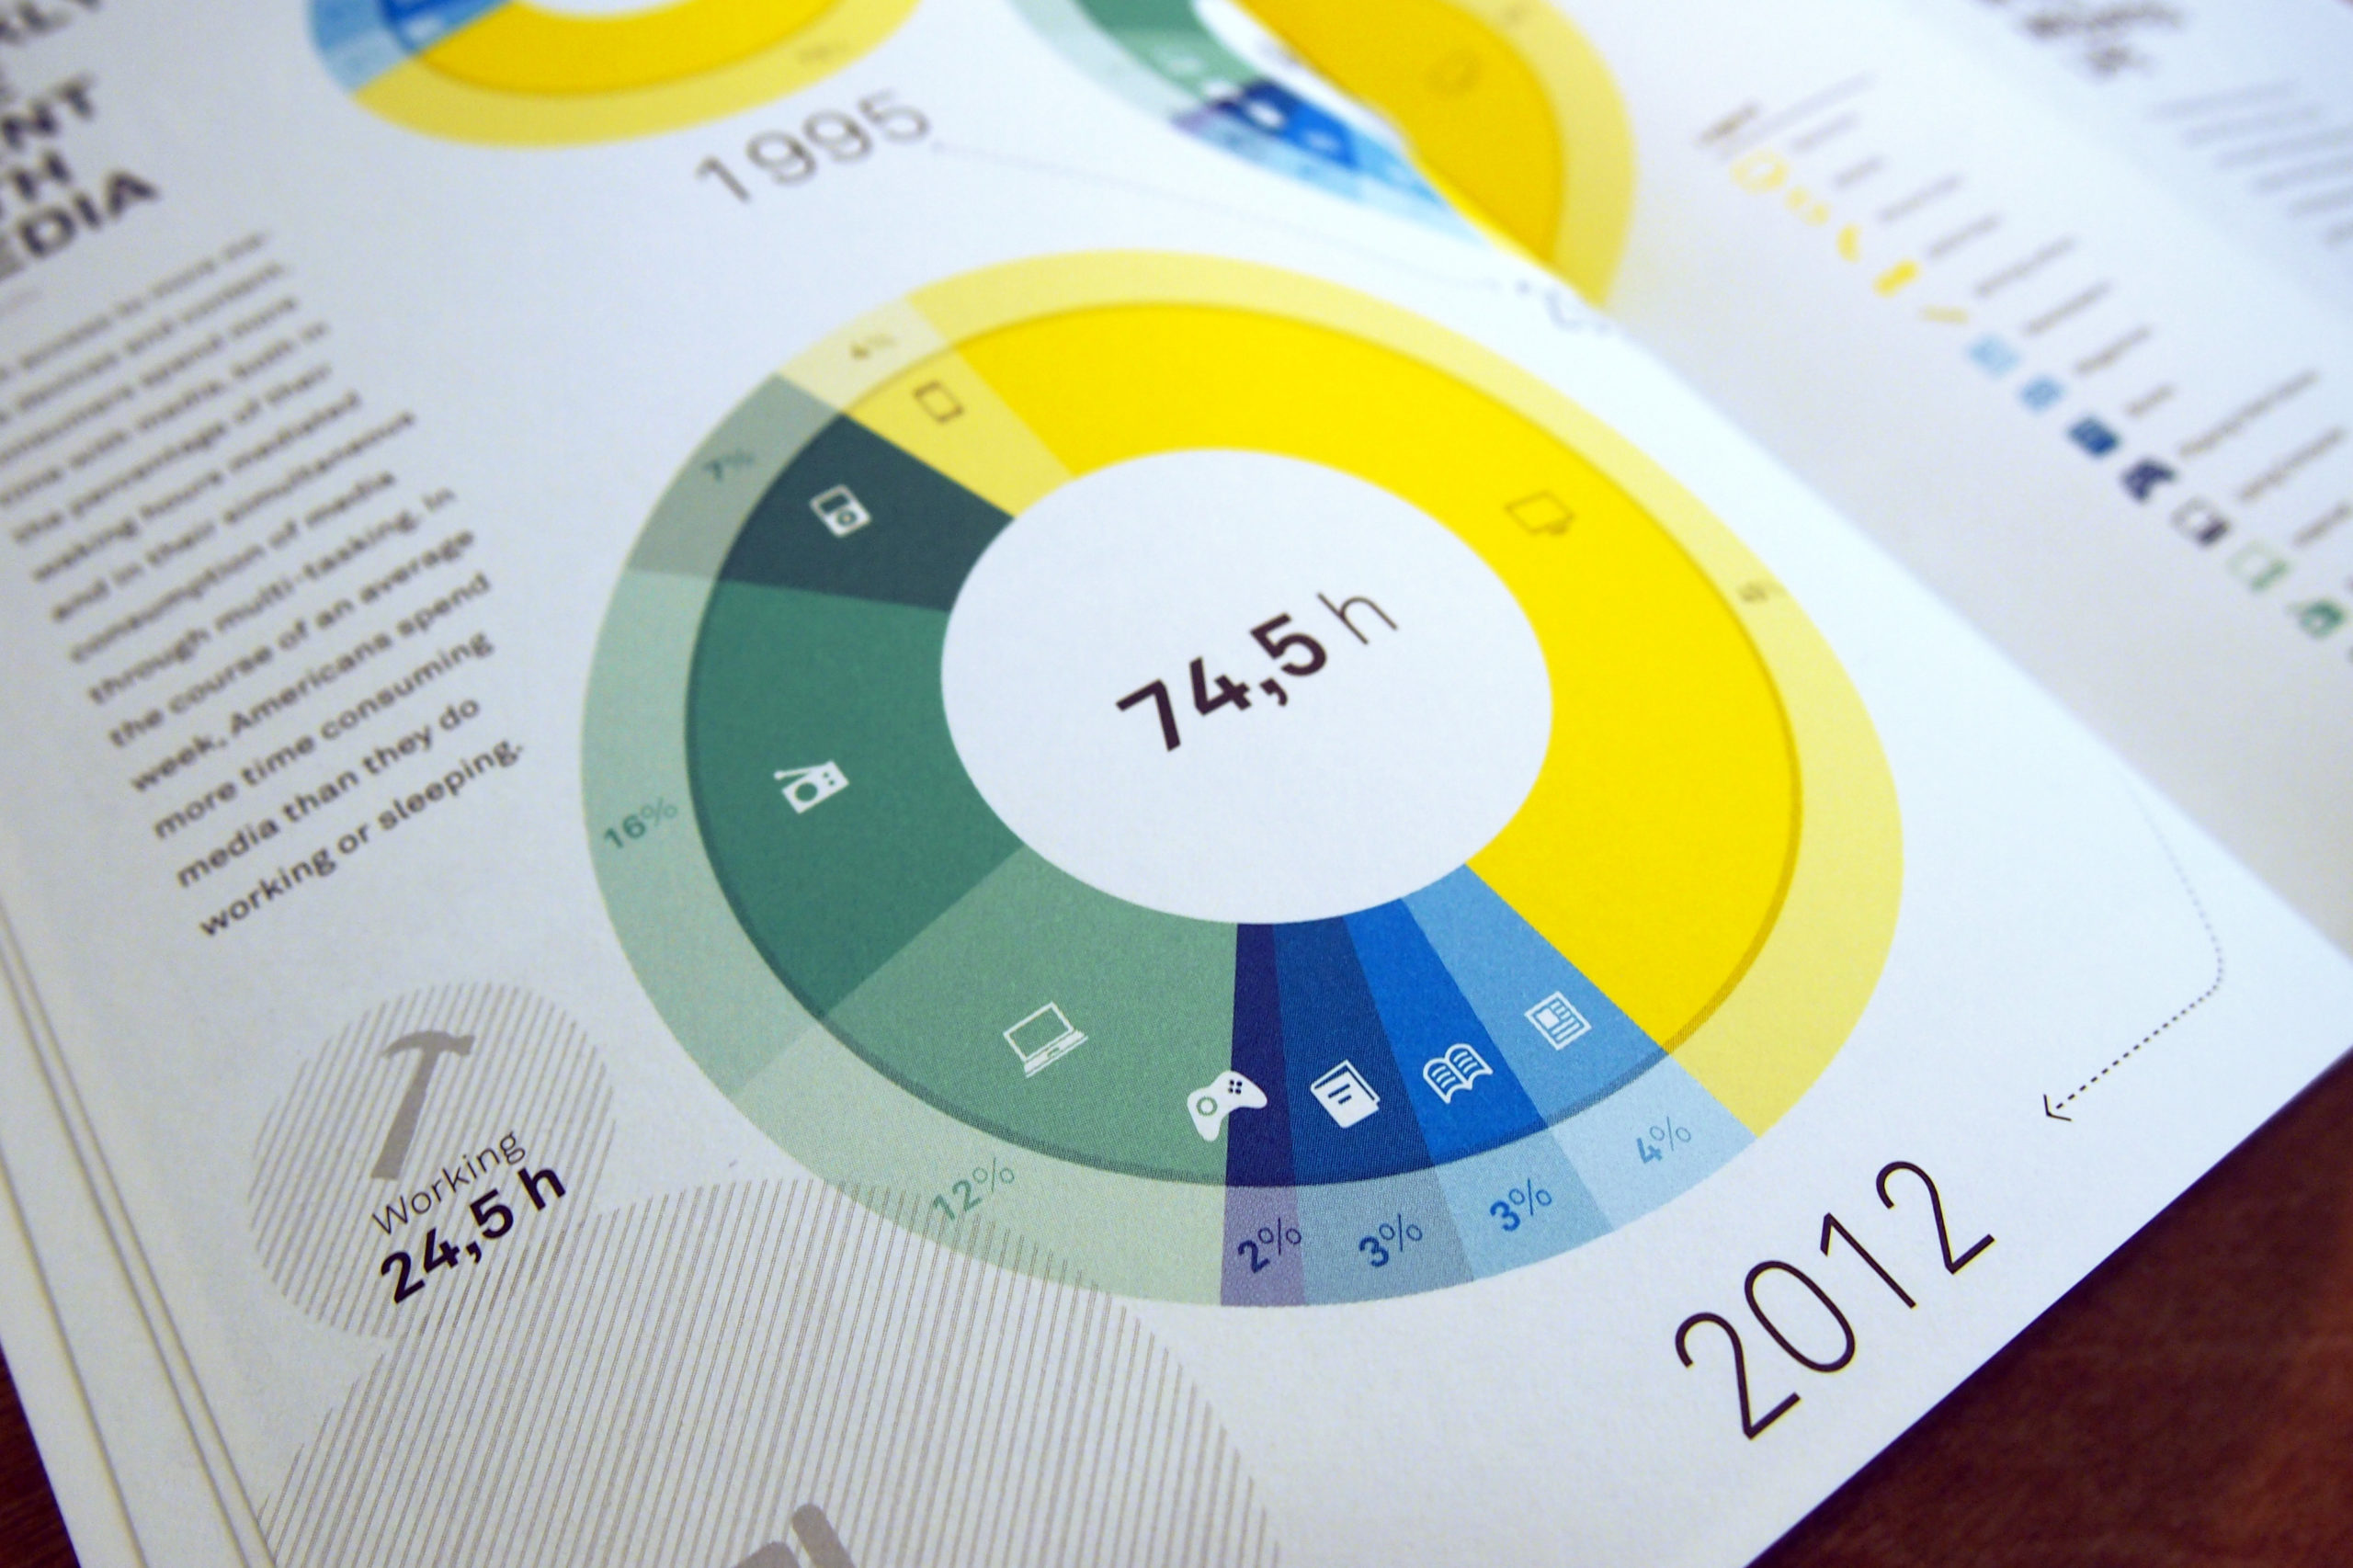
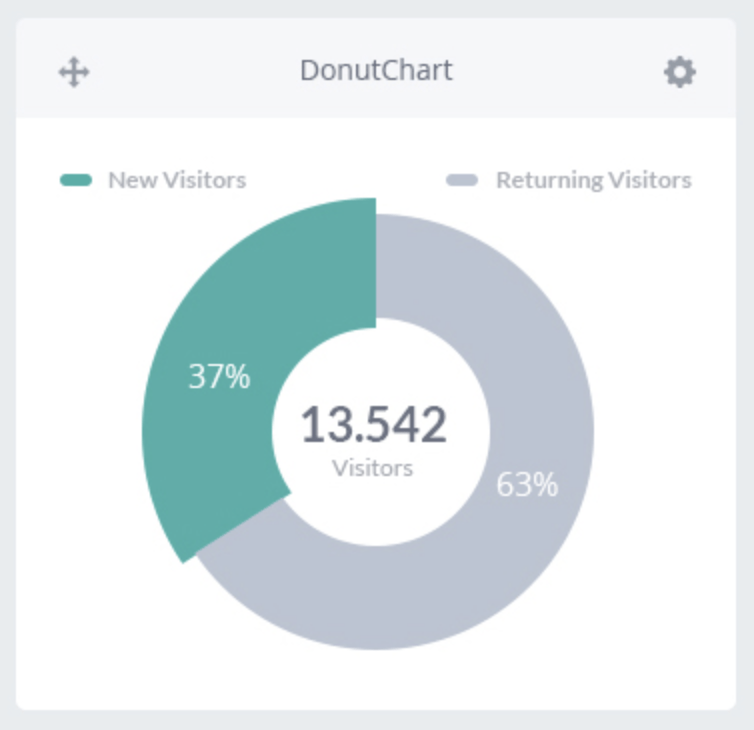
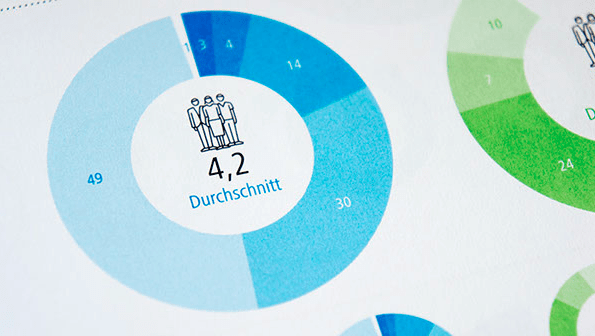
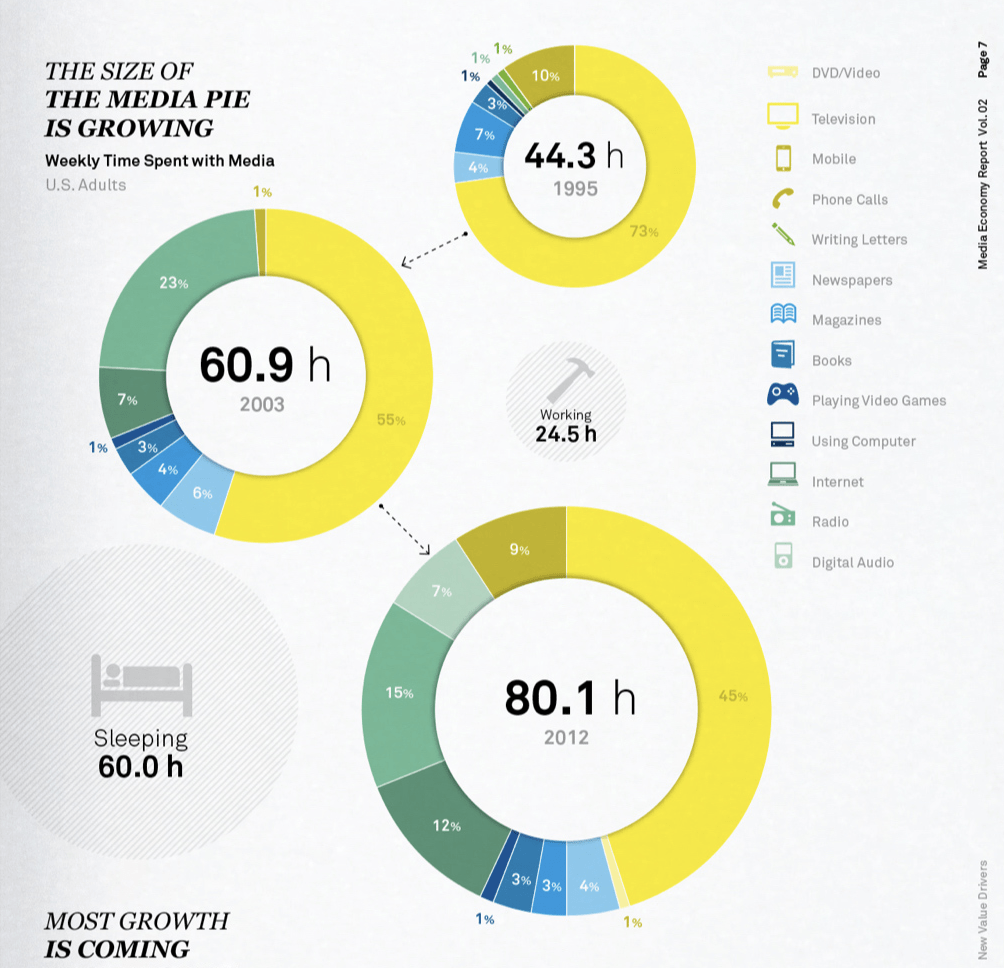
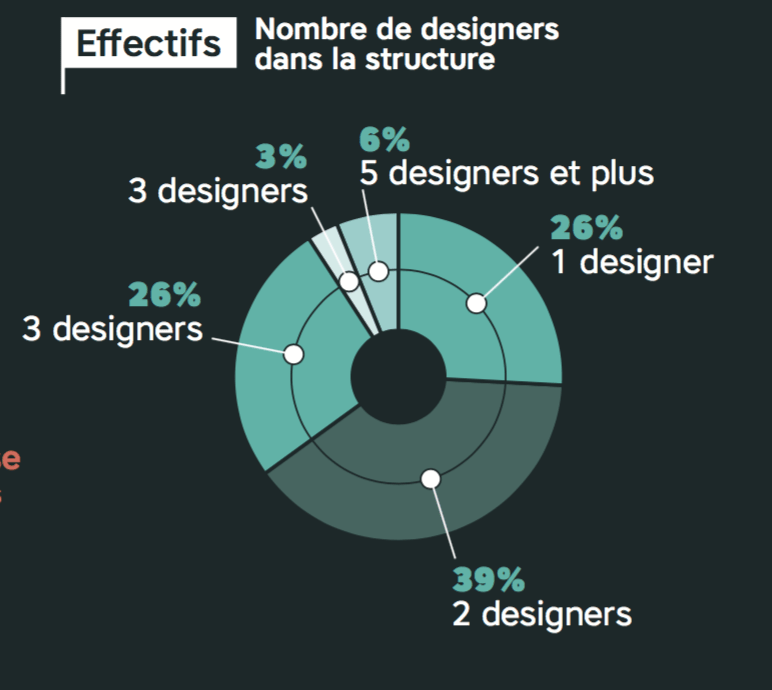
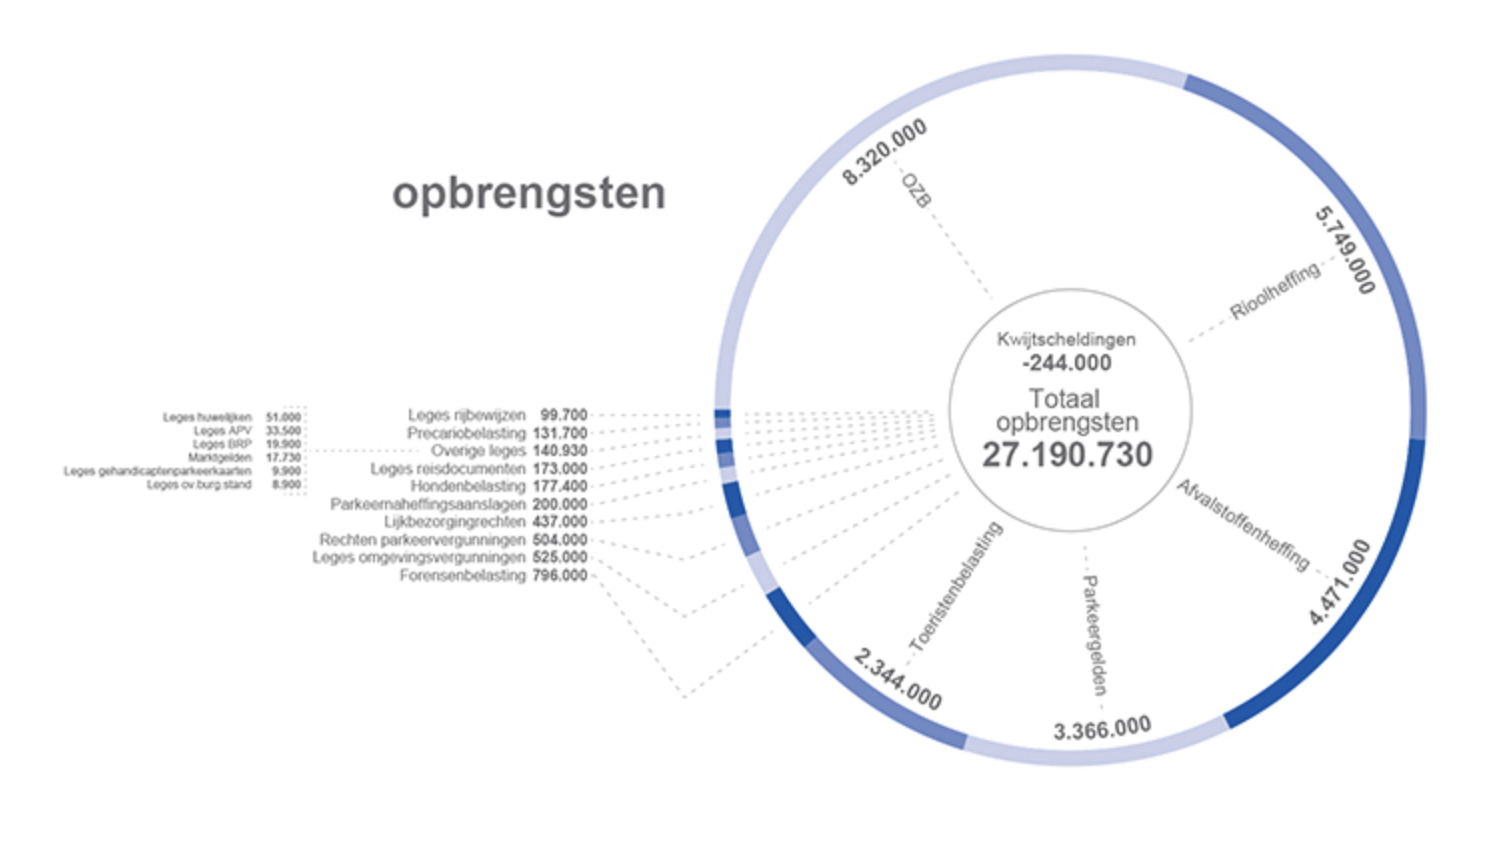
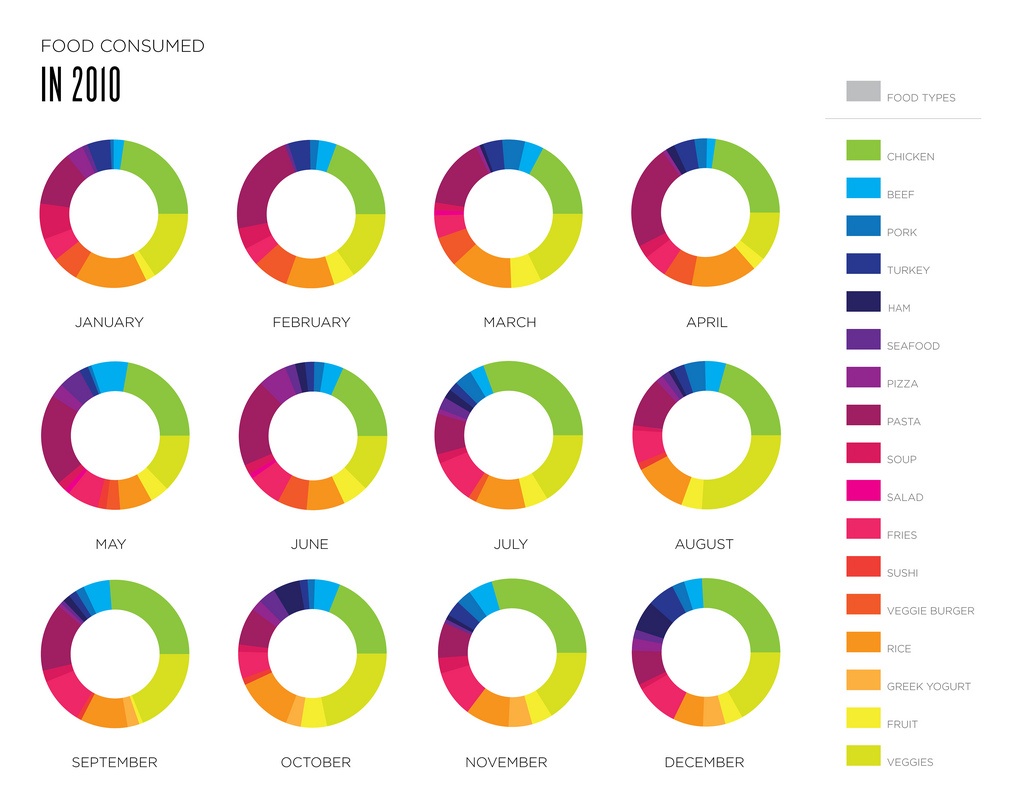
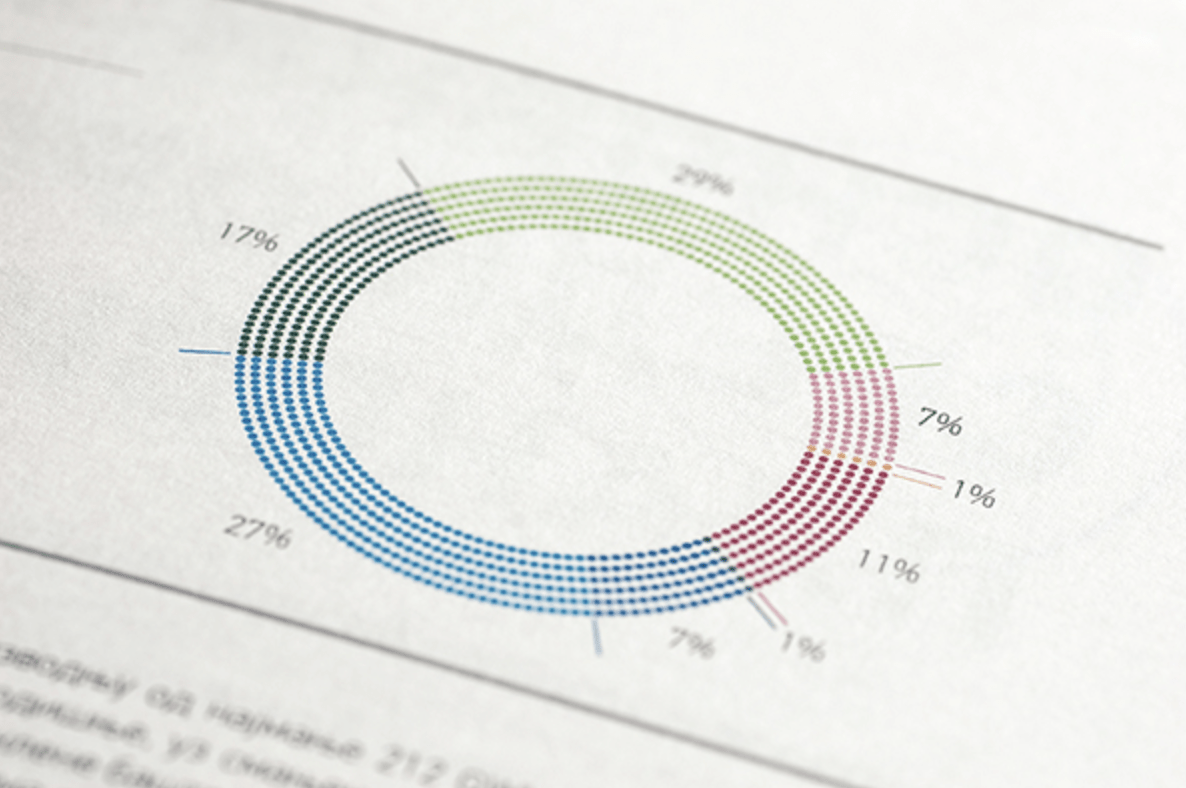
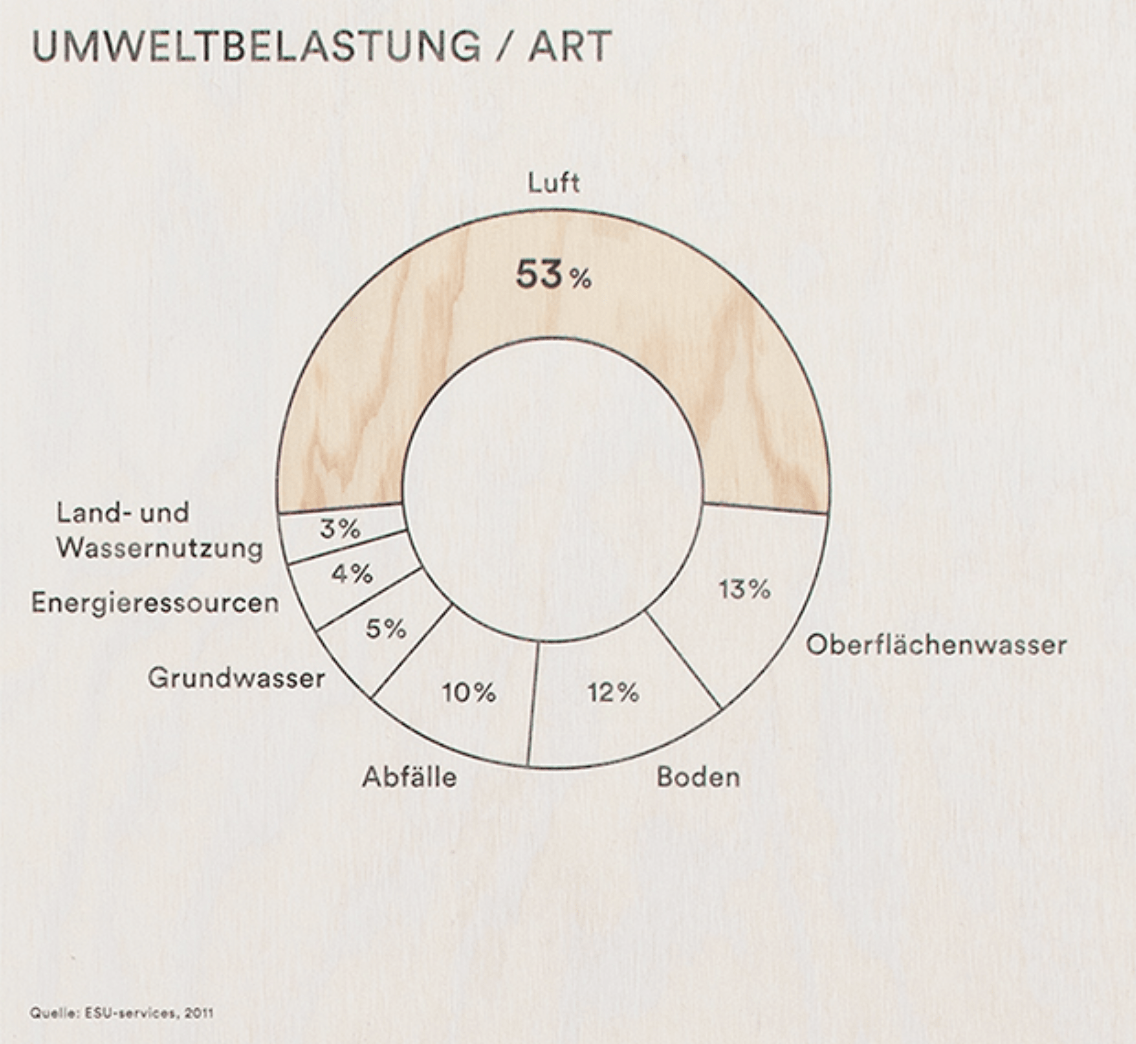
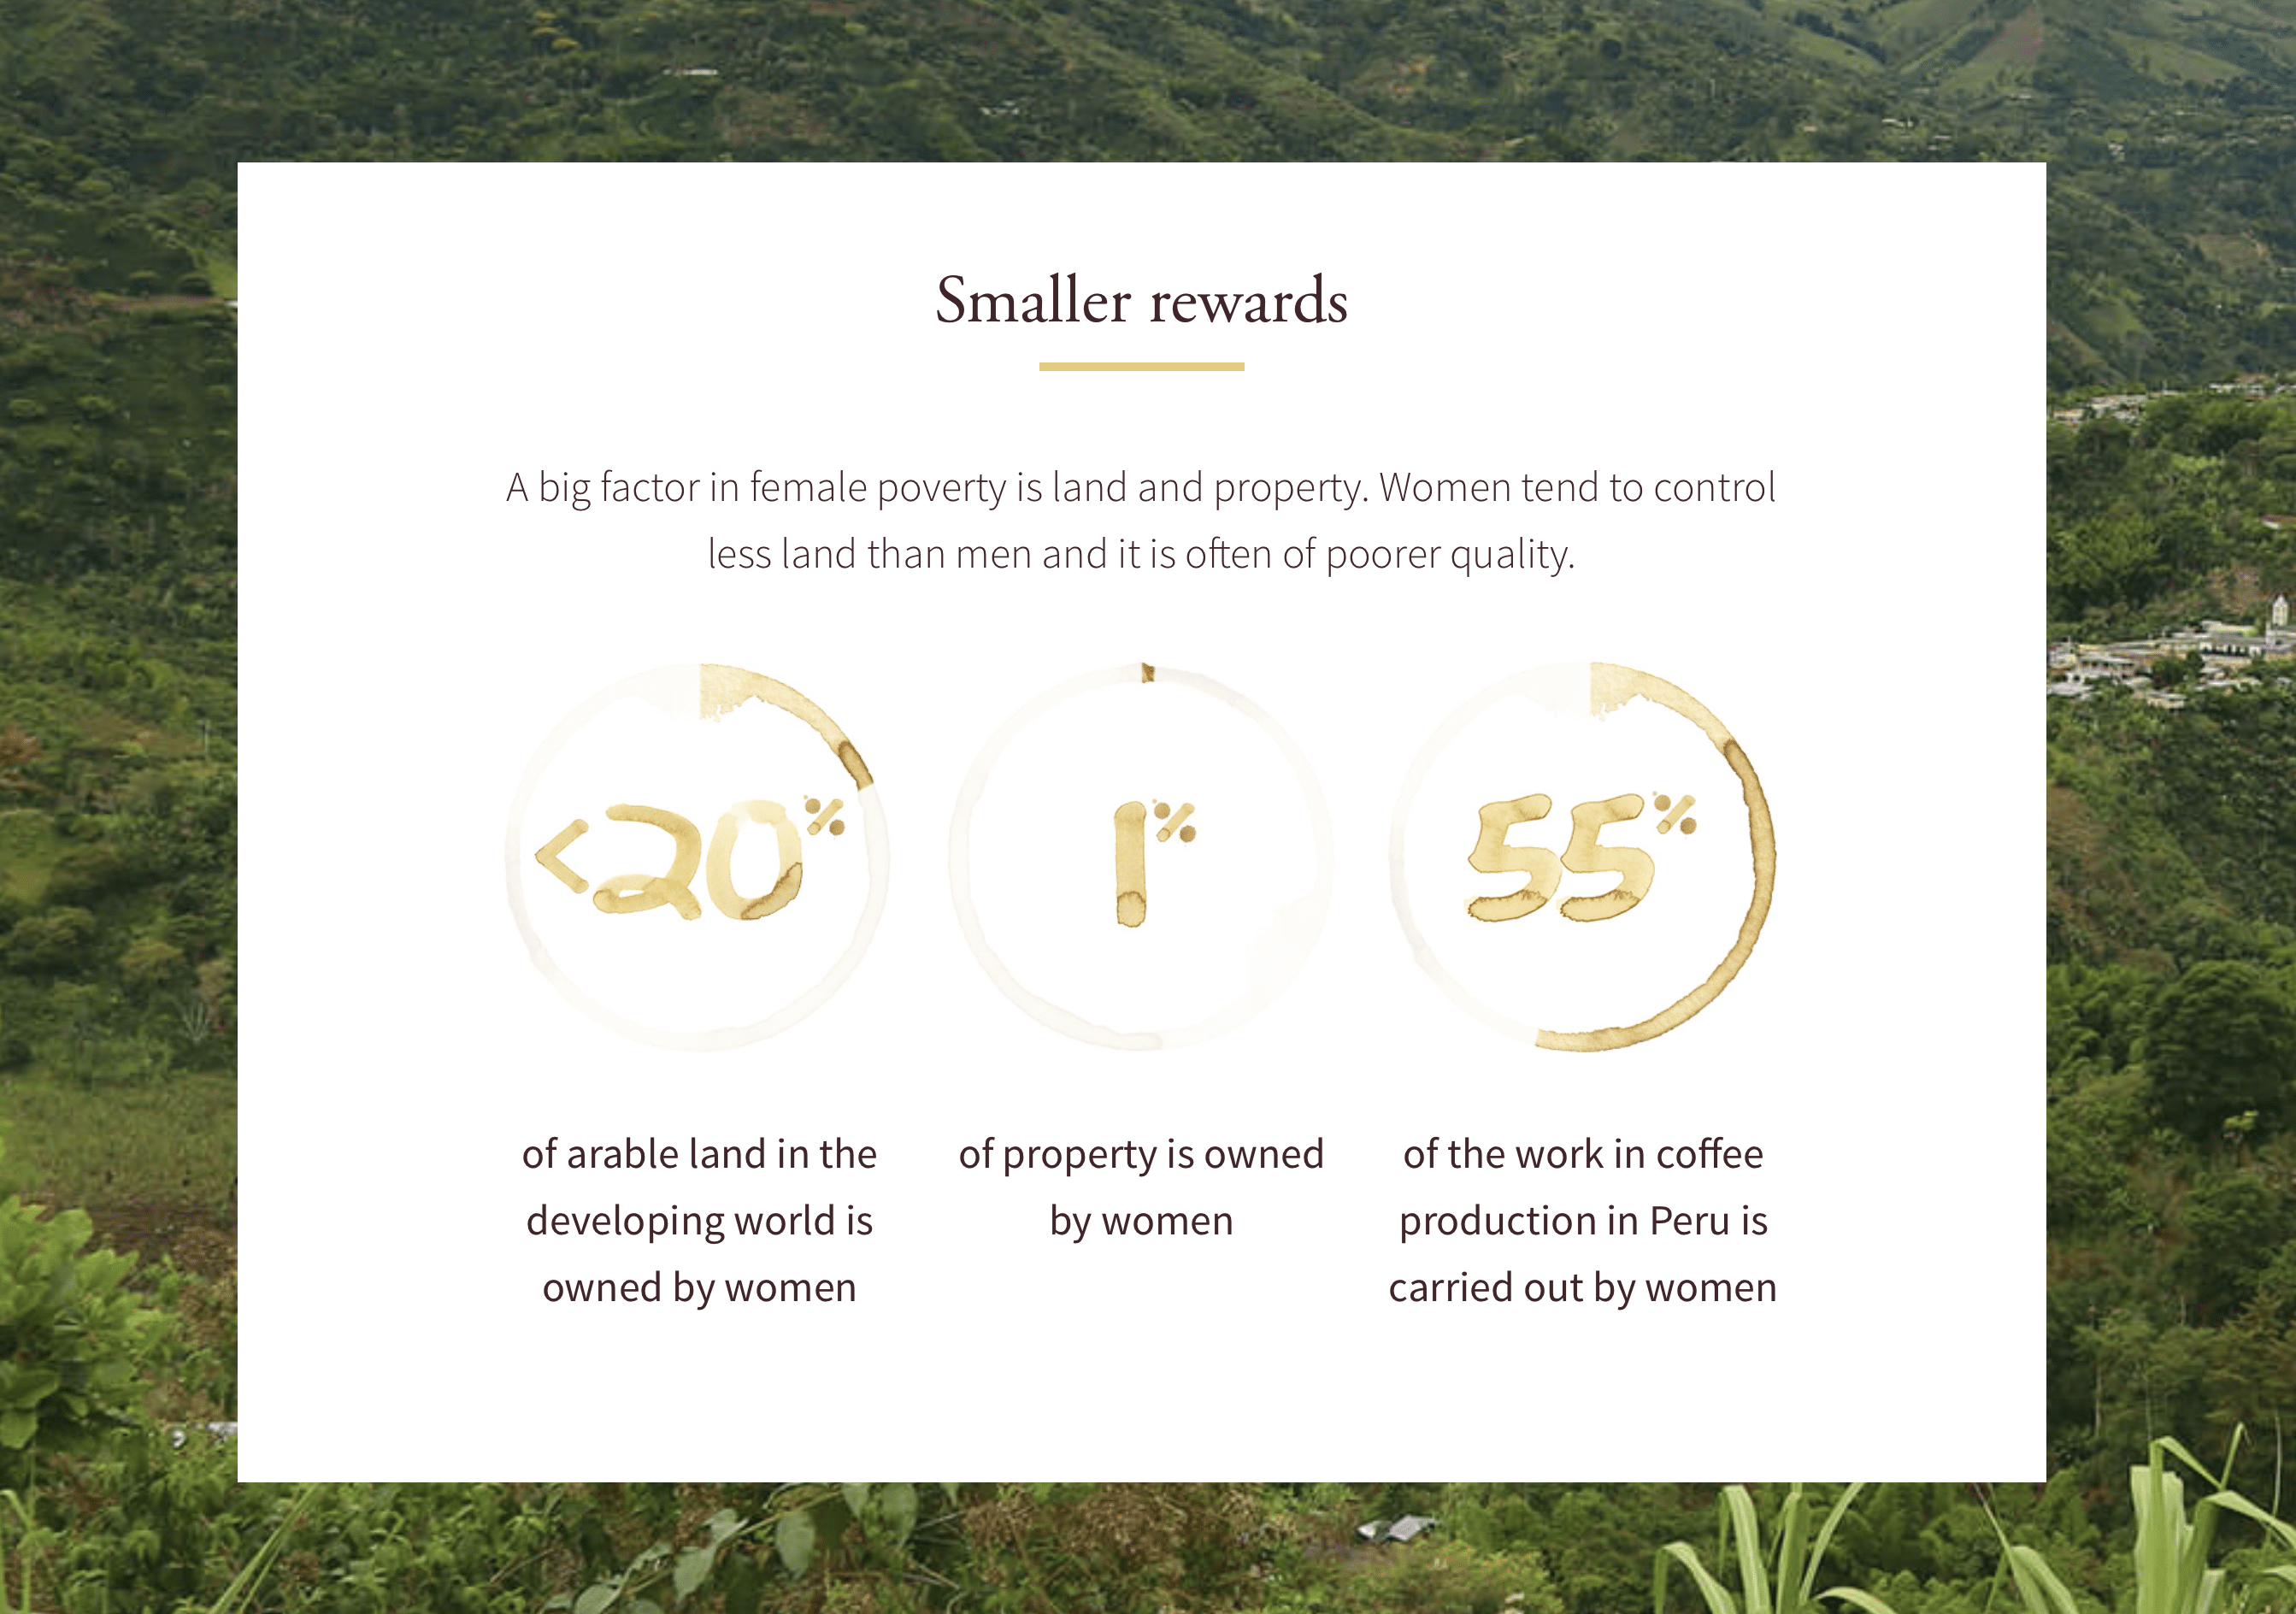
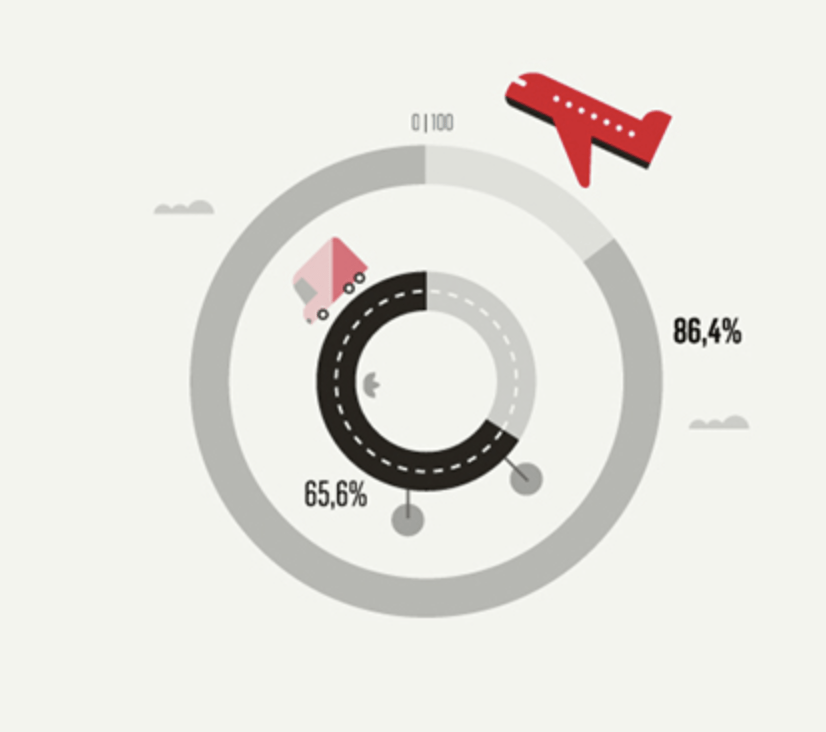
A donut chart (also spelled doughnut) is functionally identical to a pie chart, with the exception of a blank center and the ability to support multiple statistics at once. Doughnut charts provide a better data intensity ratio to standard pie charts since the blank center can be used to display additional, related data.