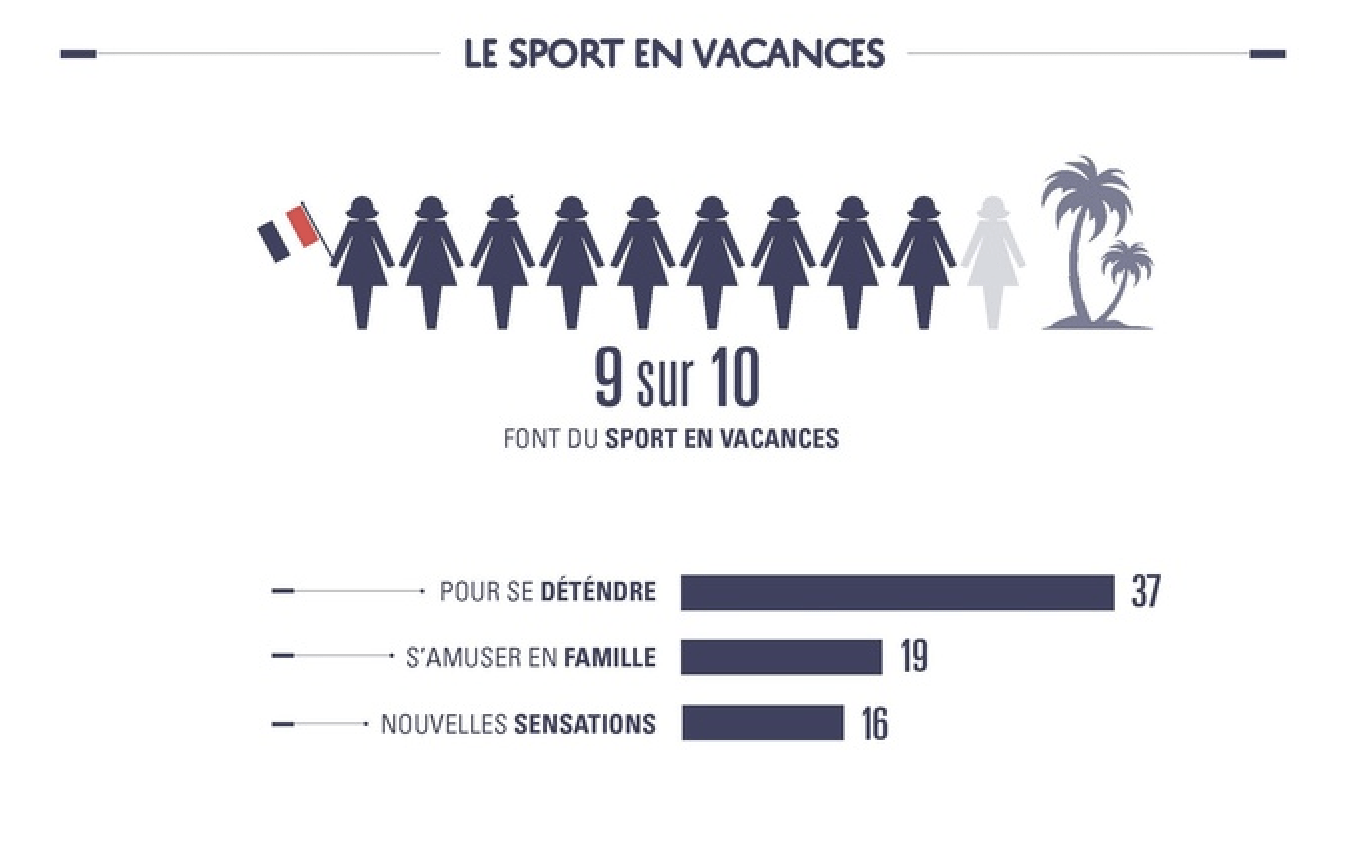
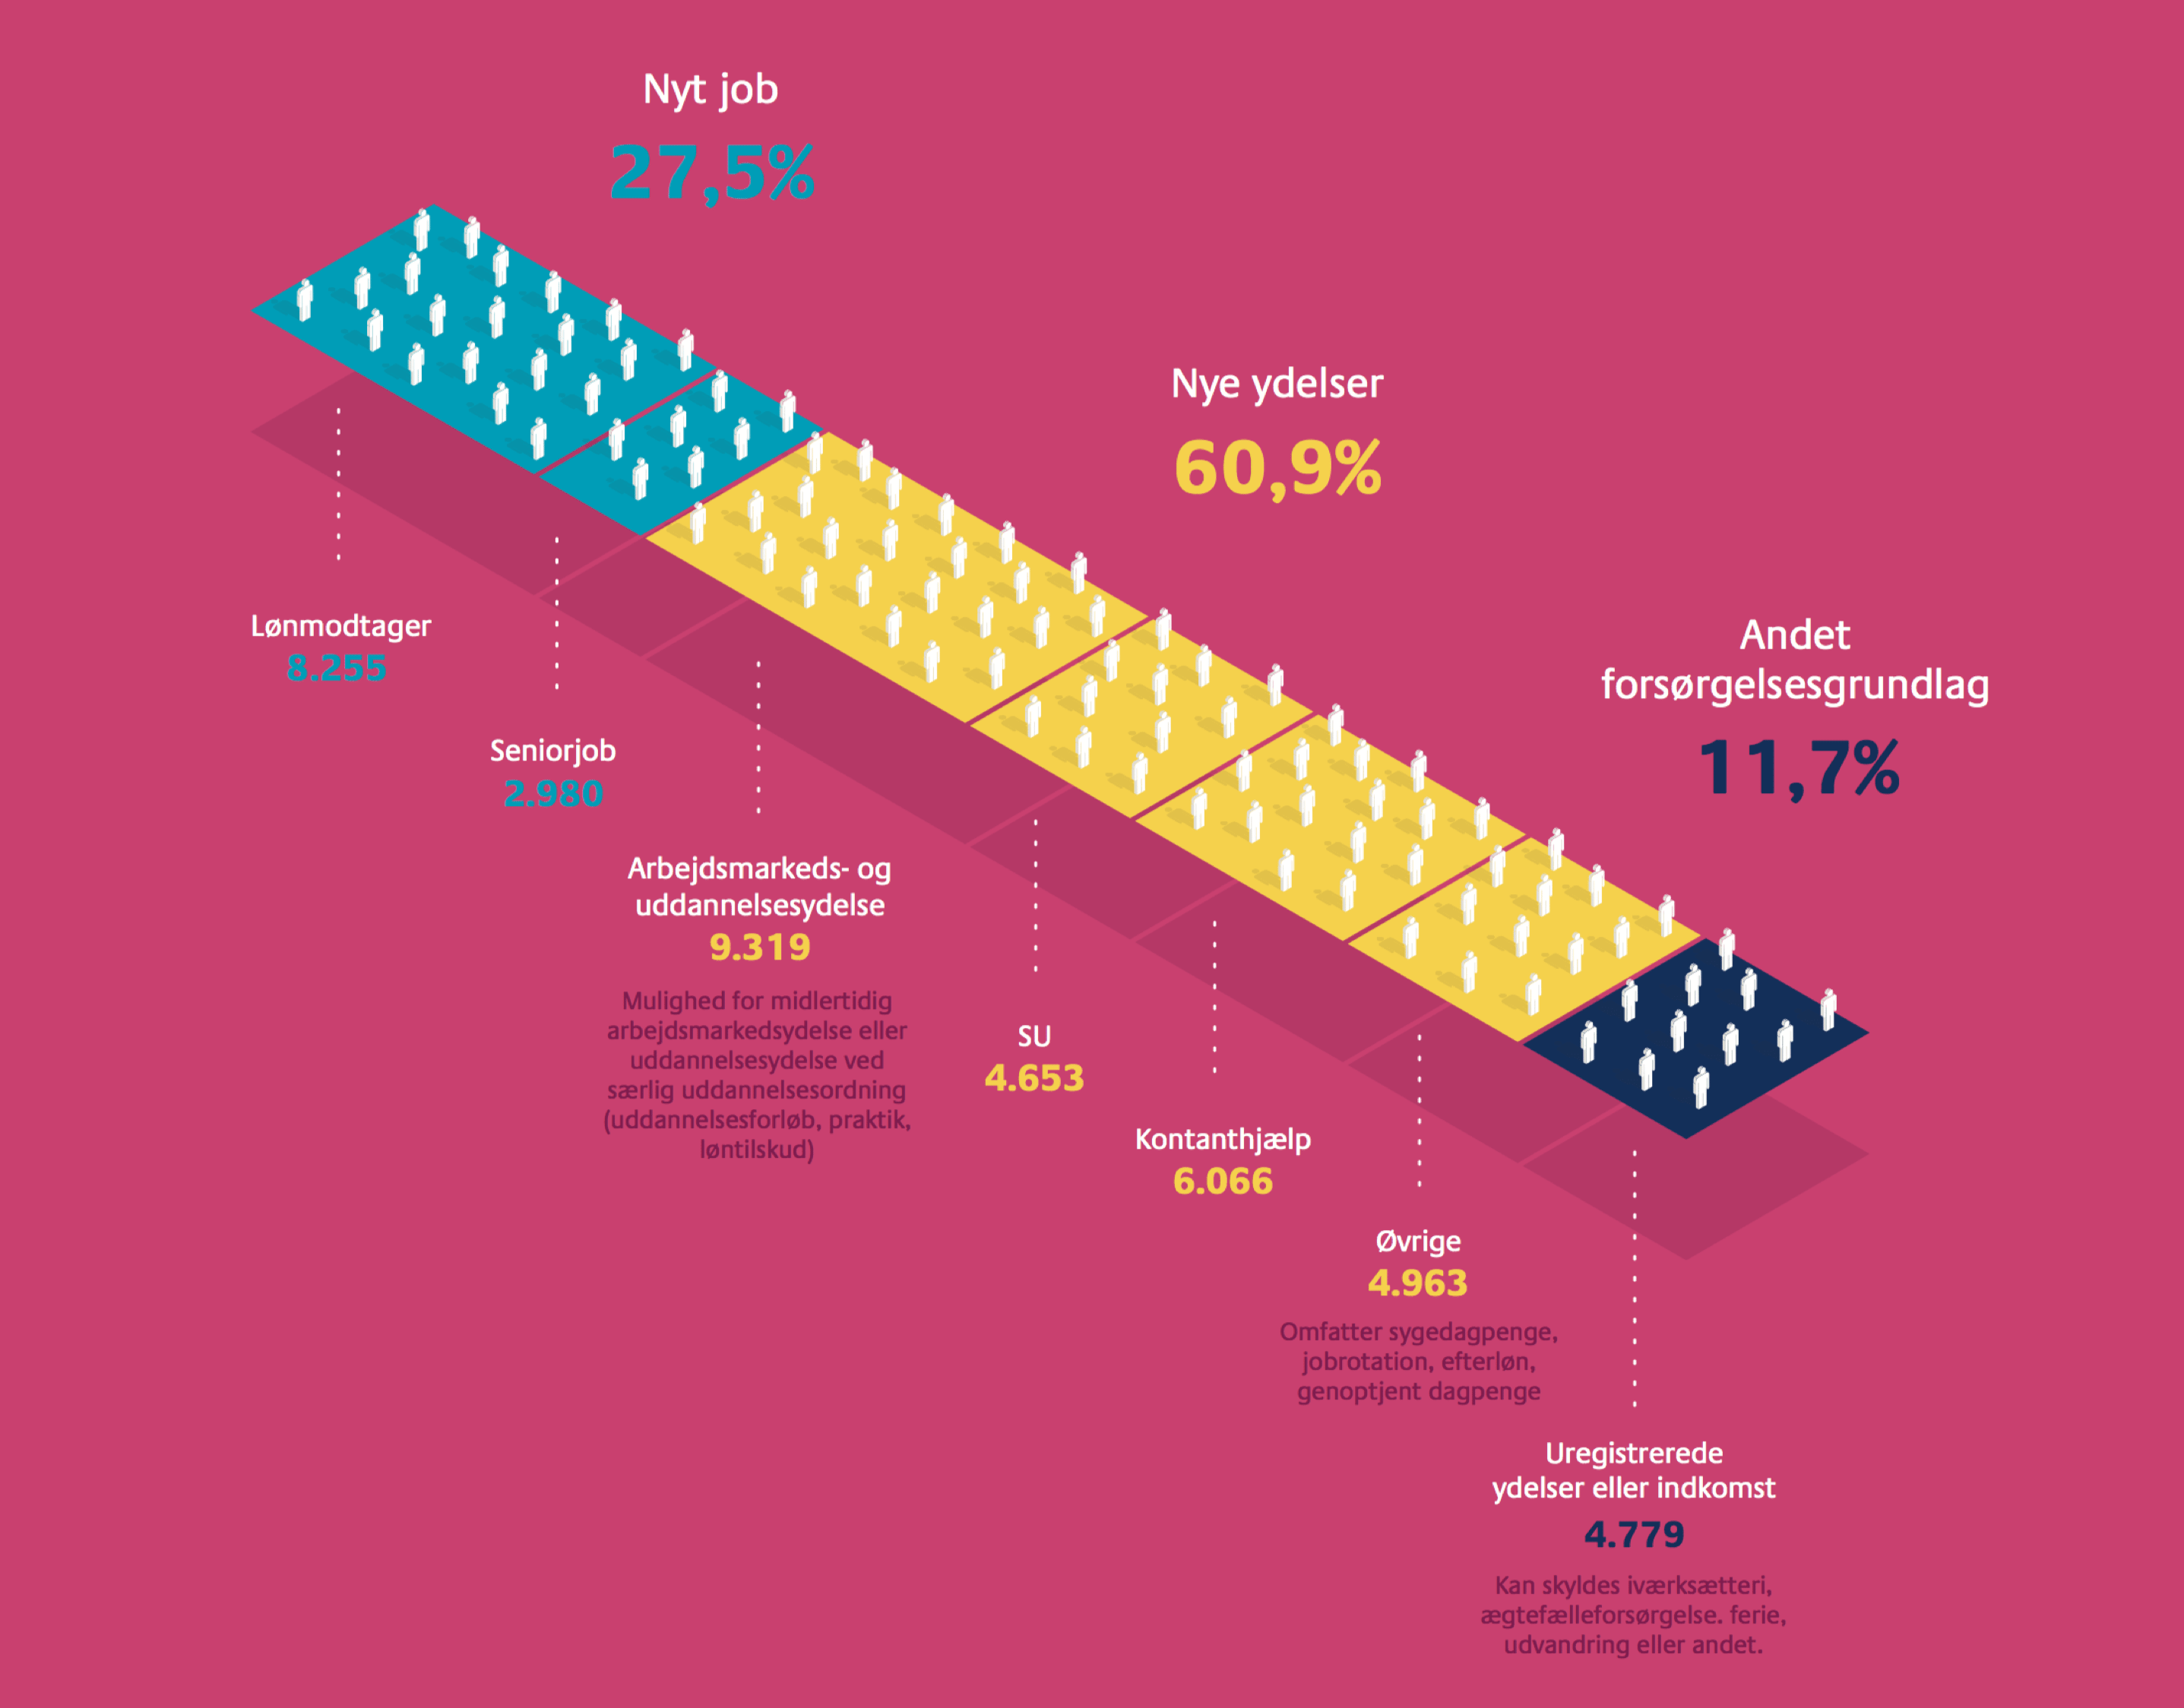
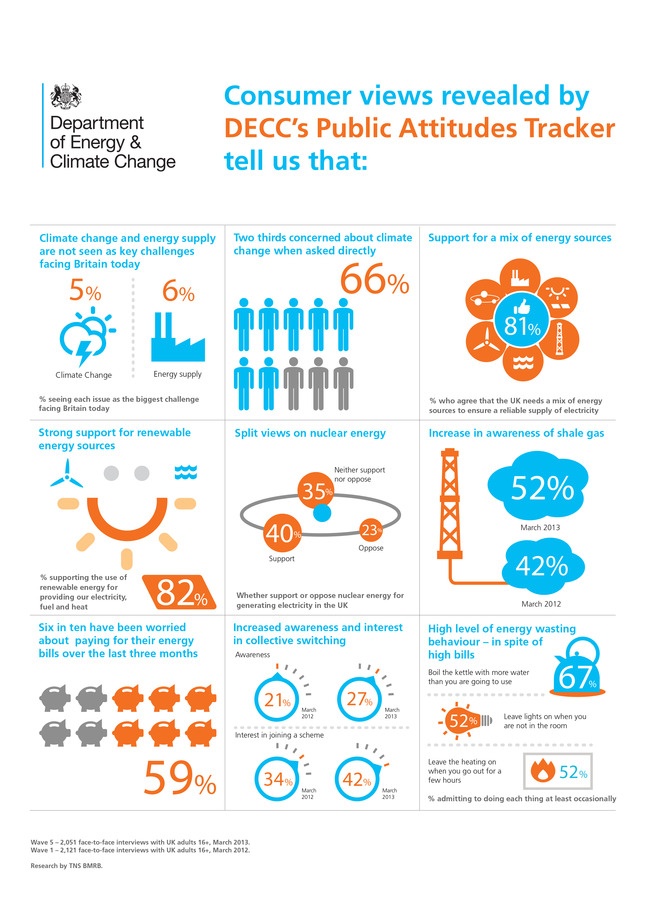
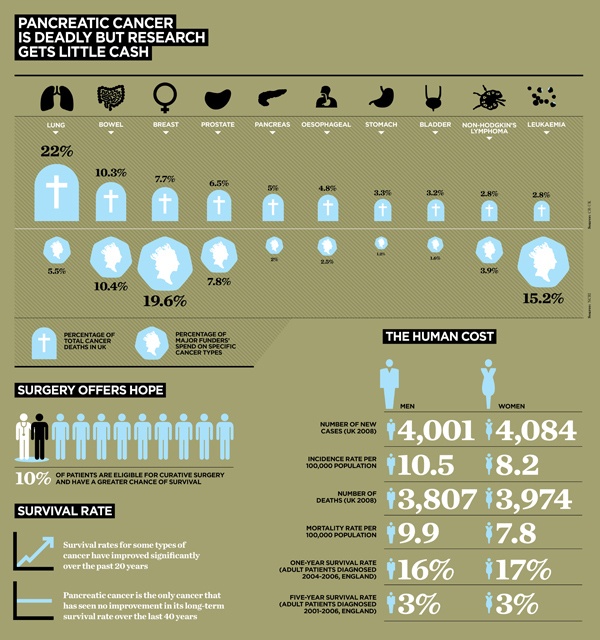
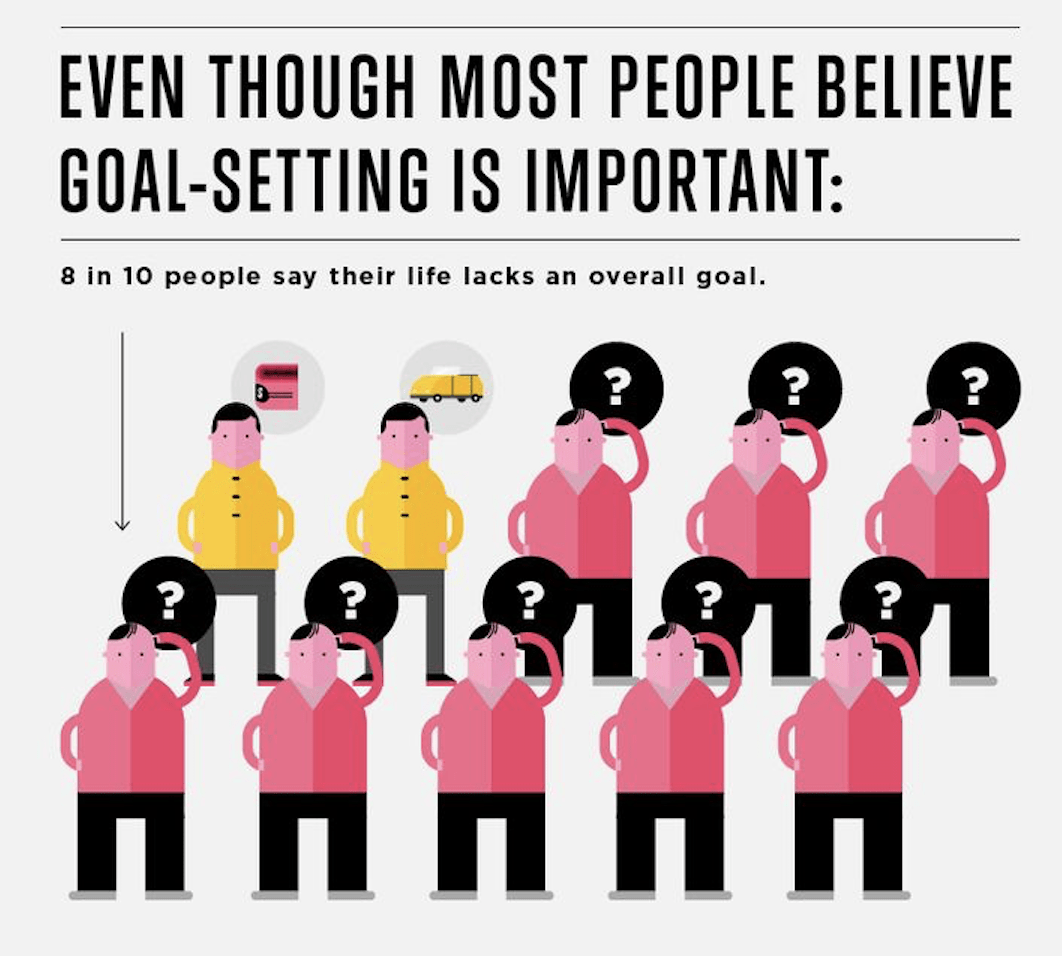
Pictorial Fraction Chart
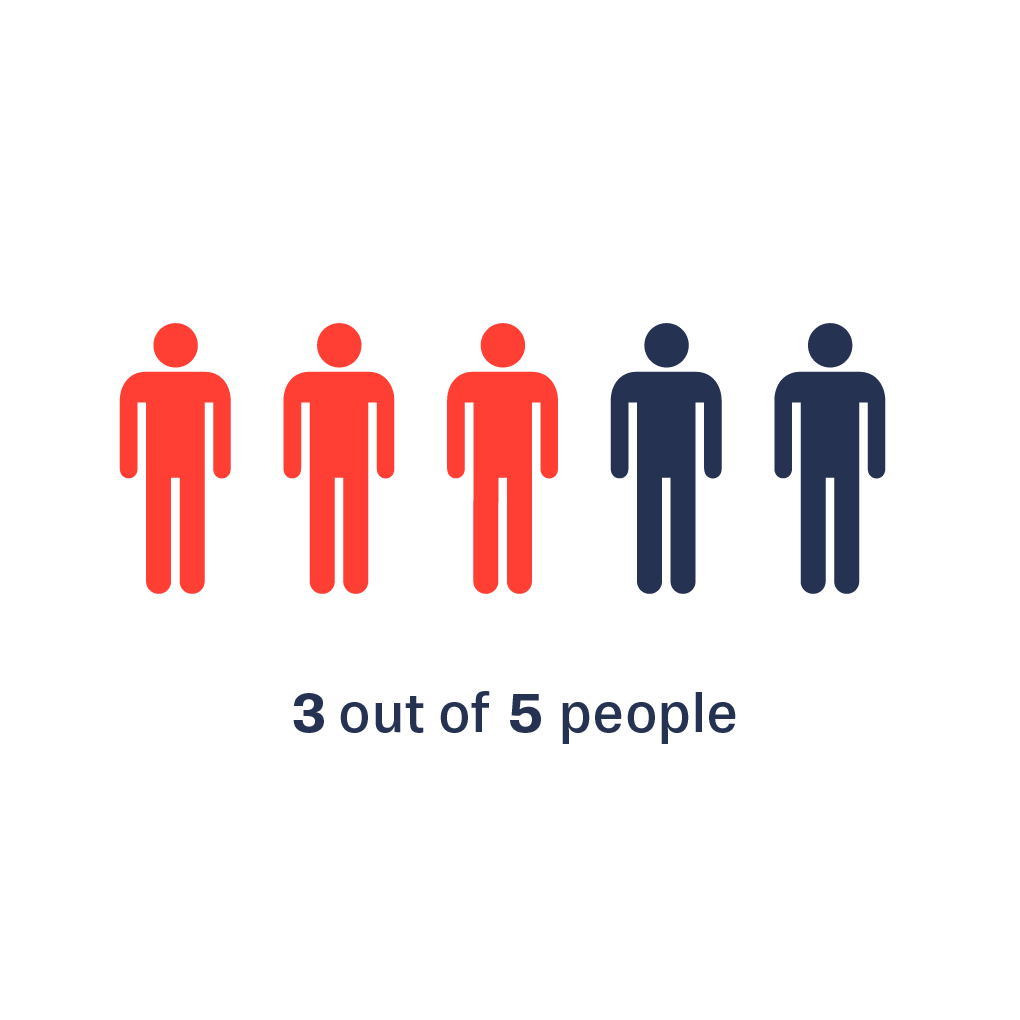
A chart type that is using pictograms (icons, pictures, illustrations, etc.) to show fractions – e.g. one in five people eat five or more portions of fruit and vegetables a day. It is a very illustrative data visualization and has become quite popular in modern infographics for simple facts.
A related visualization is the Pictorial Percentage Chart that visualize percentages.