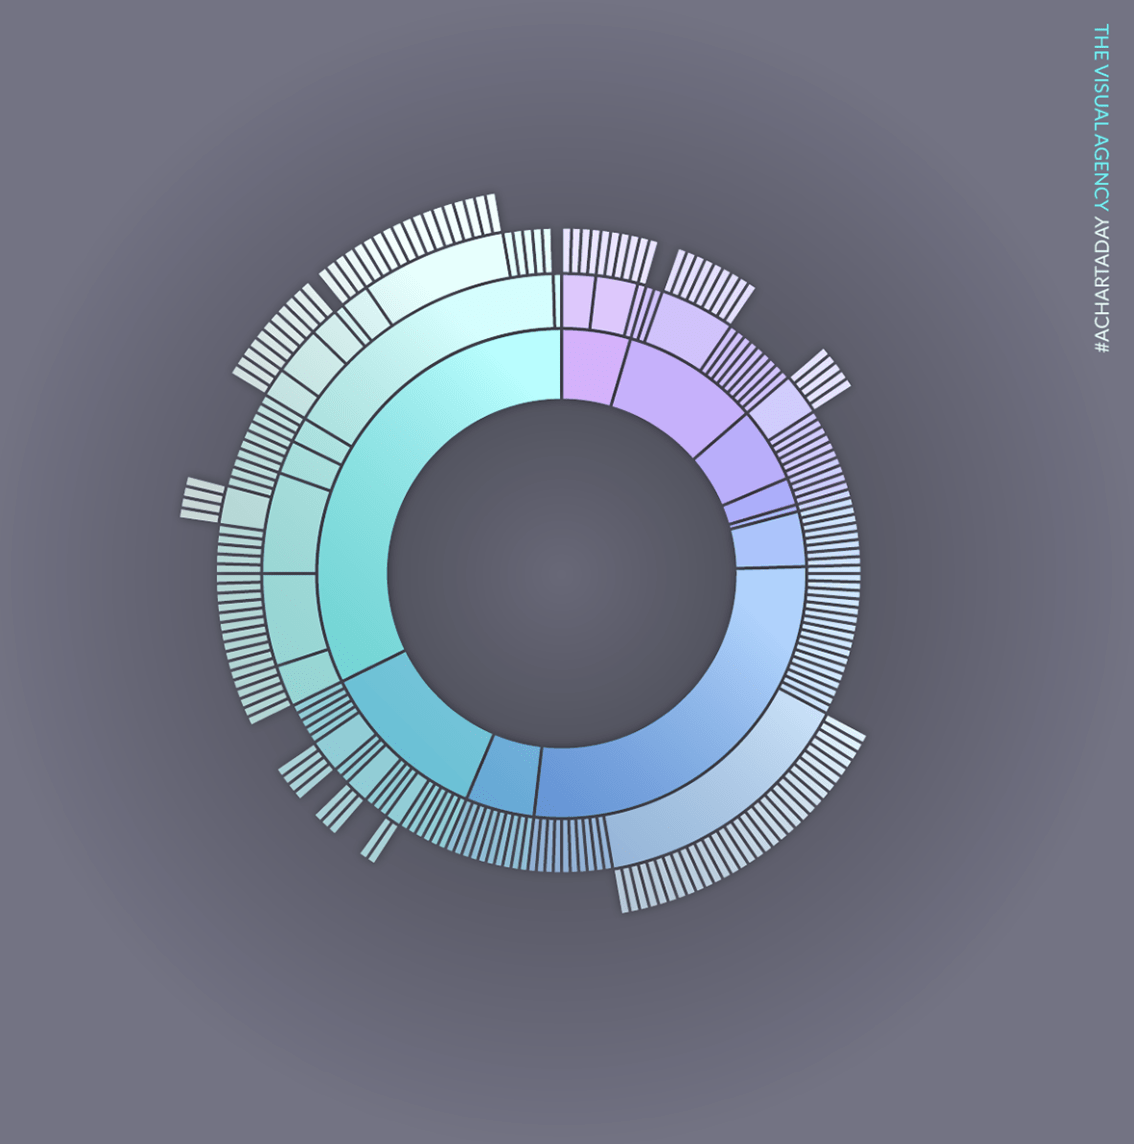
Sunburst Diagram
Also called: Ring chart, Multi-level Pie Chart, Sunburst partition
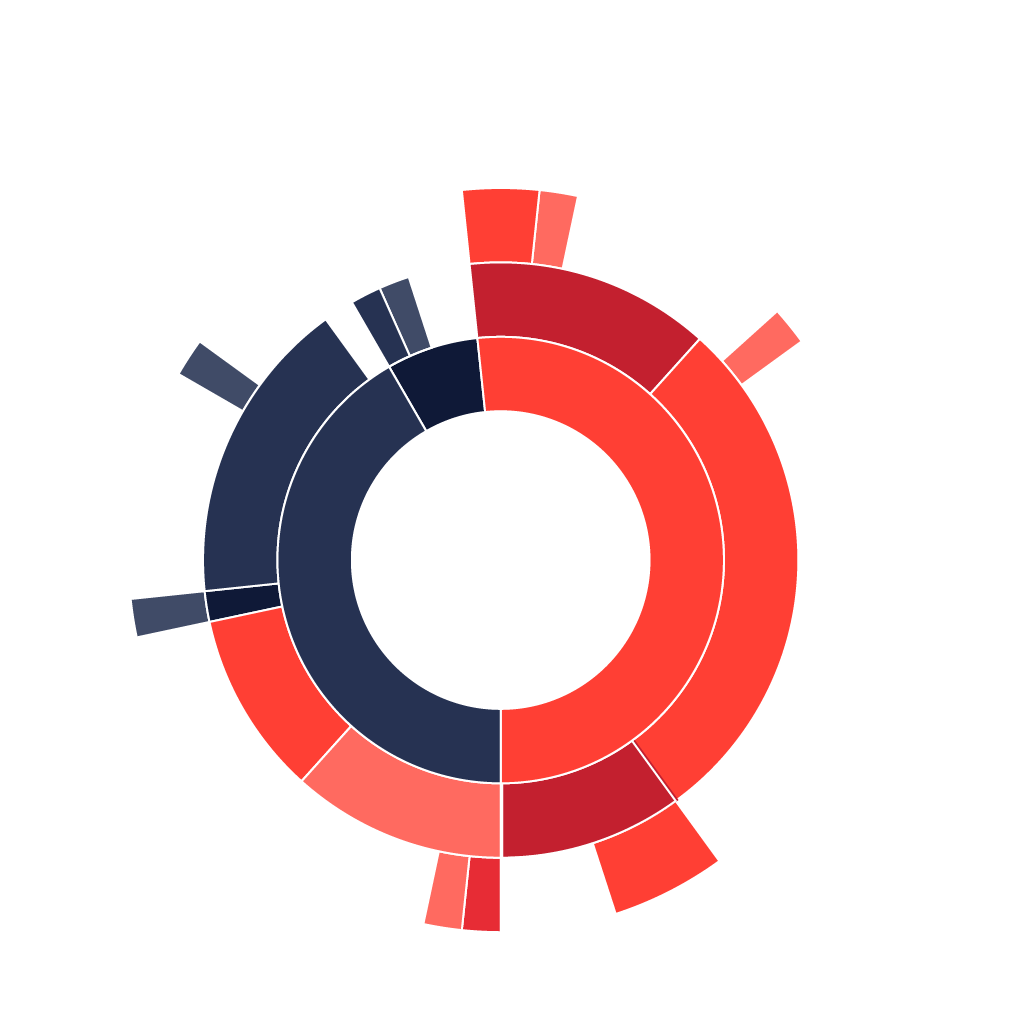
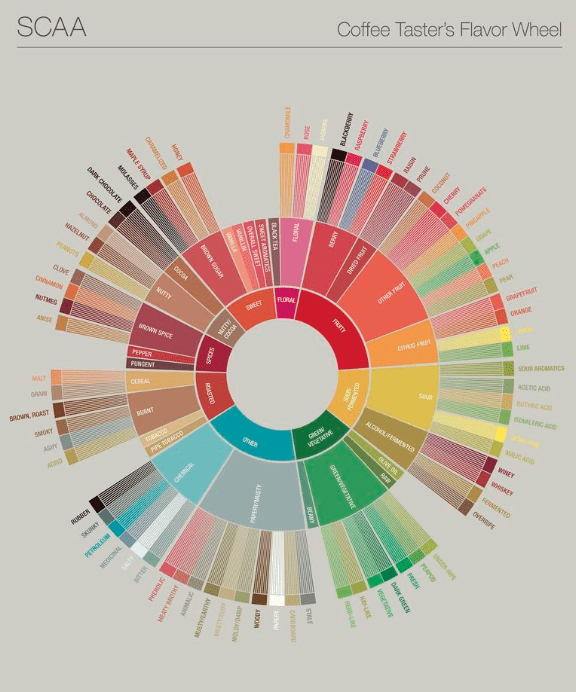
A Sunburst Diagram is used to visualize hierarchical data, depicted by concentric circles. The circle in the centre represents the root node, with the hierarchy moving outward from the center. A segment of the inner circle bears a hierarchical relationship to those segments of the outer circle which lie within the angular sweep of the parent segment.
A sunburst chart without any hierarchical data (one level of categories), looks similar to a doughnut chart. However, a sunburst chart with multiple levels of categories shows how the outer rings relate to the inner rings.