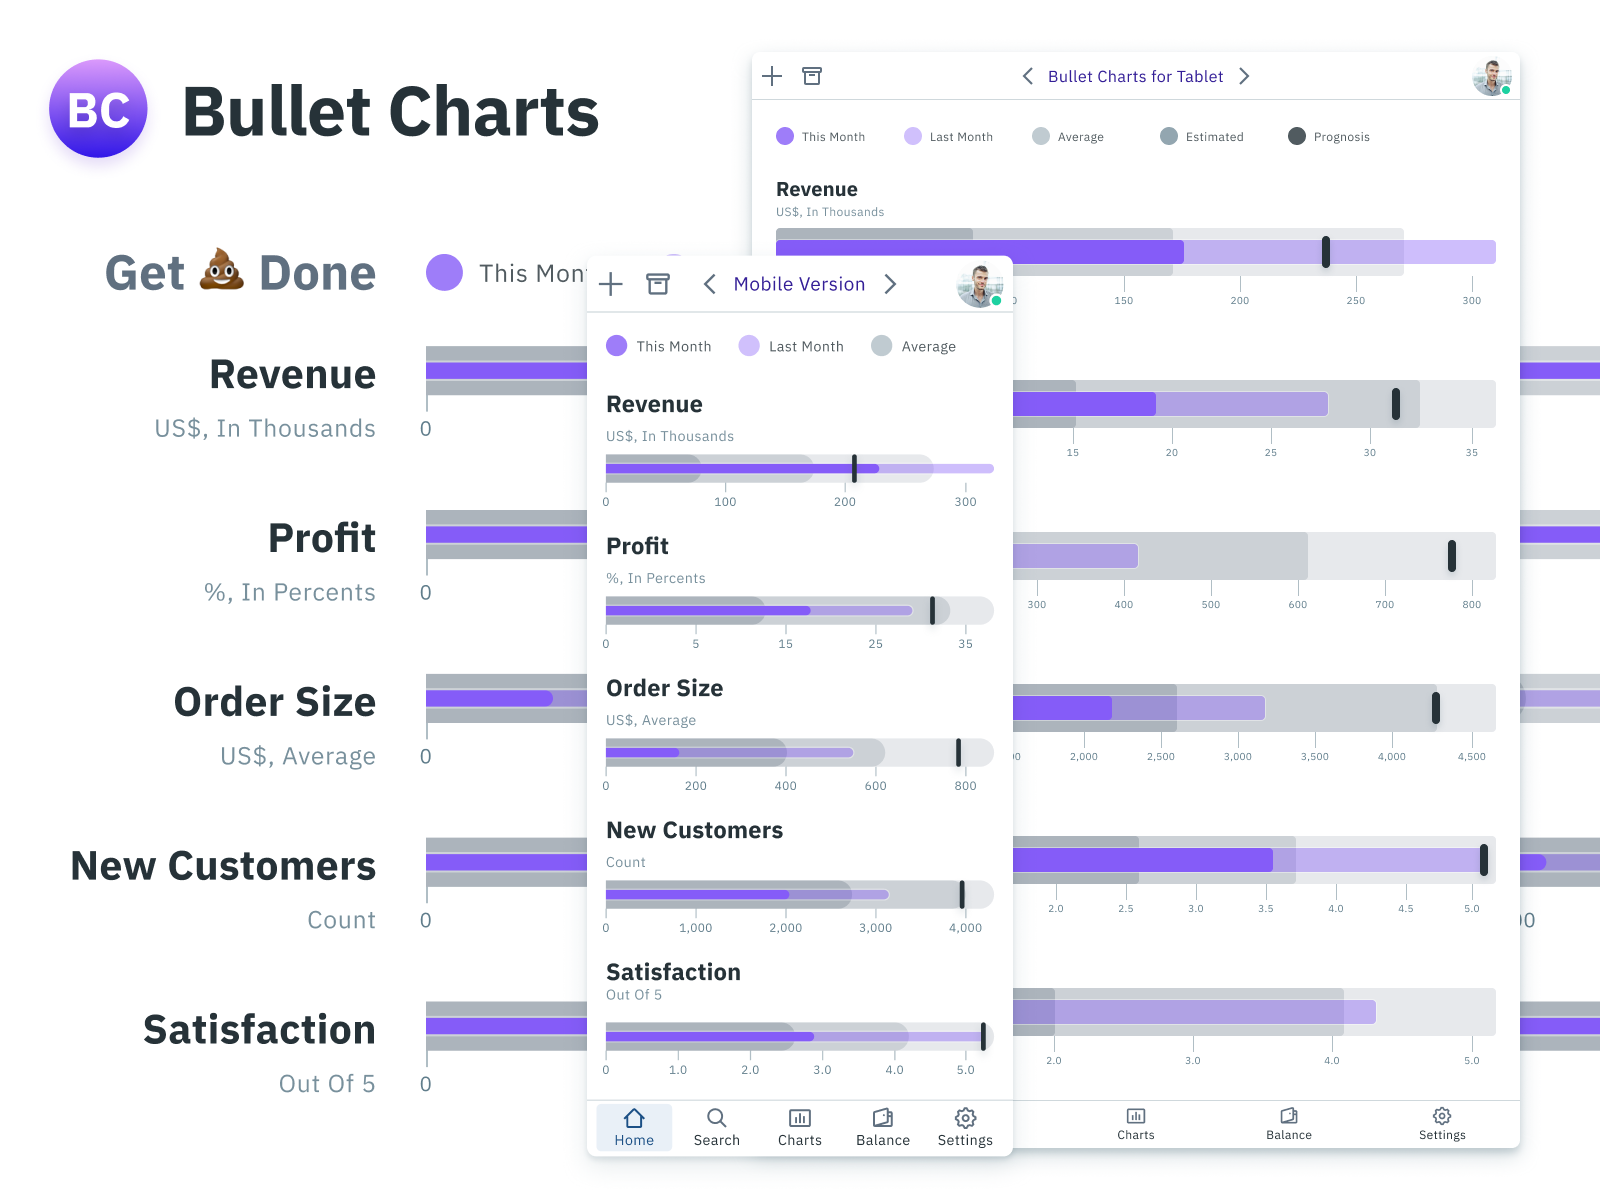
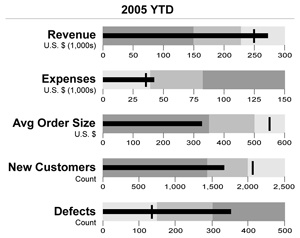
Bullet Graph
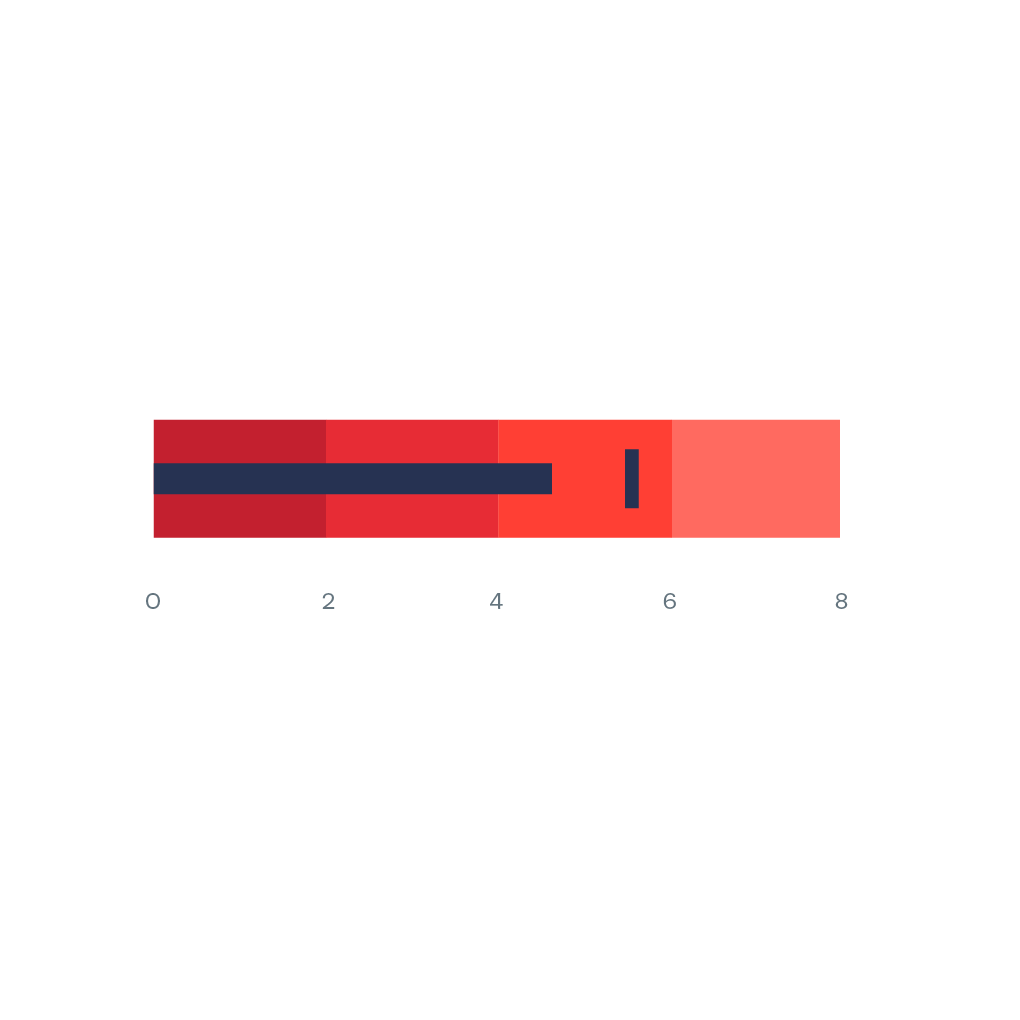
A Bullet Graph is a variation of a Bar Graph. Seemingly inspired by the traditional thermometer charts and progress bars found in many dashboards, the bullet graph serves as a replacement for dashboard gauges and meters. Bullet graphs were developed to overcome the fundamental issues of gauges and meters: they typically display too little information, require too much space, and are cluttered with useless and distracting decoration.