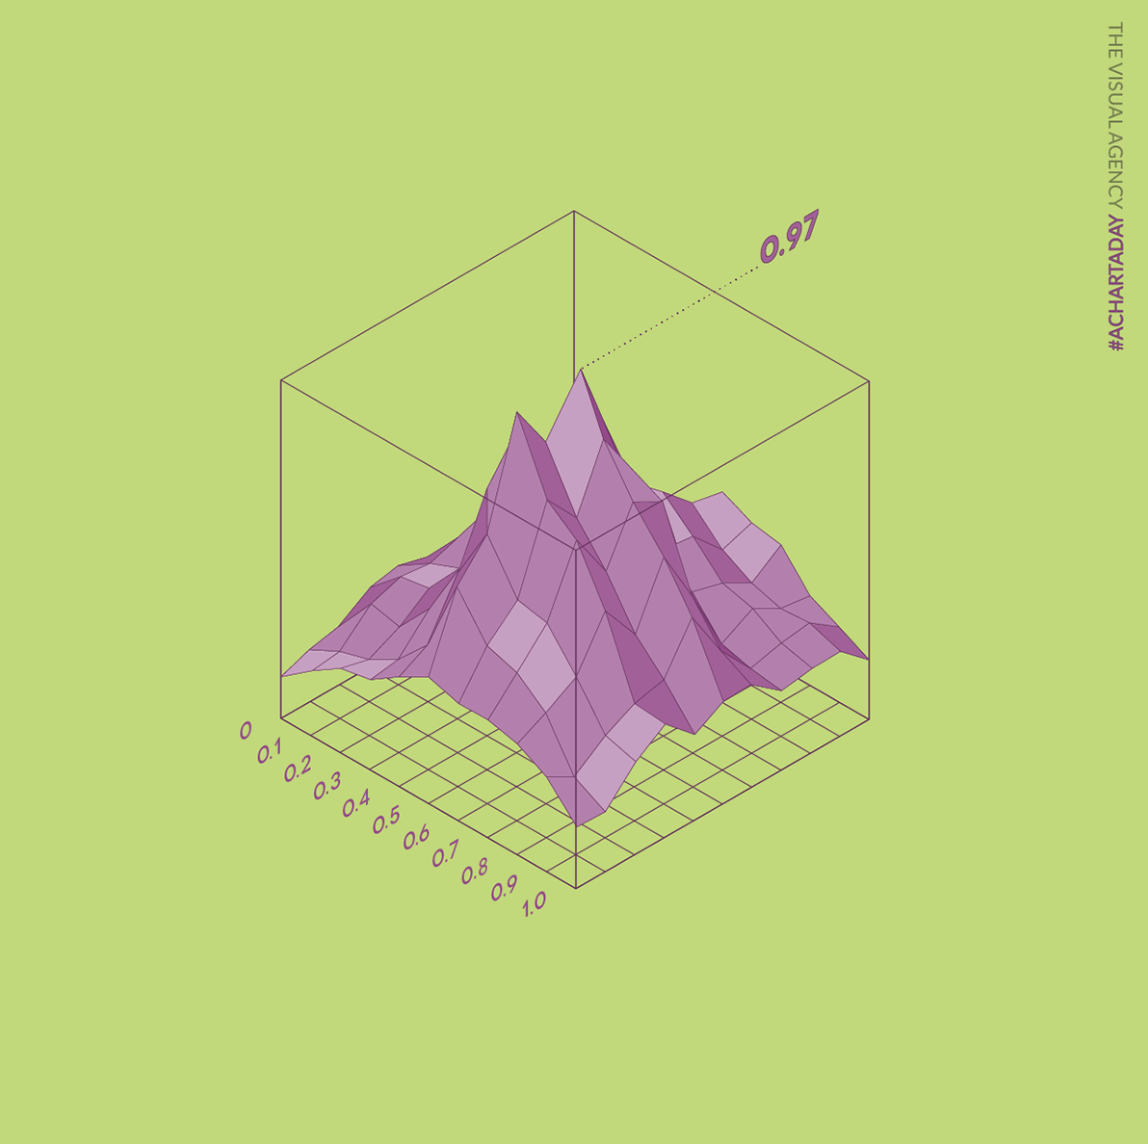
3D Stream Graph
Also called: 3-D surface plot

A three-dimensional Stream Graph is the graph of a function f(x, y) of two variables, or the graph of a relationship g(x, y, z) among three variables.Provided that x, y, and z or f(x, y) are real numbers, the graph can be represented as a planar or curved surface in a three-dimensional Cartesian coordinate system. A three-dimensional graph is typically drawn on a two-dimensional page or screen using perspective methods, so that one of the dimensions appears to be coming out of the page.