Choropleth Map
Also called: Choropleth Heat Map
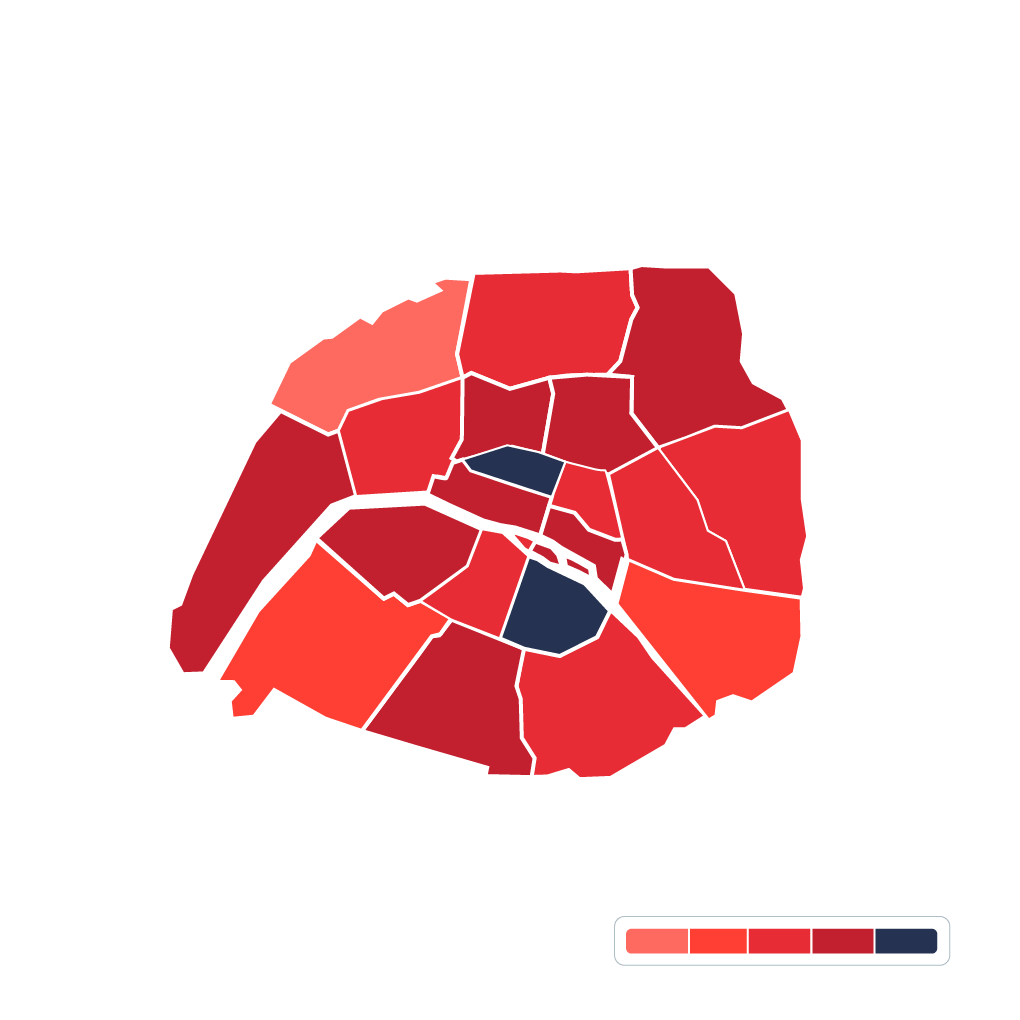
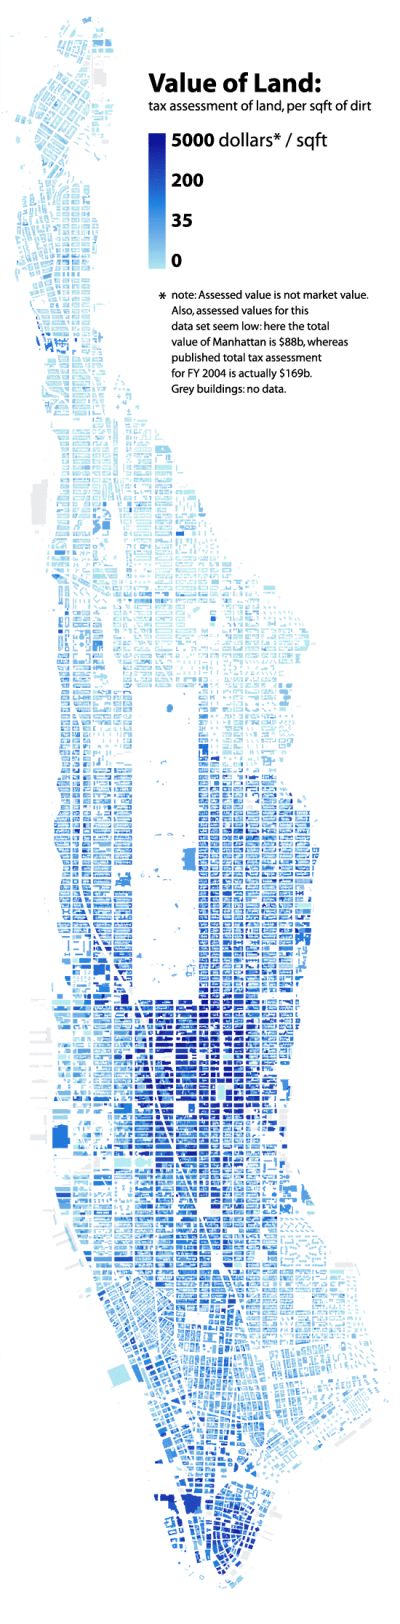
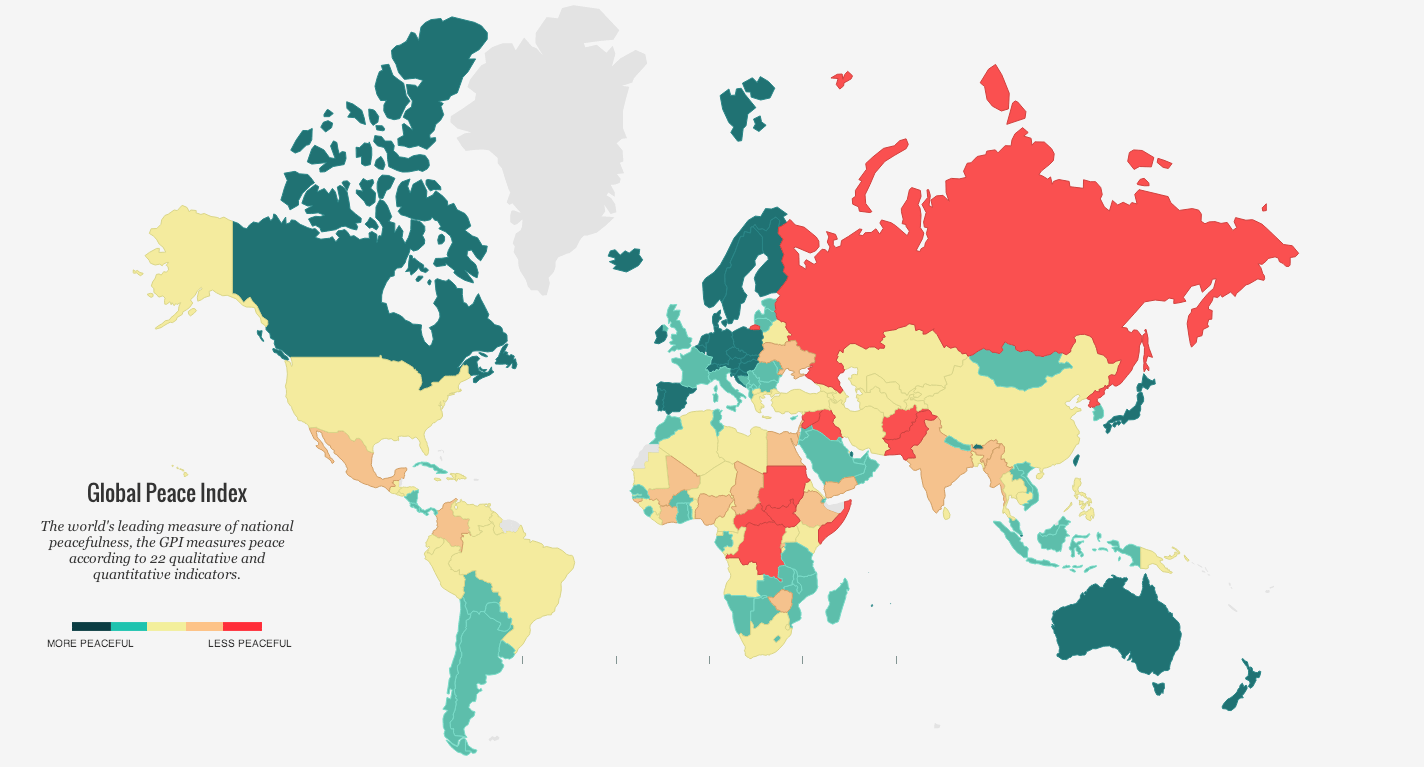
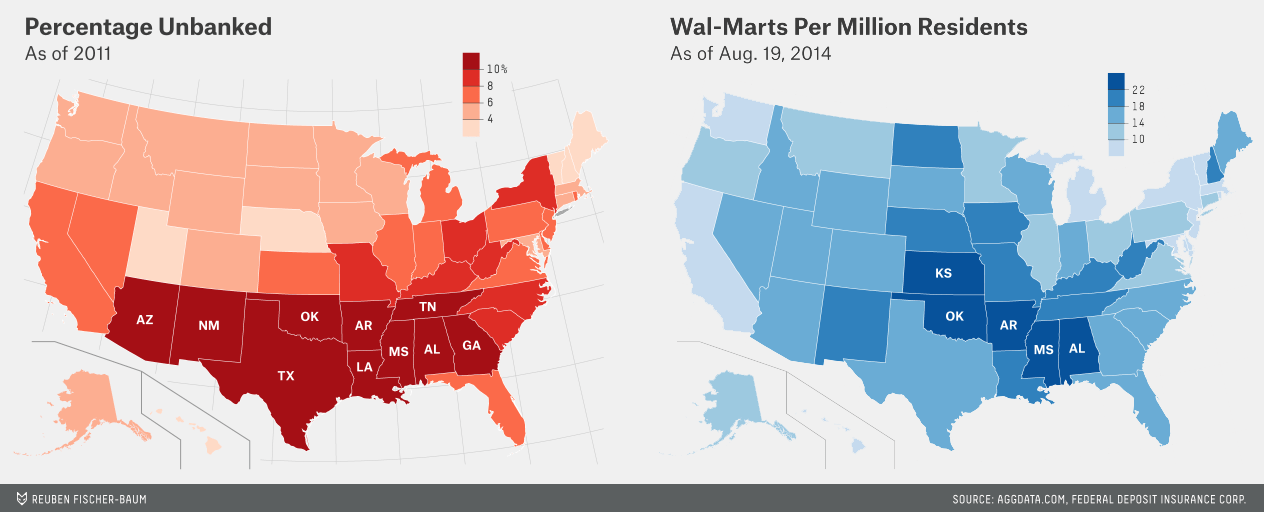
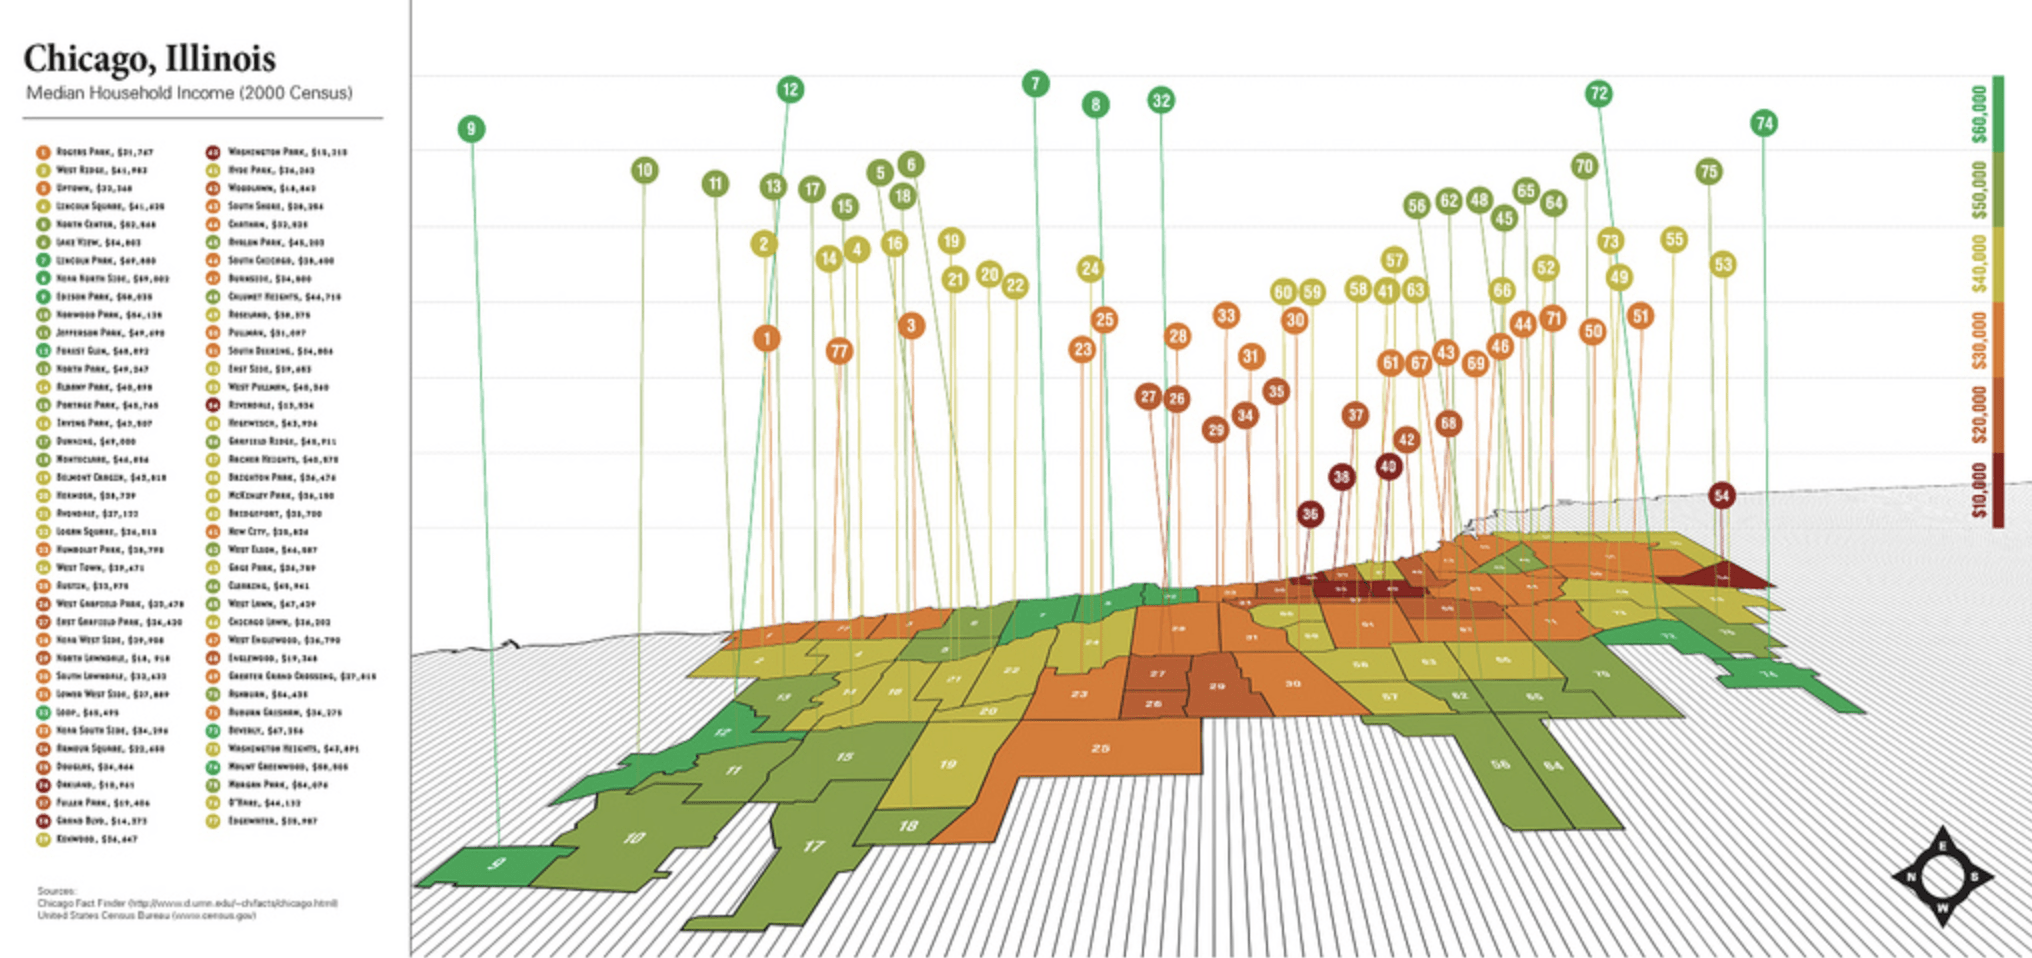
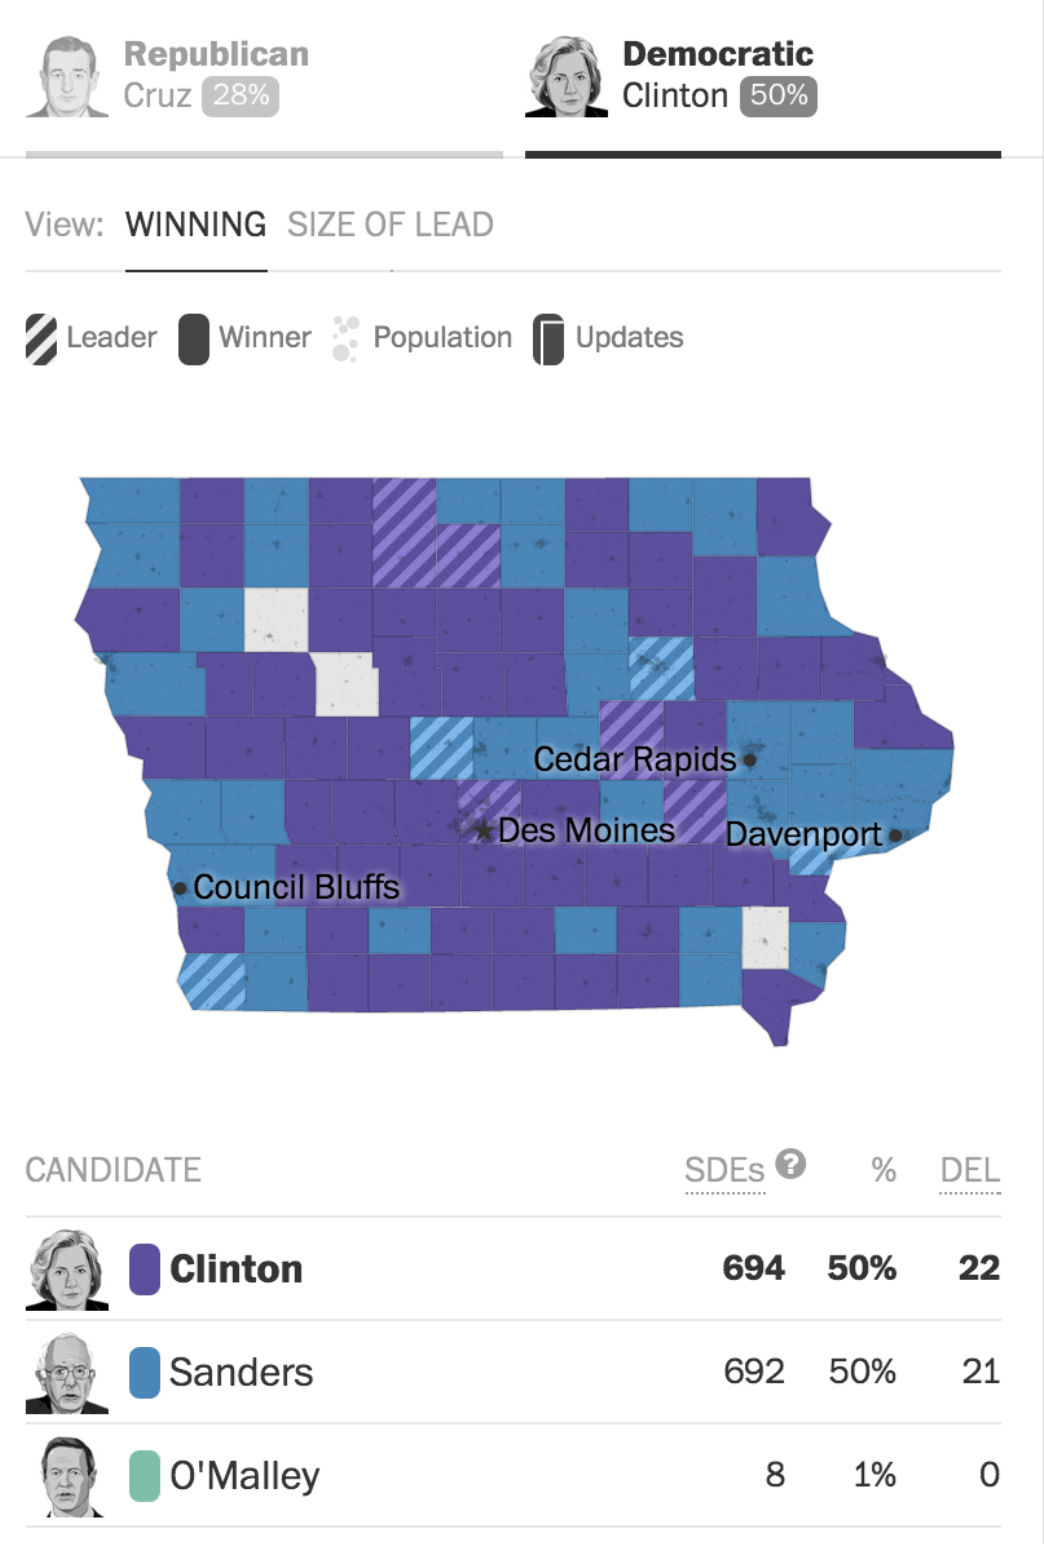
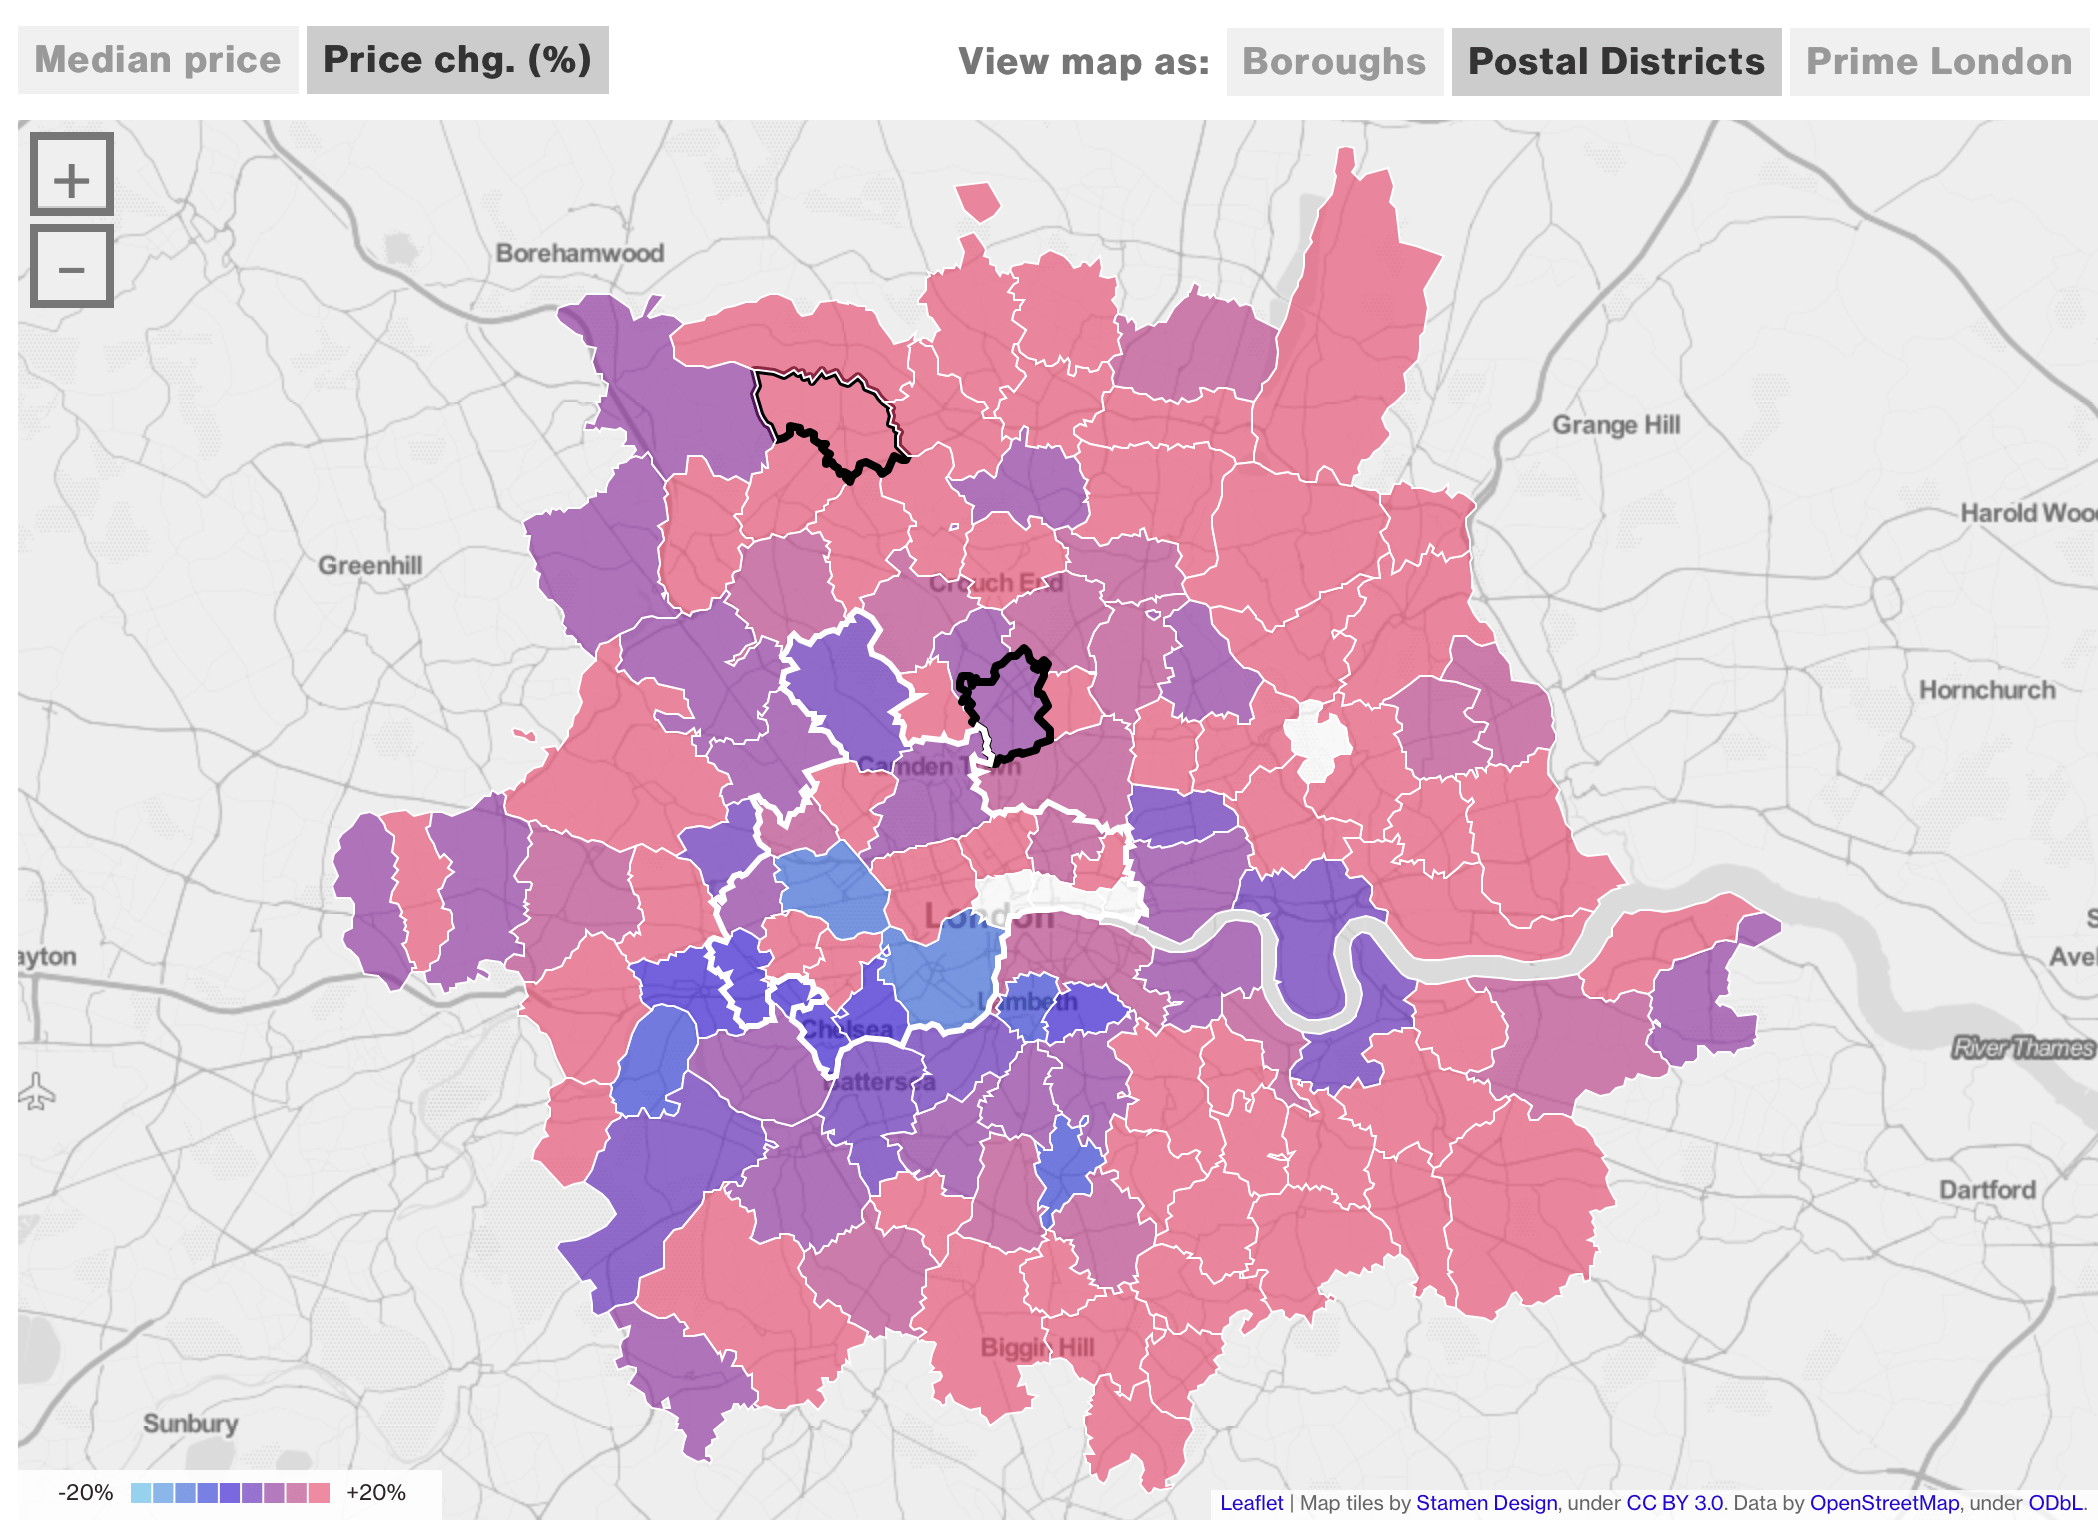
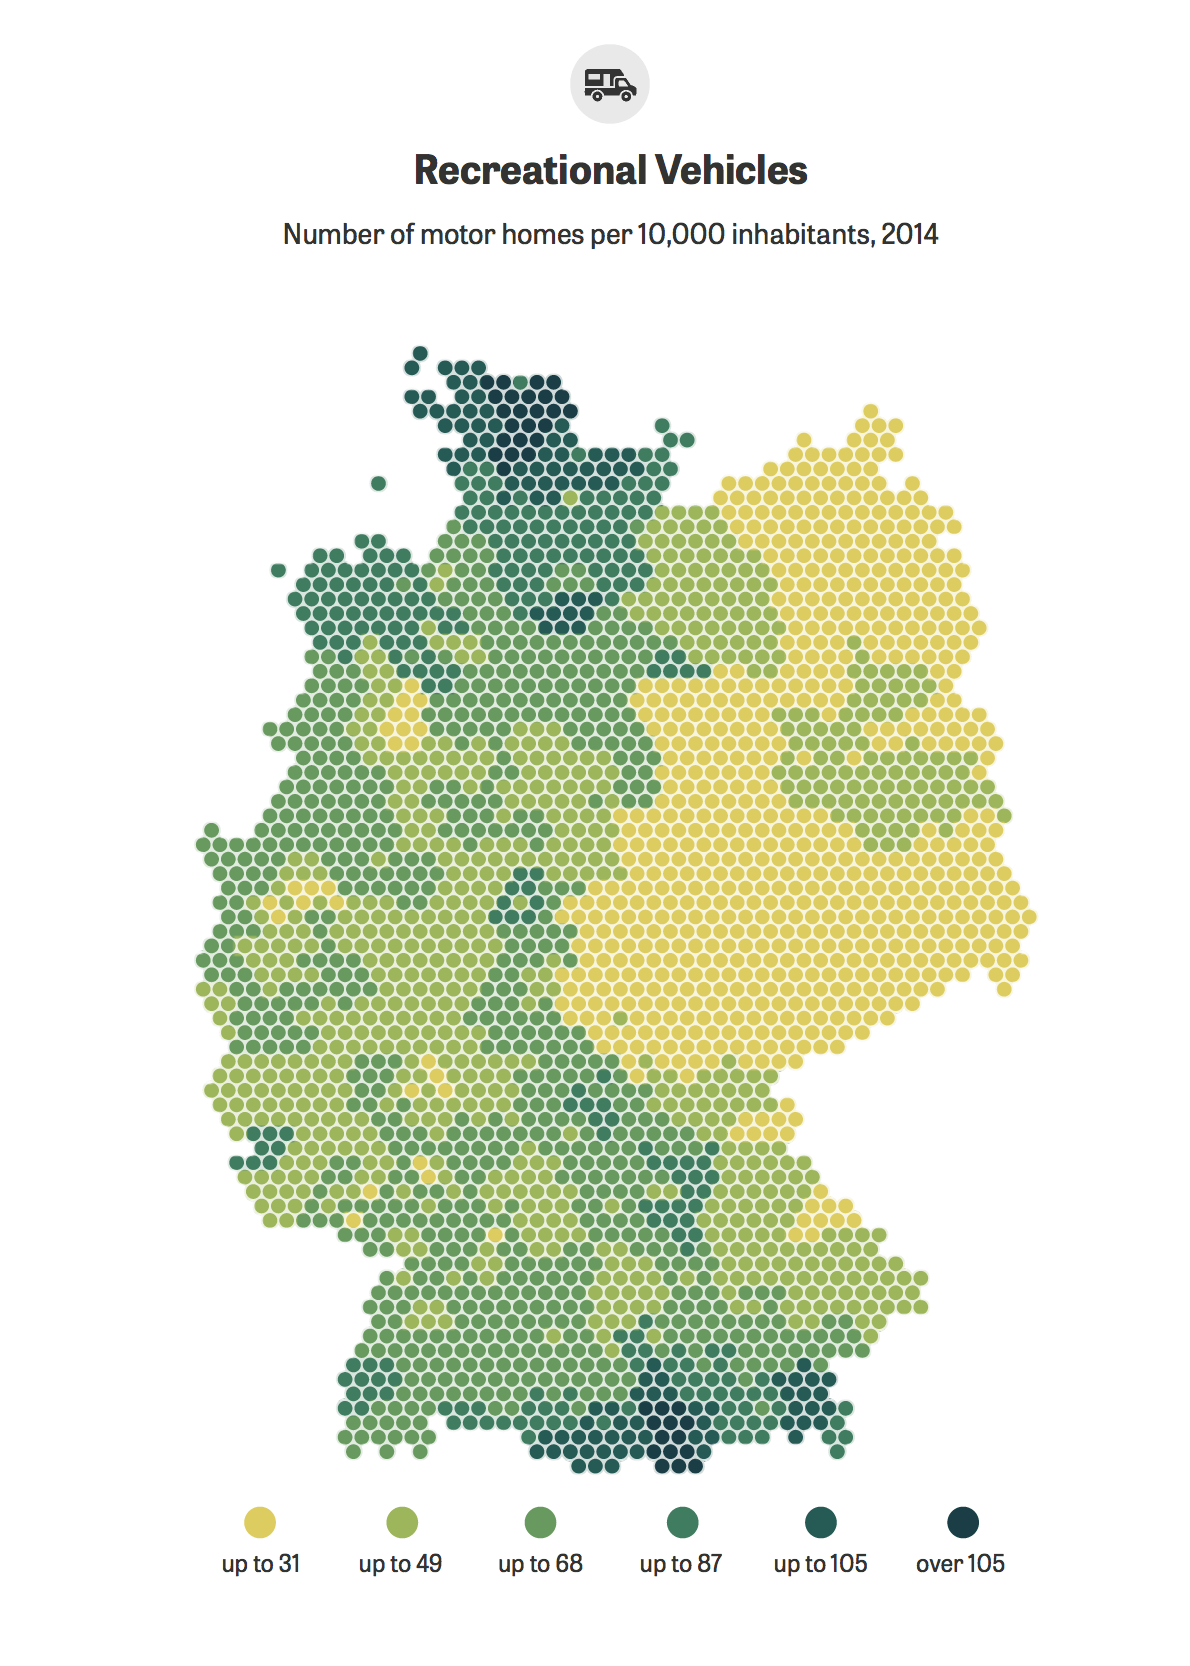
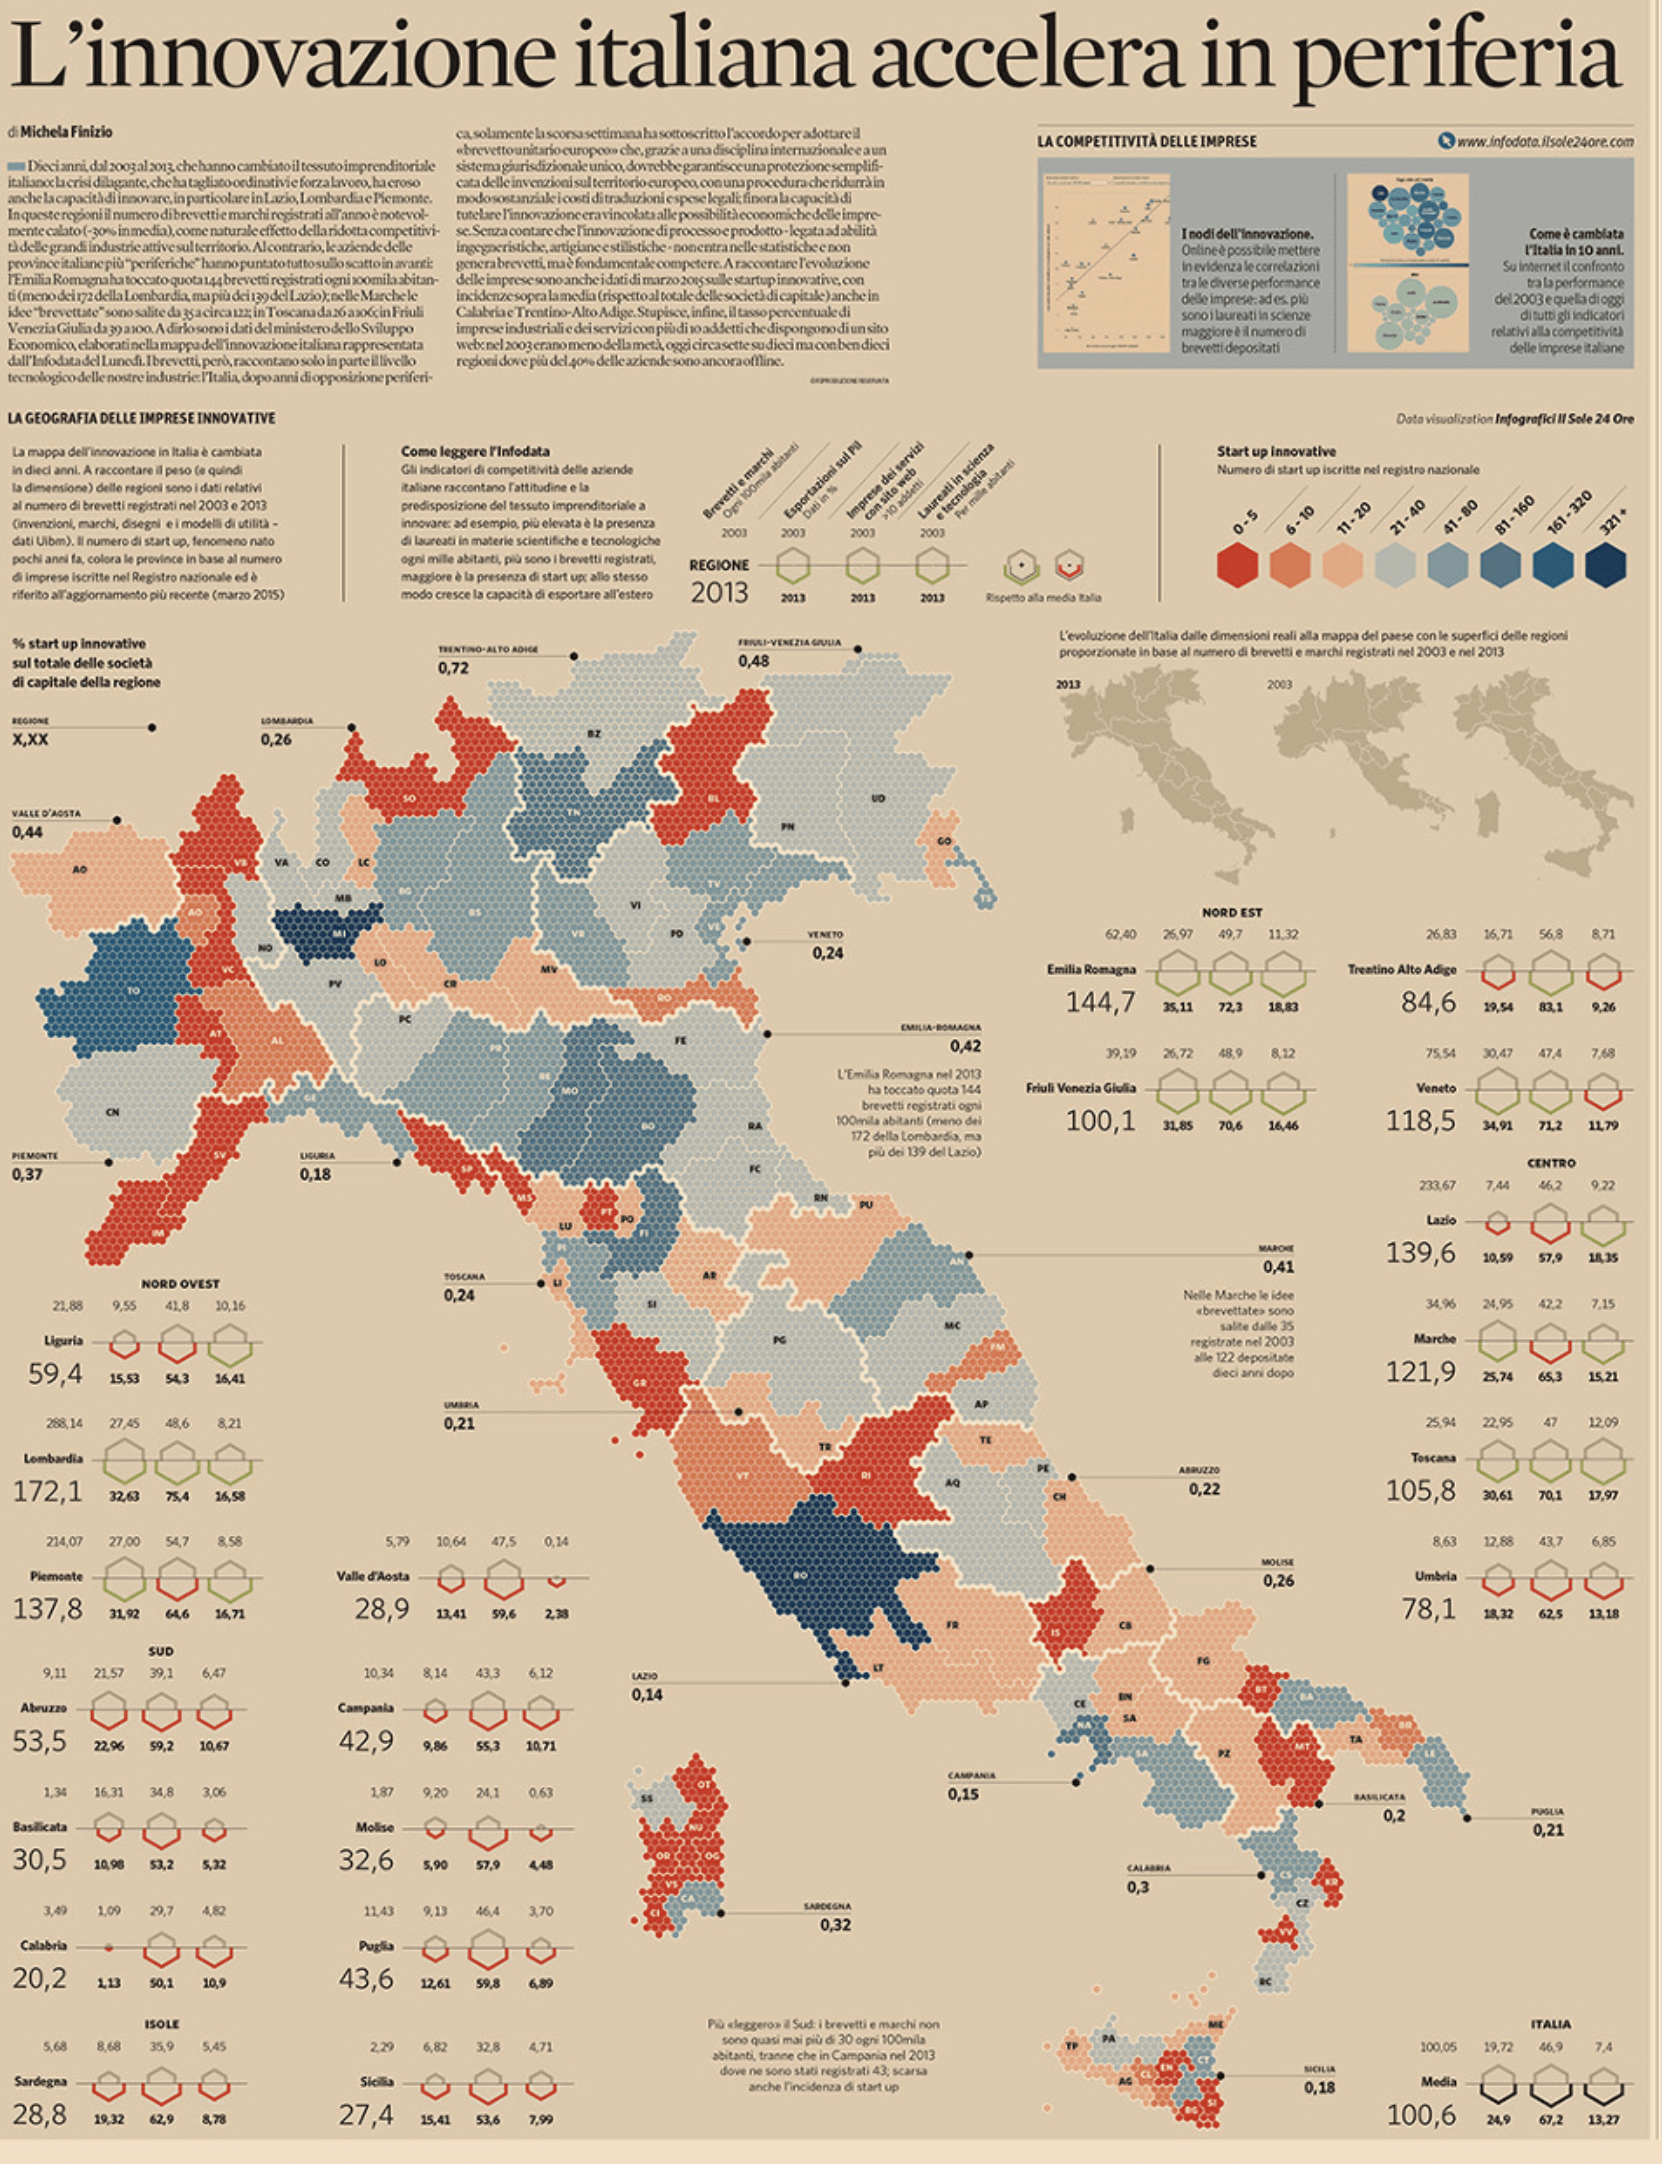
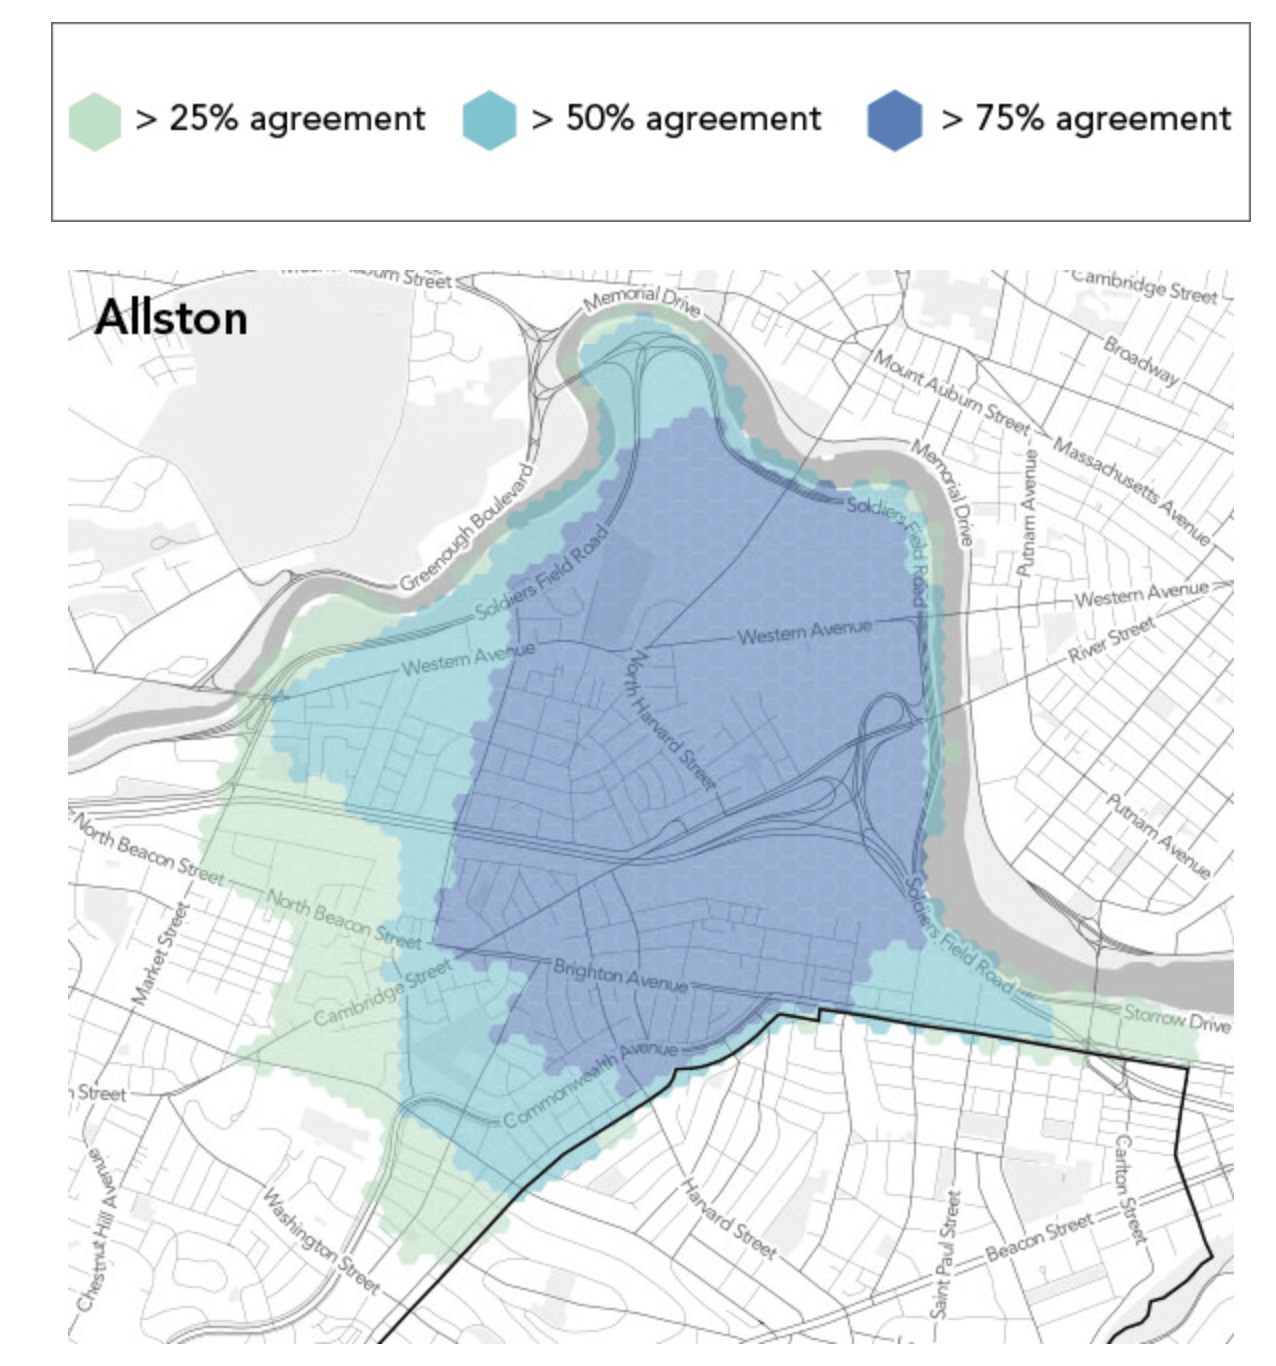
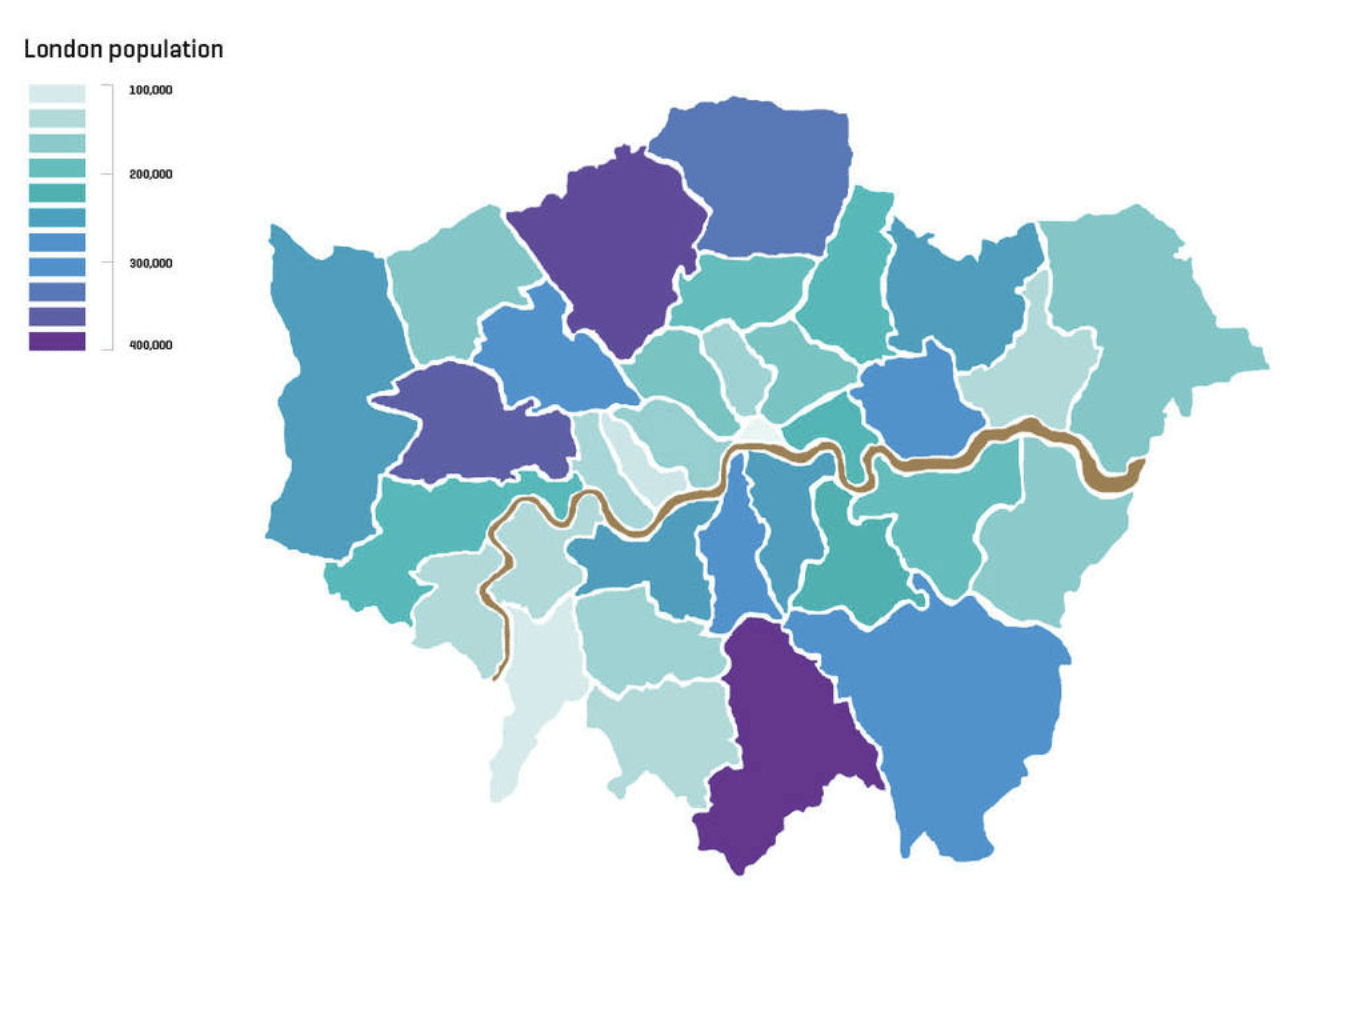
A Choropleth Map is a thematic map in which areas are shaded or patterned in proportion to the measurement of the statistical variable being displayed on the map, such as population density or per-capita income. The choropleth map provides an easy way to visualize how a measurement varies across a geographic area or it shows the level of variability within a region.