Strip Plot
Also called: Individual Value Plot or Single-Axis Scatter Plot
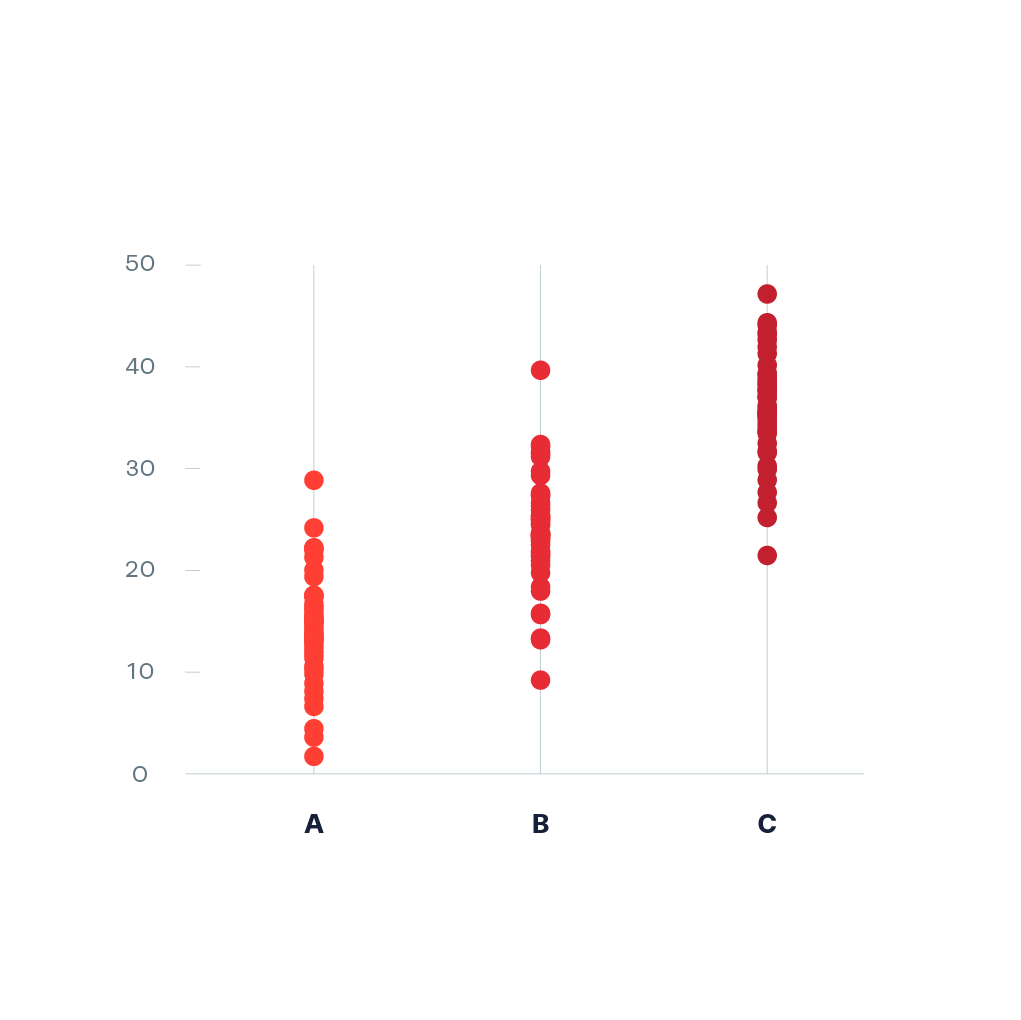
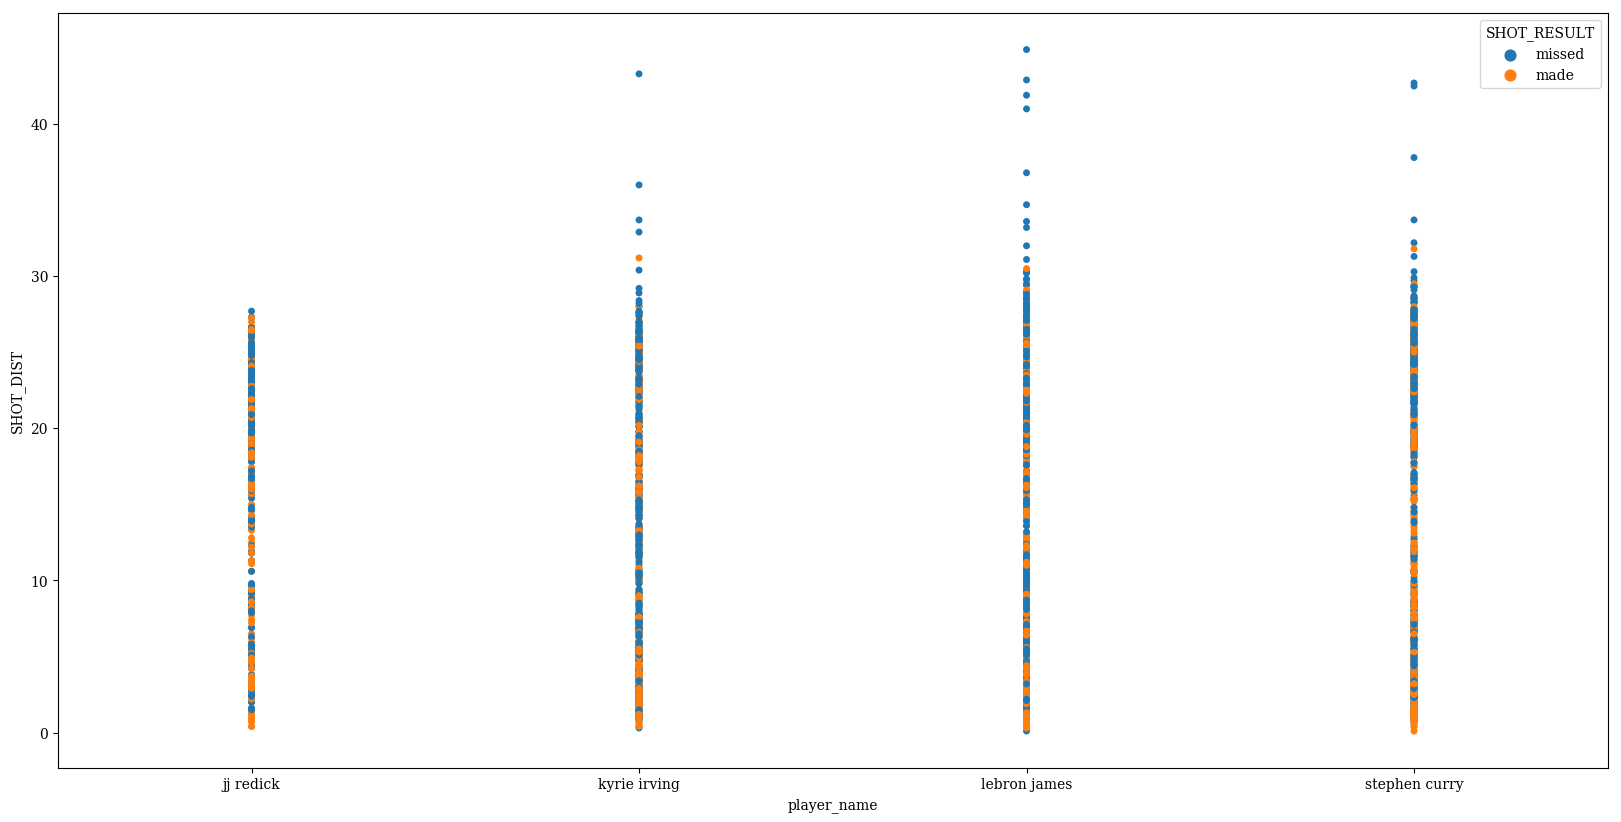
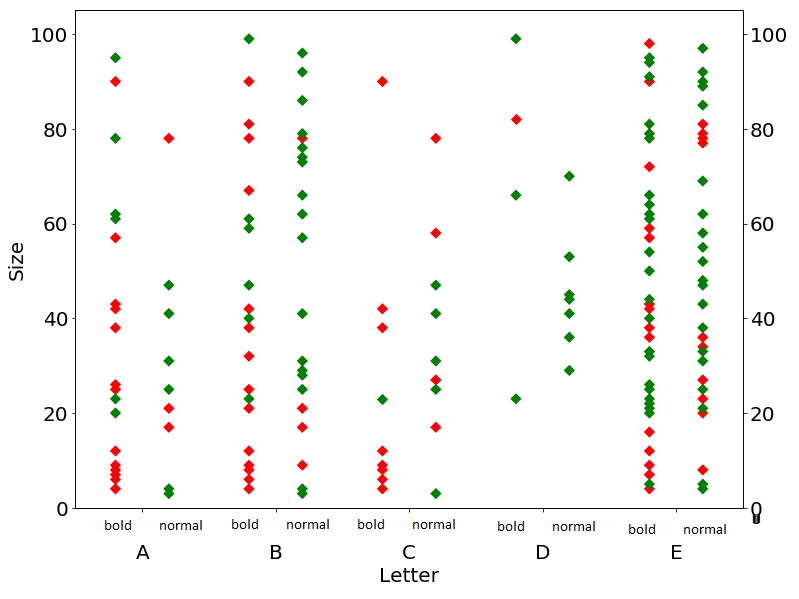
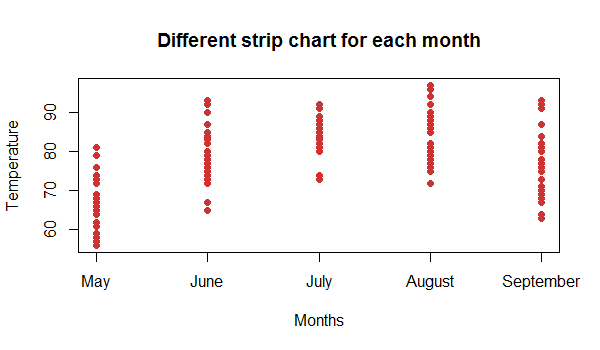
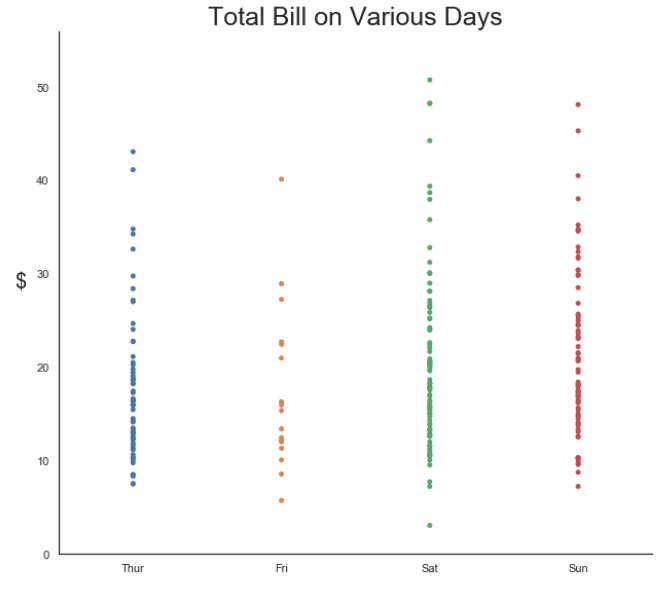
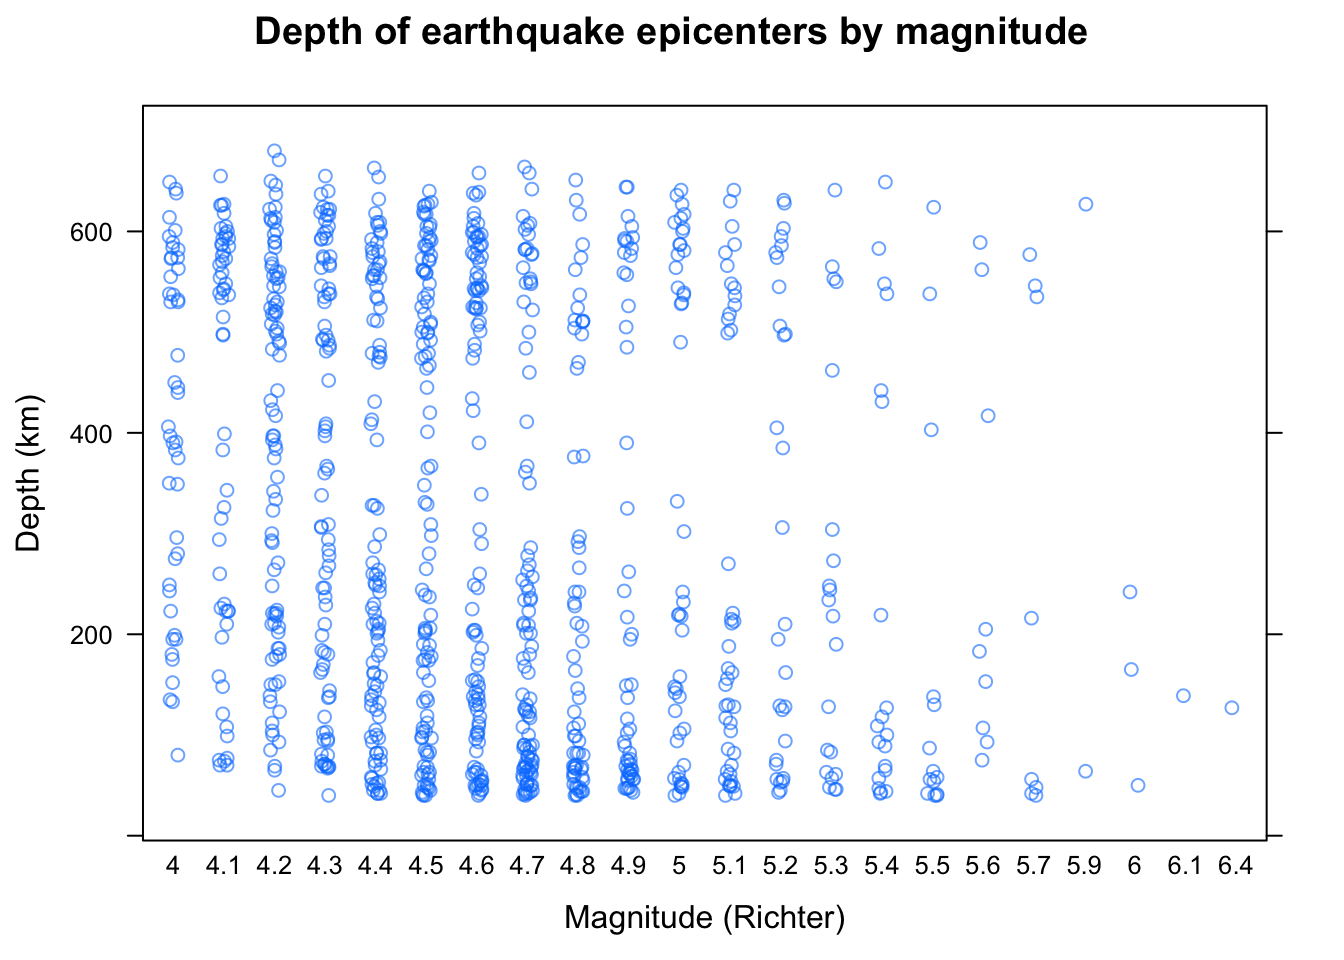
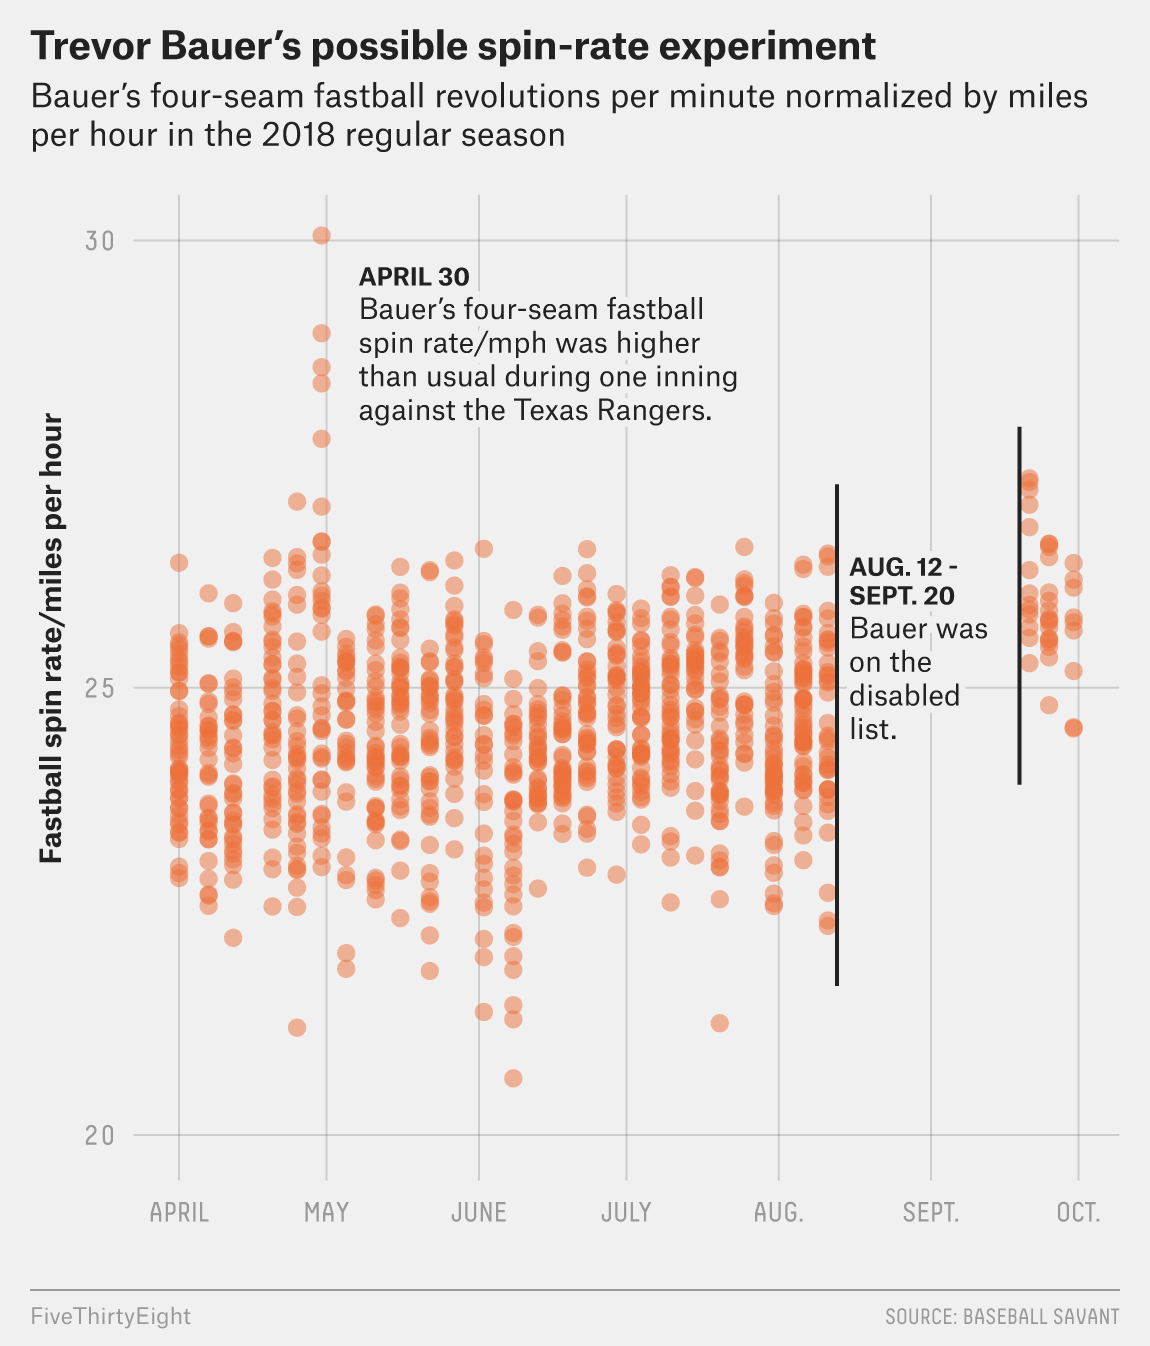
A strip plot is a single-axis scatter plot that is used to visualise the distribution of many individual one-dimensional values. The values are plotted as dots along one unique axis, and the dots with the same value can overlap. To show overlapping values, the opacity or colour of the dots can be changed, or a jitter plot or counts plot can be used instead. Typically, several strip plots are placed side by side to compare the distributions of data points among several values, categories or ranges.
Other ways to visualise similar data include violin plots and boxplots.