Candlestick Chart
Also called: Japanese candlestick chart

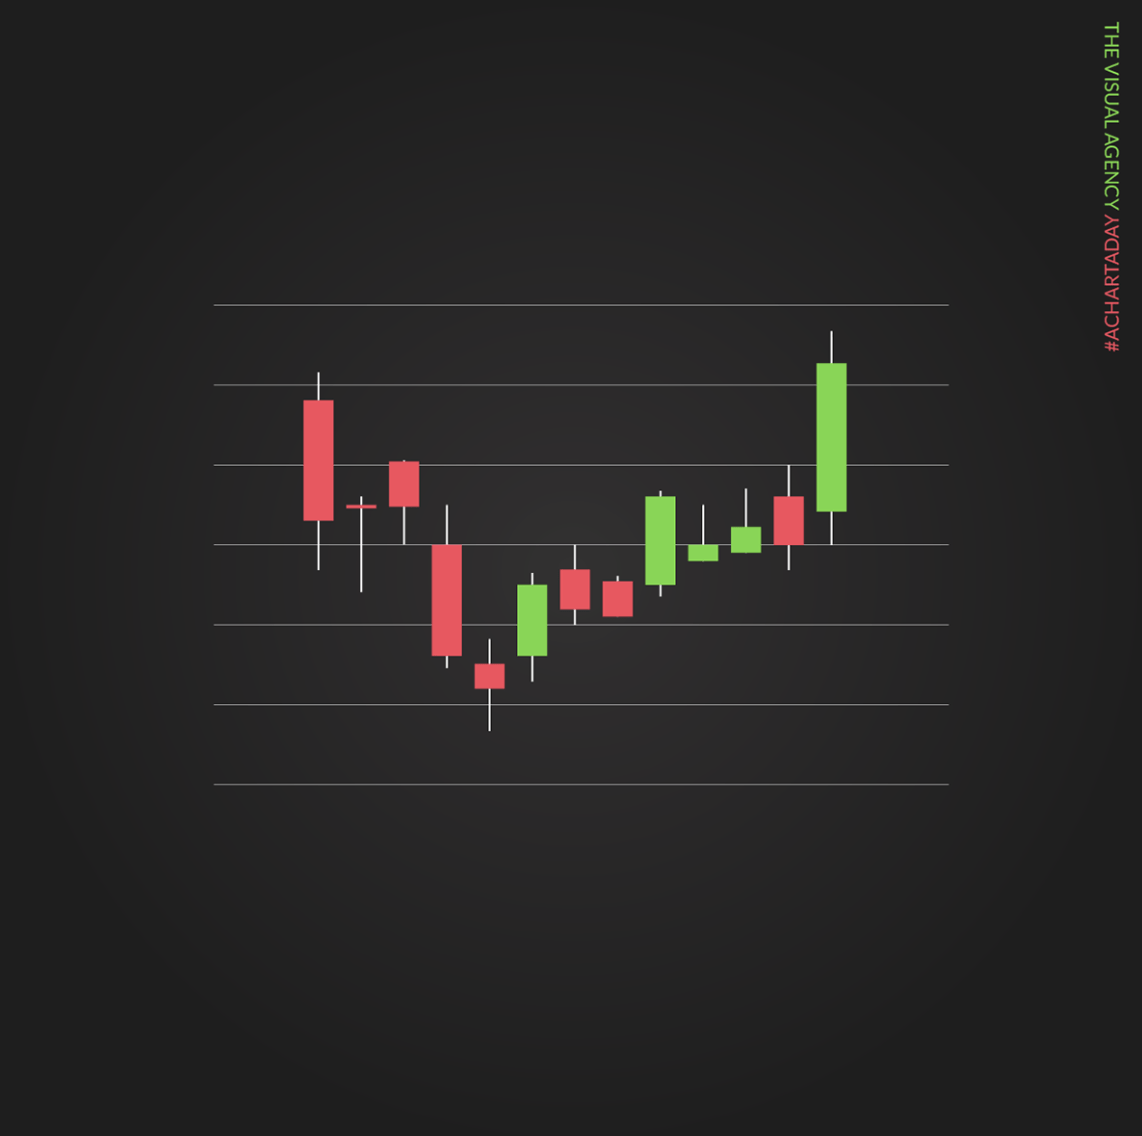
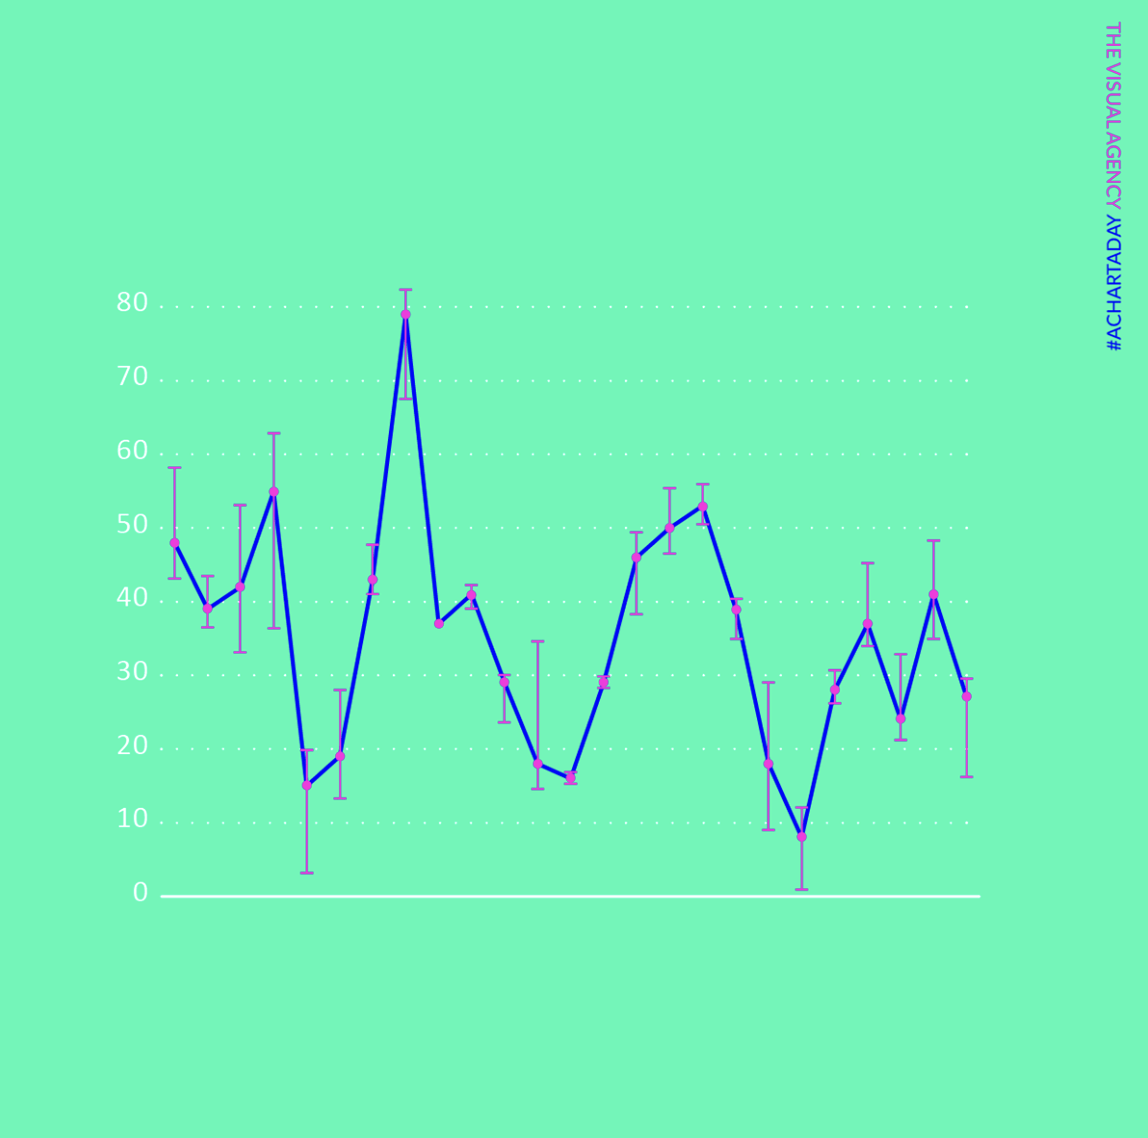
A candlestick chart is a style of bar-chart used to describe price movements of a security, derivative, or currency for a designated span of time. Each bar represents the range of price movement over a given time interval.
It is most often used in technical analysis of equity and currency price patterns. They appear superficially similar to box plots, but are unrelated.
The dataset for a candlestick chart contains low, high, open and close values. The high and low values are visualized as the top and bottom of each stick, where the open and close values are reflected in the square inside.