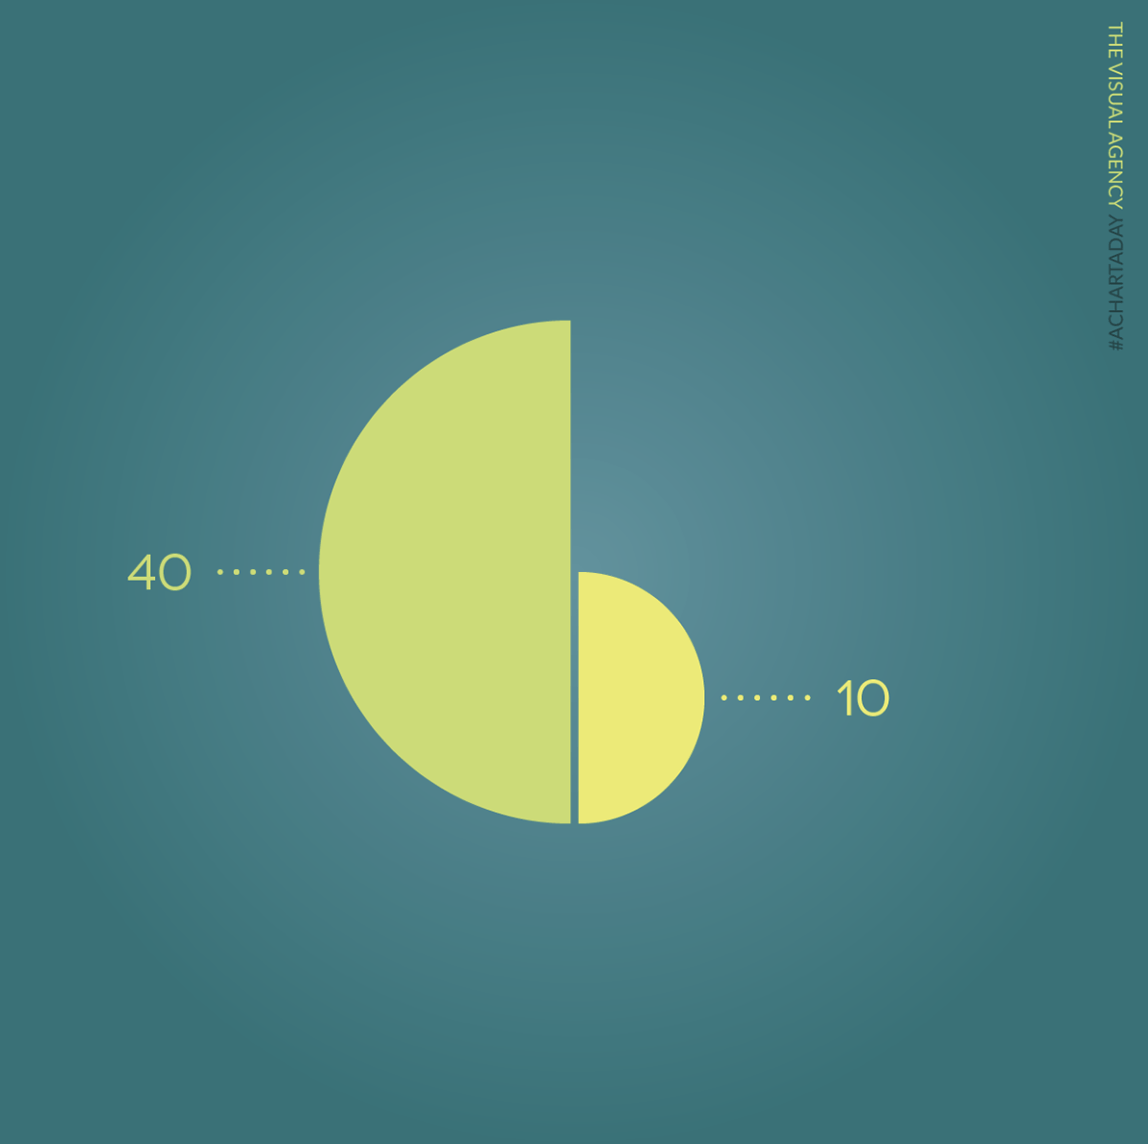
Proportional Area Chart (Half Circle)
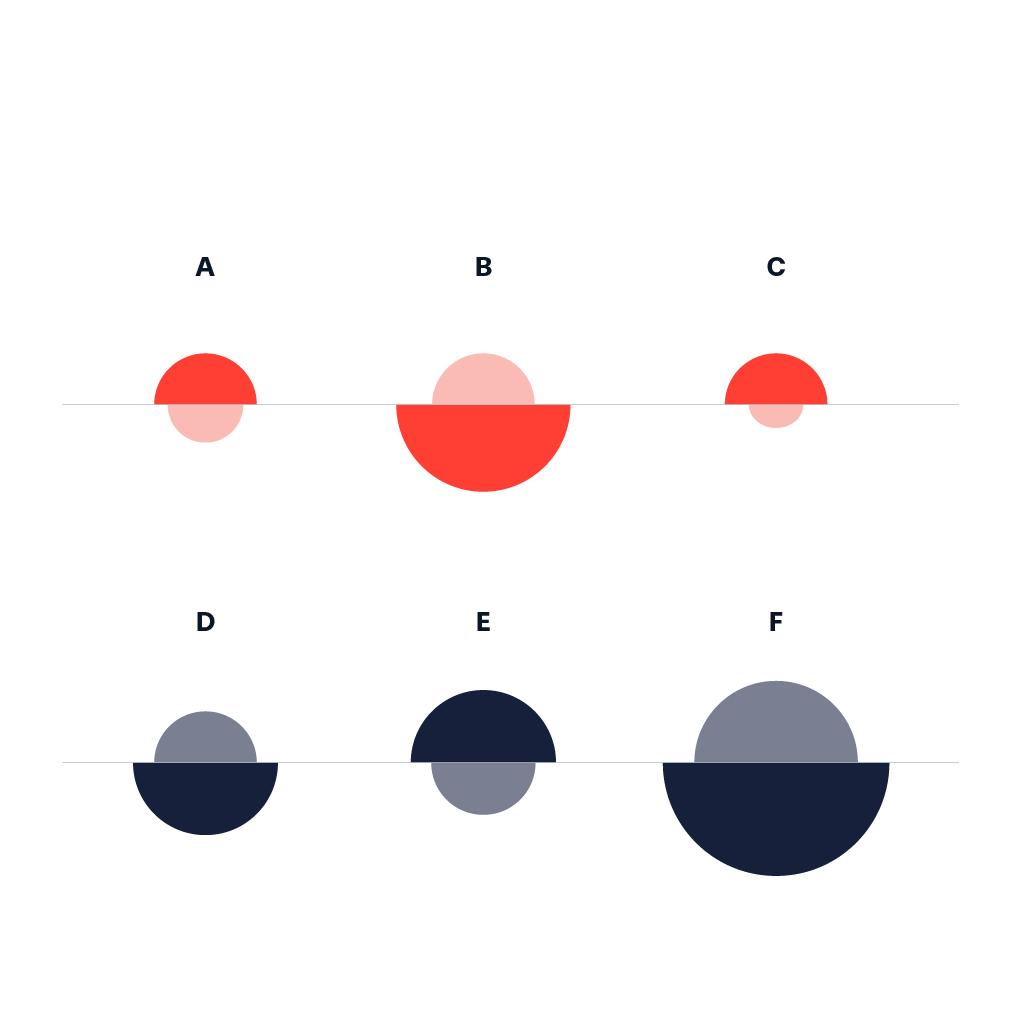
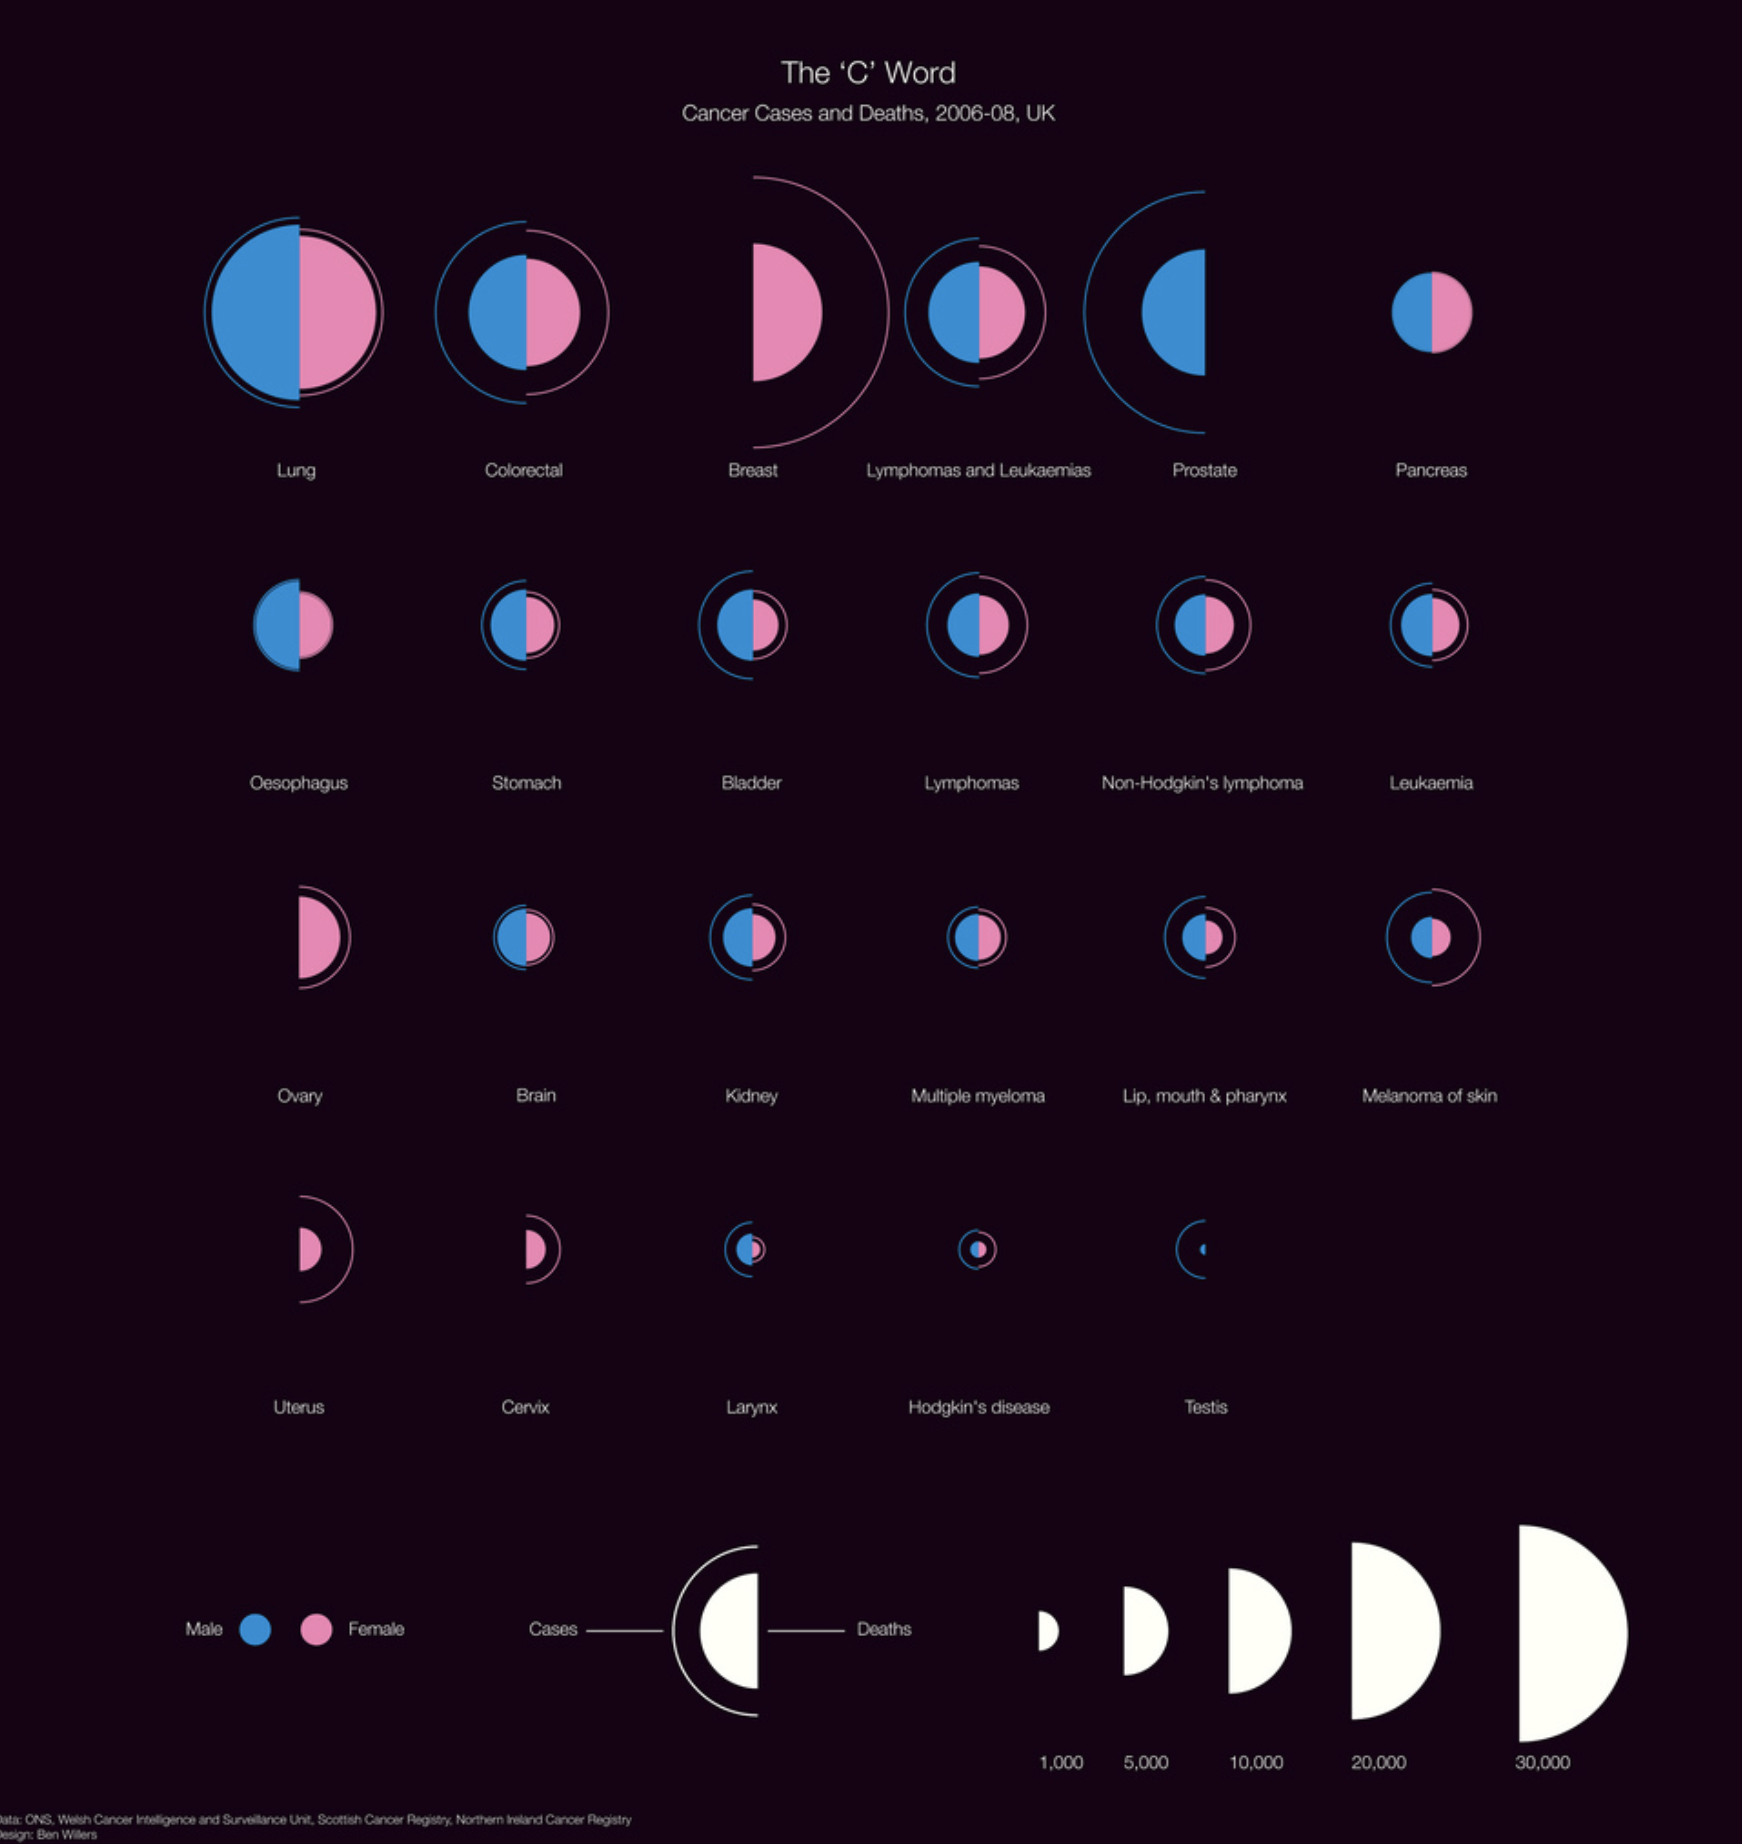
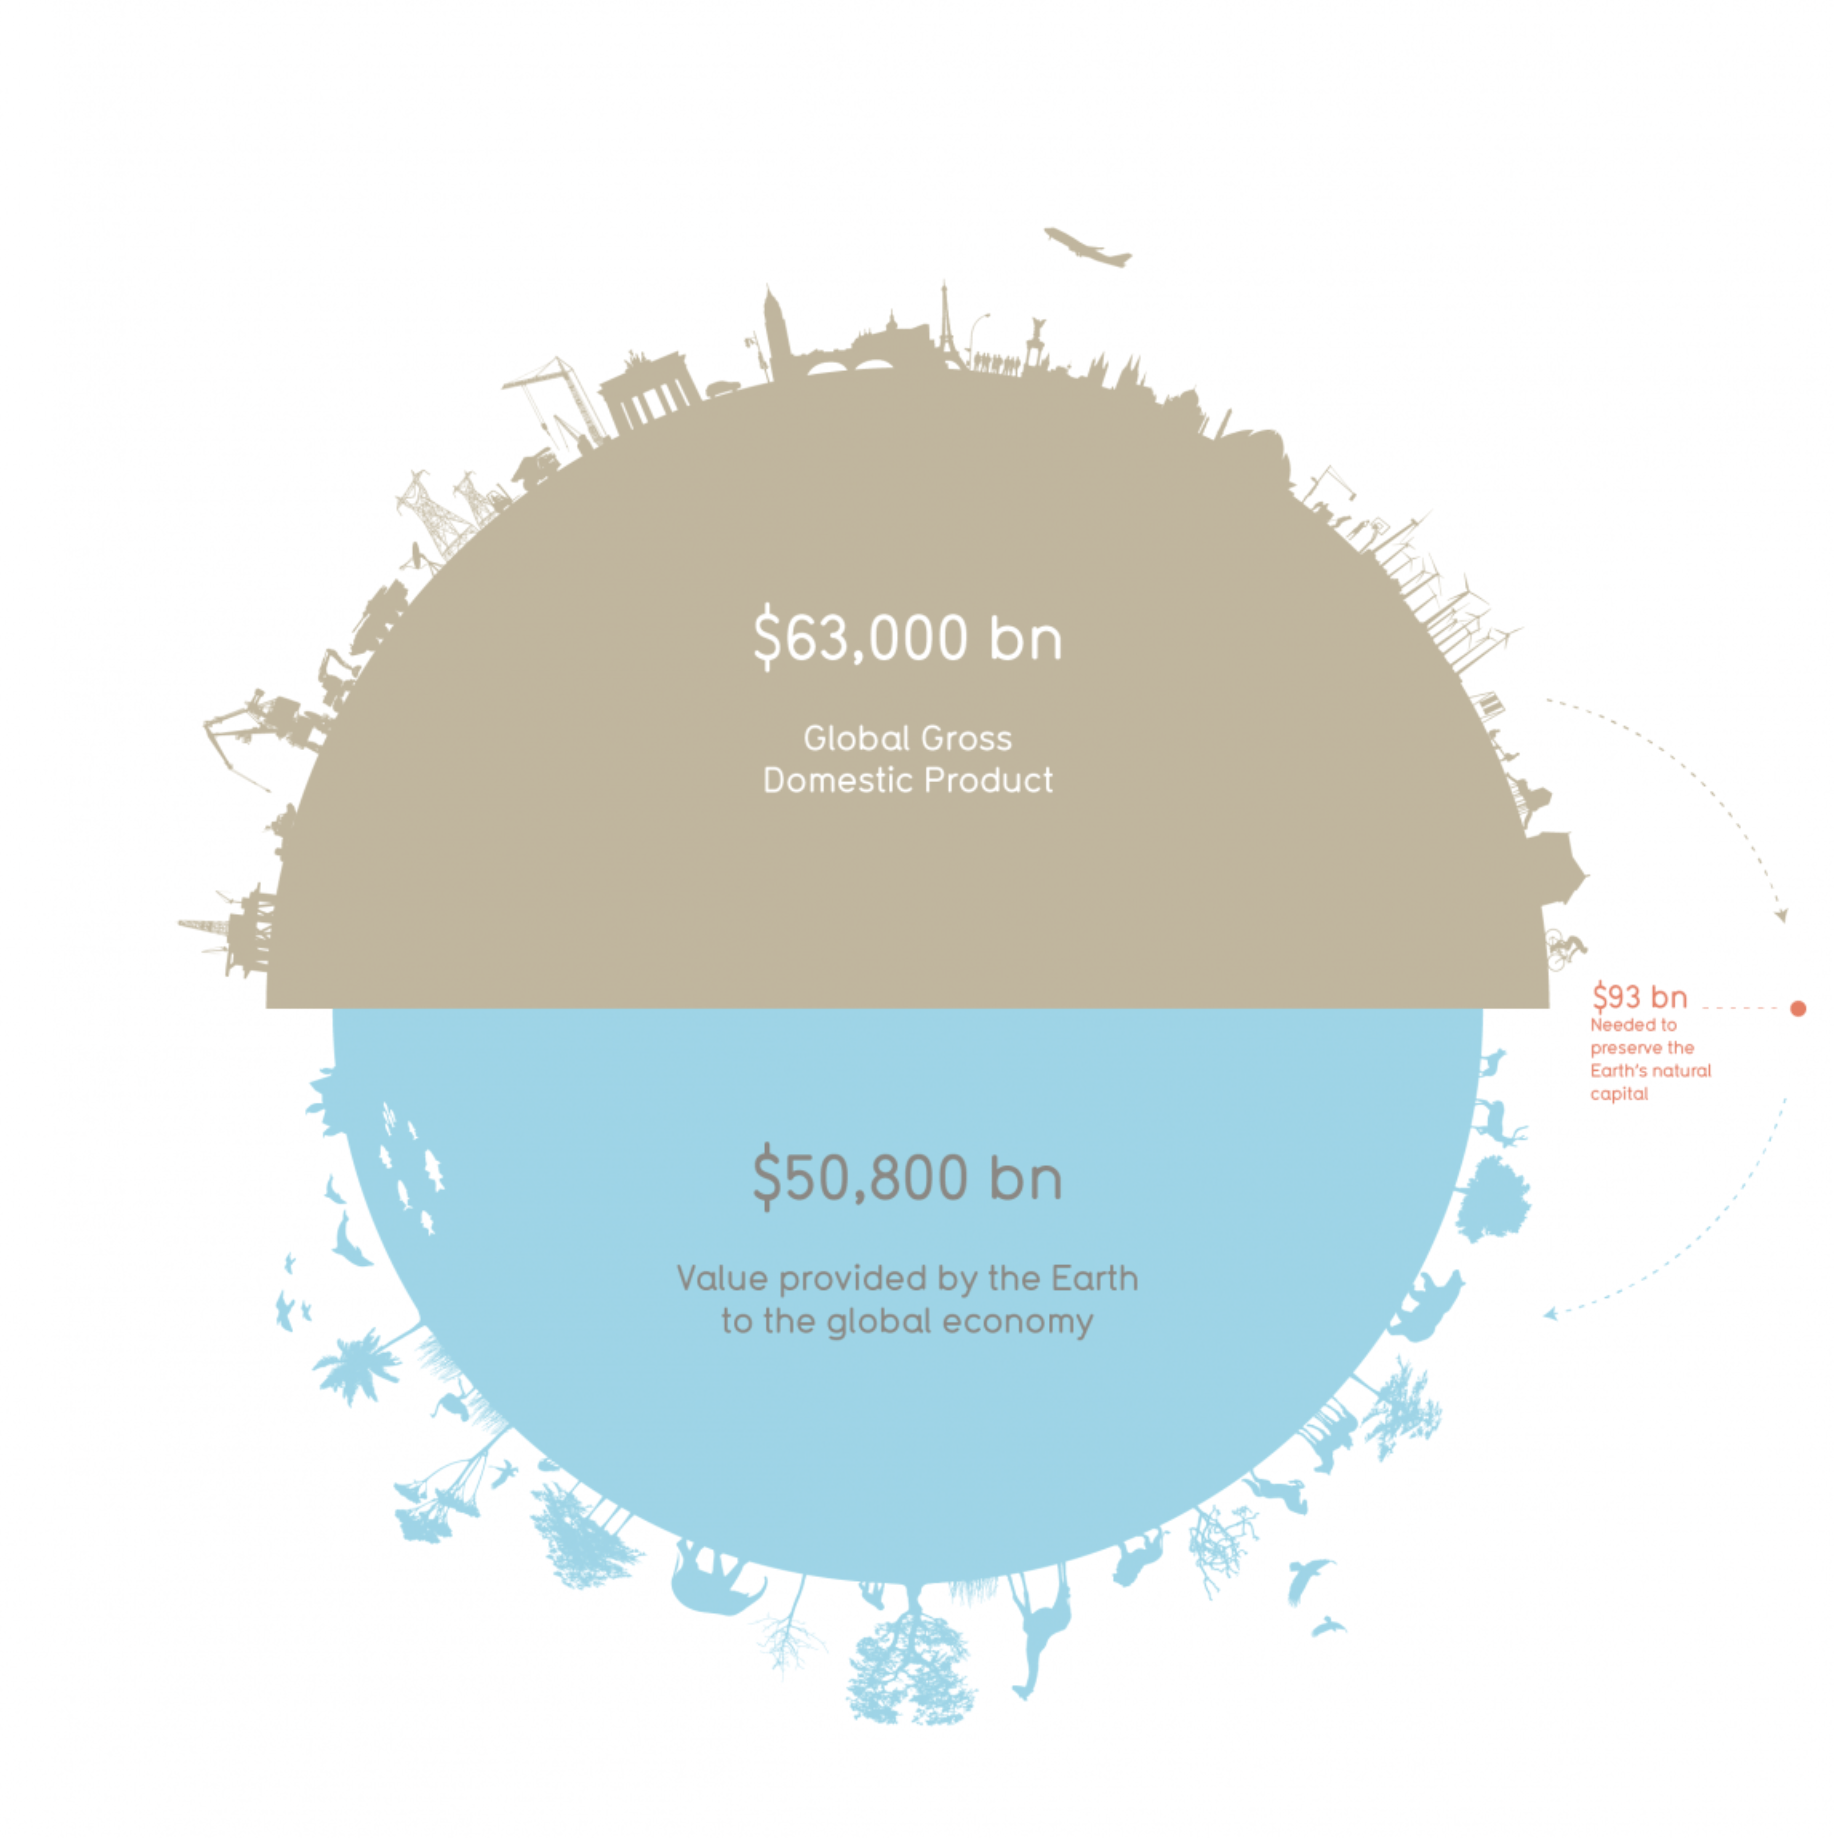
A Proportional Area Chart (Half Circle) is a variation of Proportional Area Chart (Circle), where one measure is represented as a circle. Representing two data sets in one circle (half circle each), this visualisation is useful for comparing two data sets (I,II in the input type) within one category and as well between different categories (A,B,C in the input type). Two data sets are often two different years or two contrary concepts (A/A’, male/female, etc.) It is also possible to use it for only one category (one circle).