Venn Diagram
Also called: set diagram
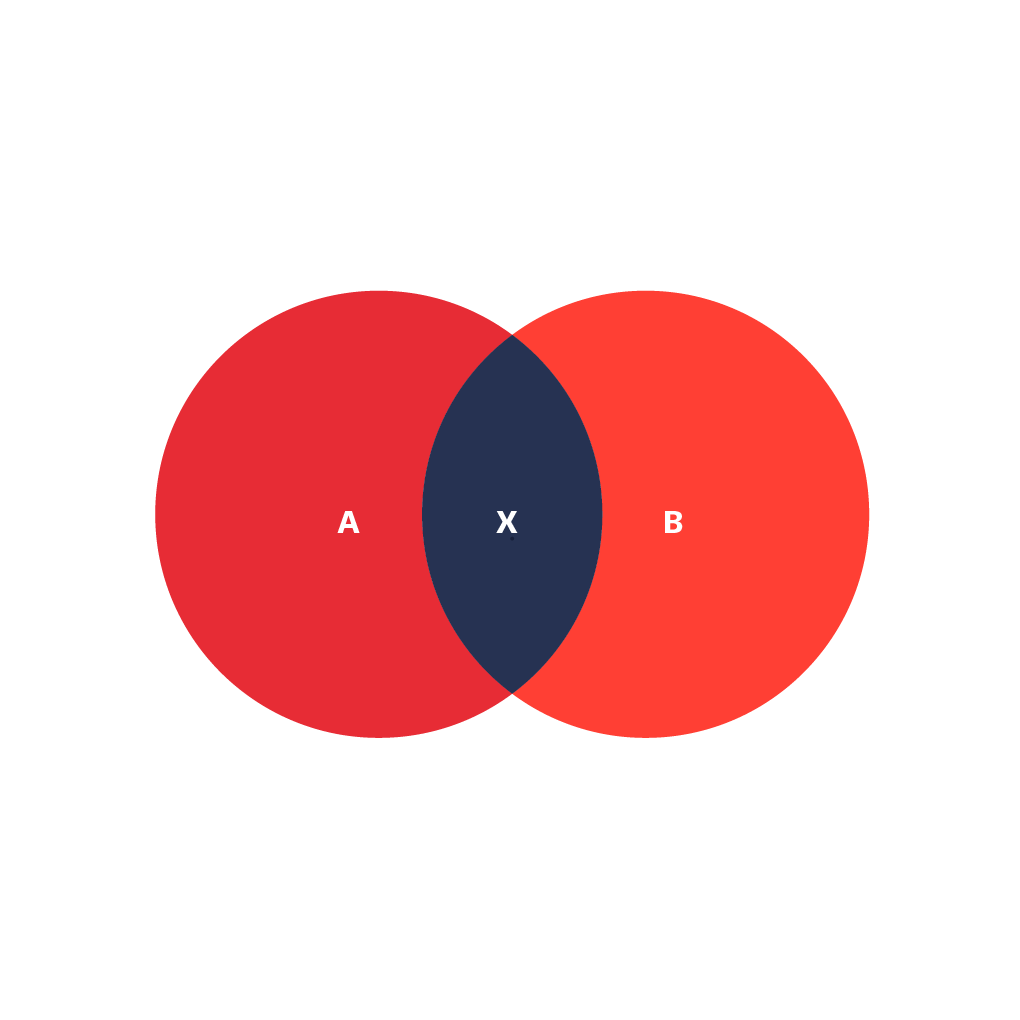
A Venn diagram or set diagram is a diagram that shows all possible logical relations between a finite collection of sets. Venn diagrams were conceived around 1880 by John Venn. They are used to teach elementary set theory, as well as illustrate simple set relationships in probability, logic, statistics, linguistics and computer science.