Data Viz Inspiration
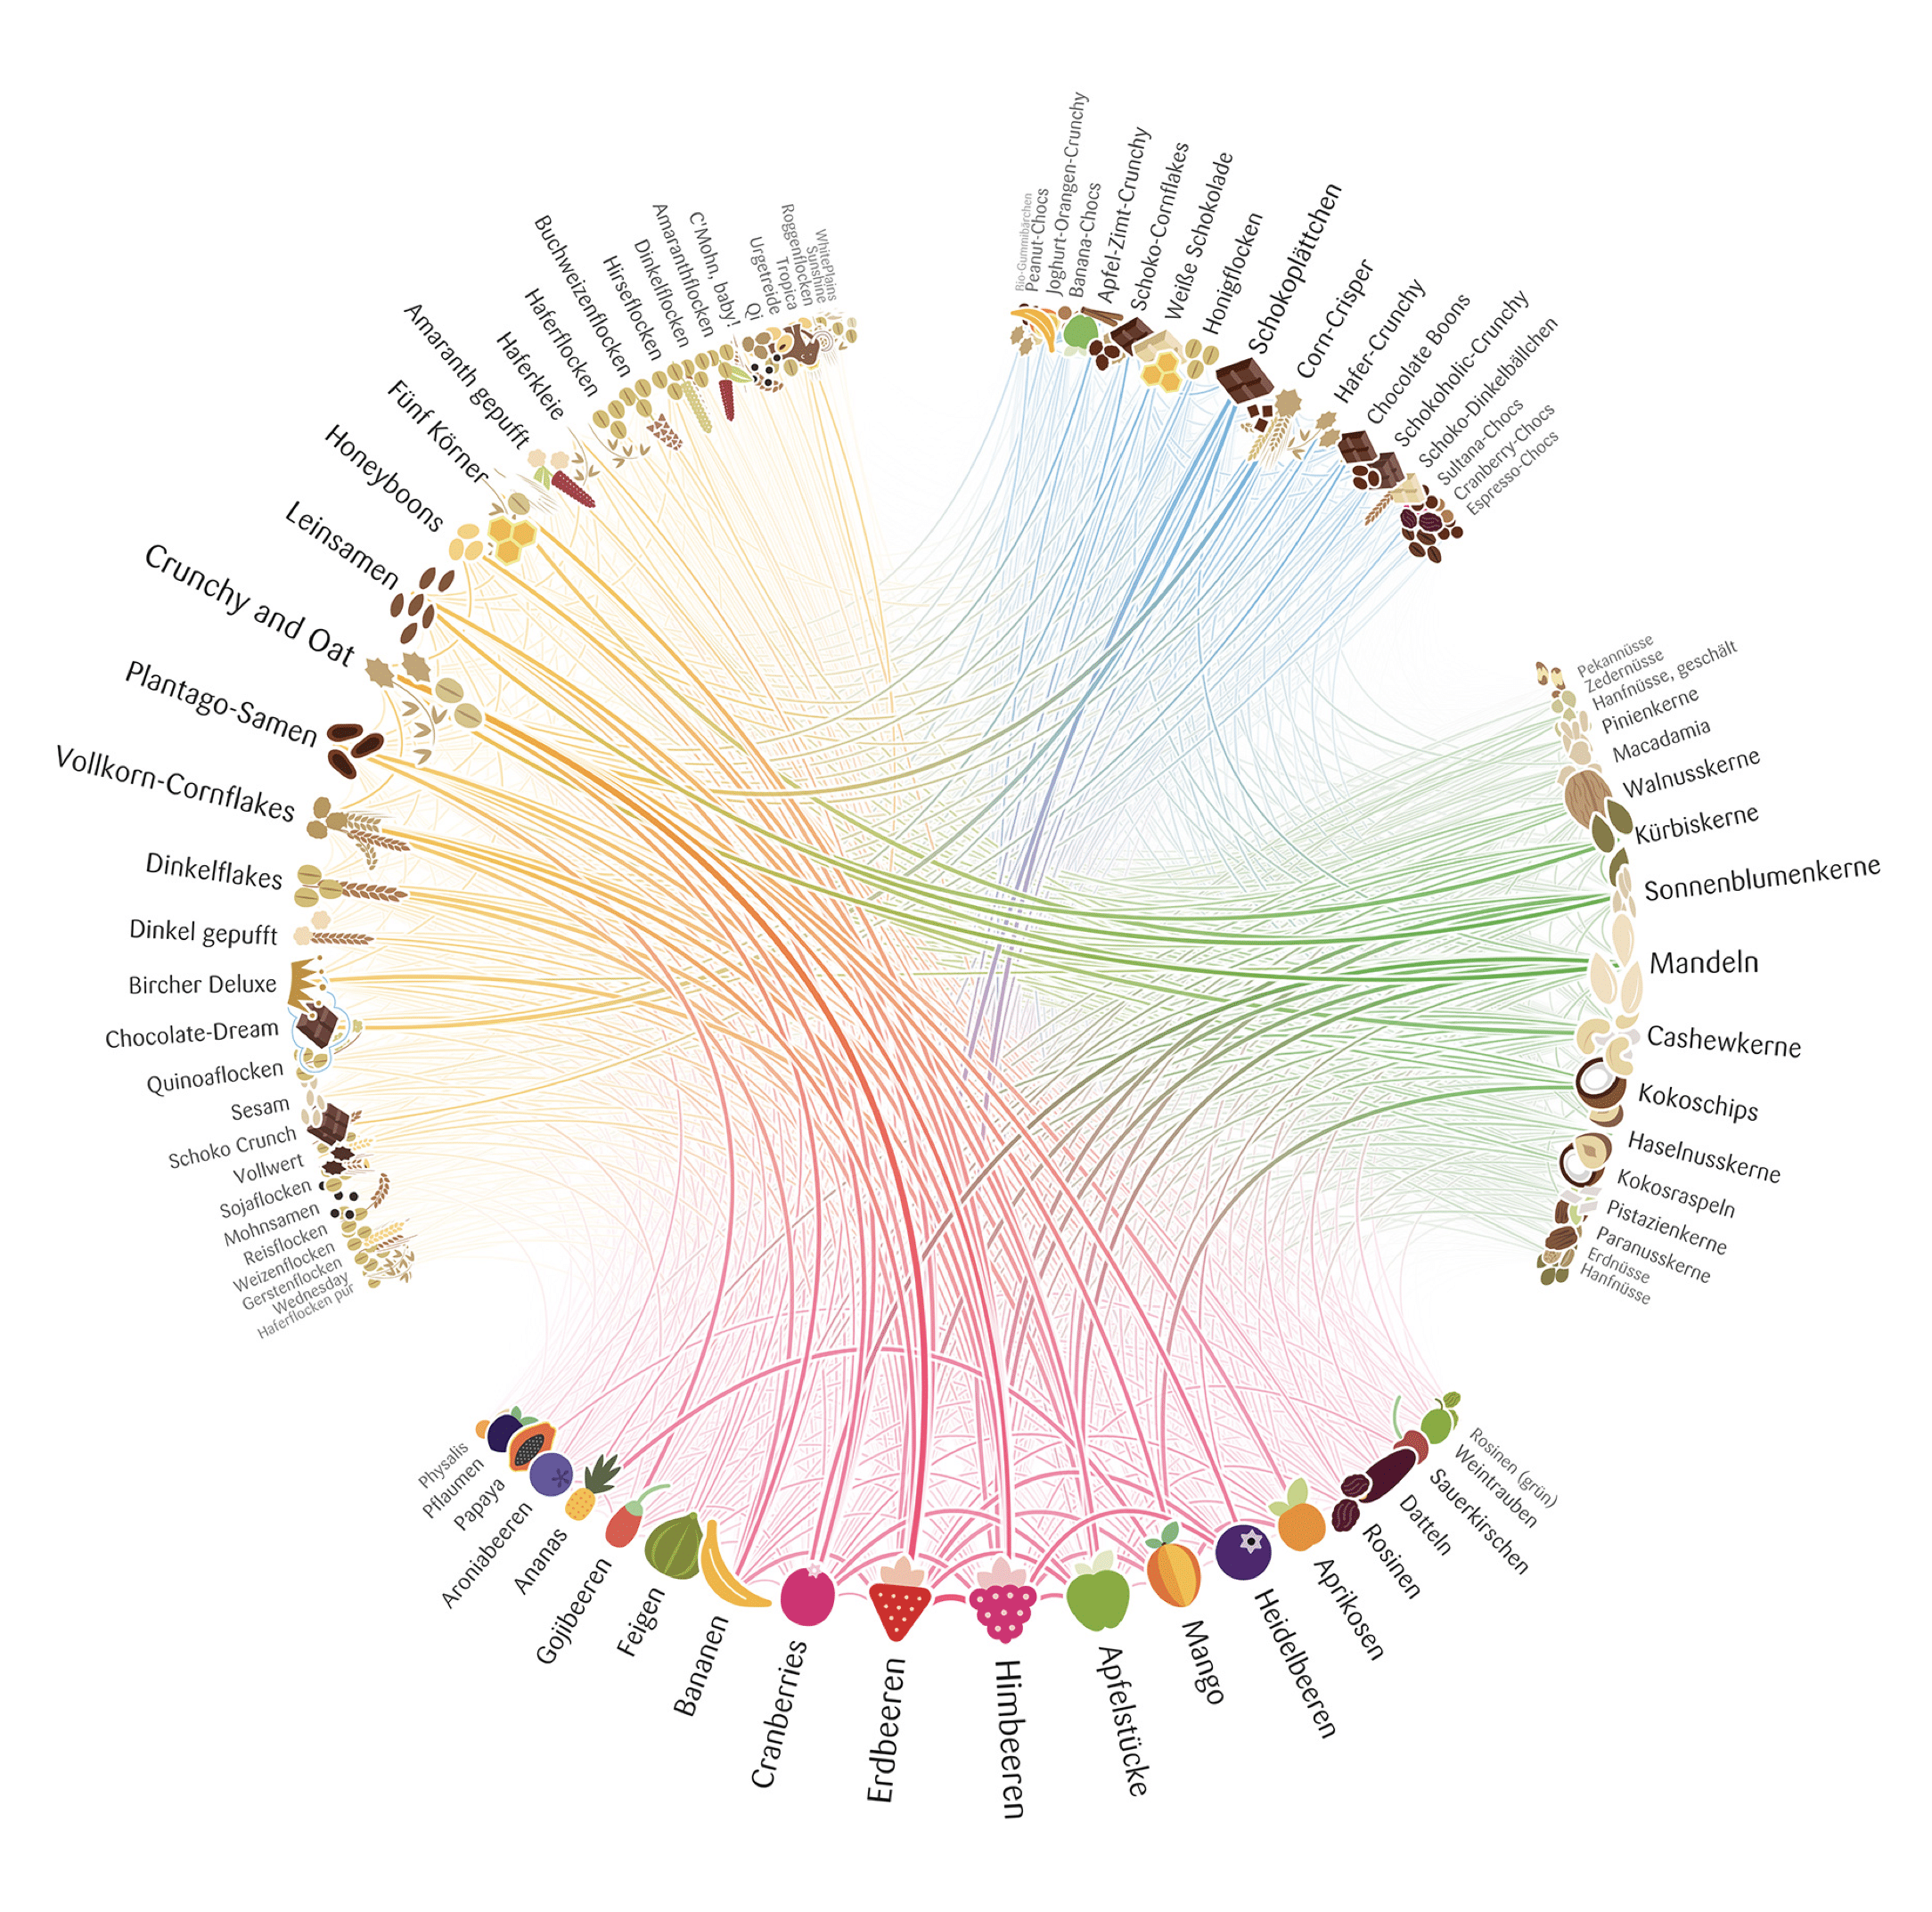
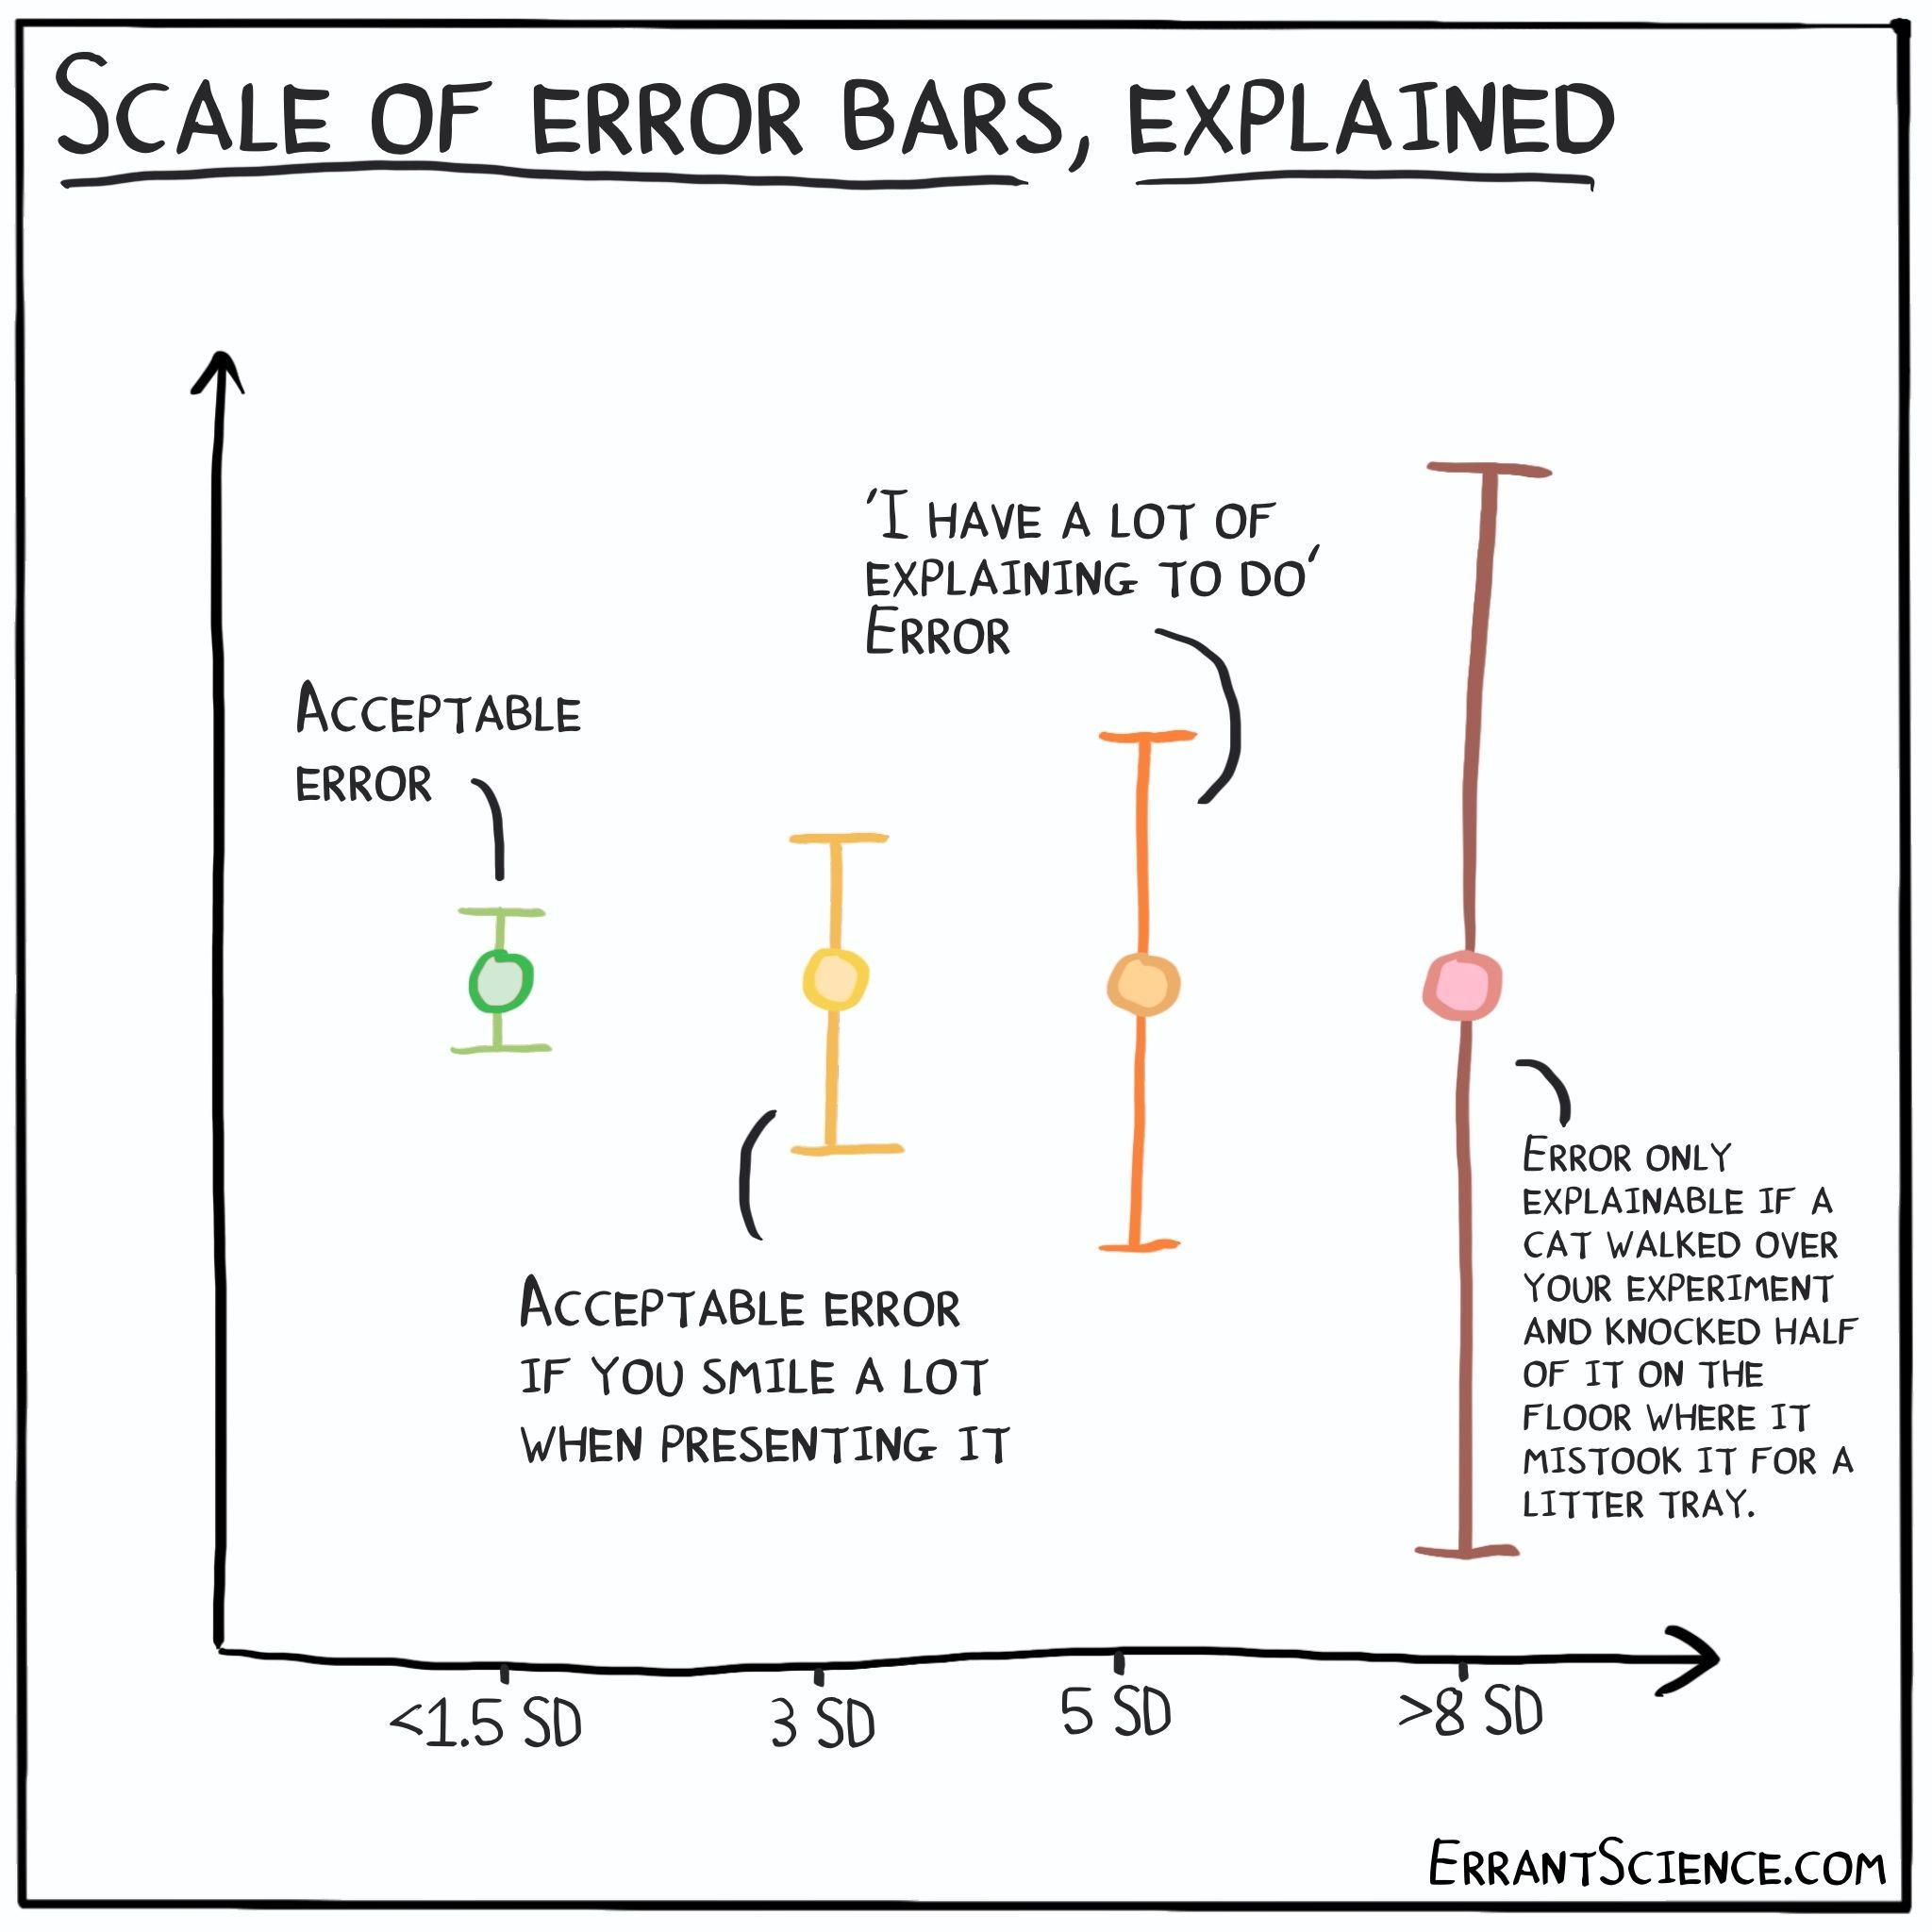
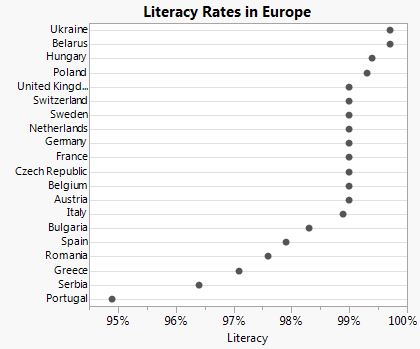
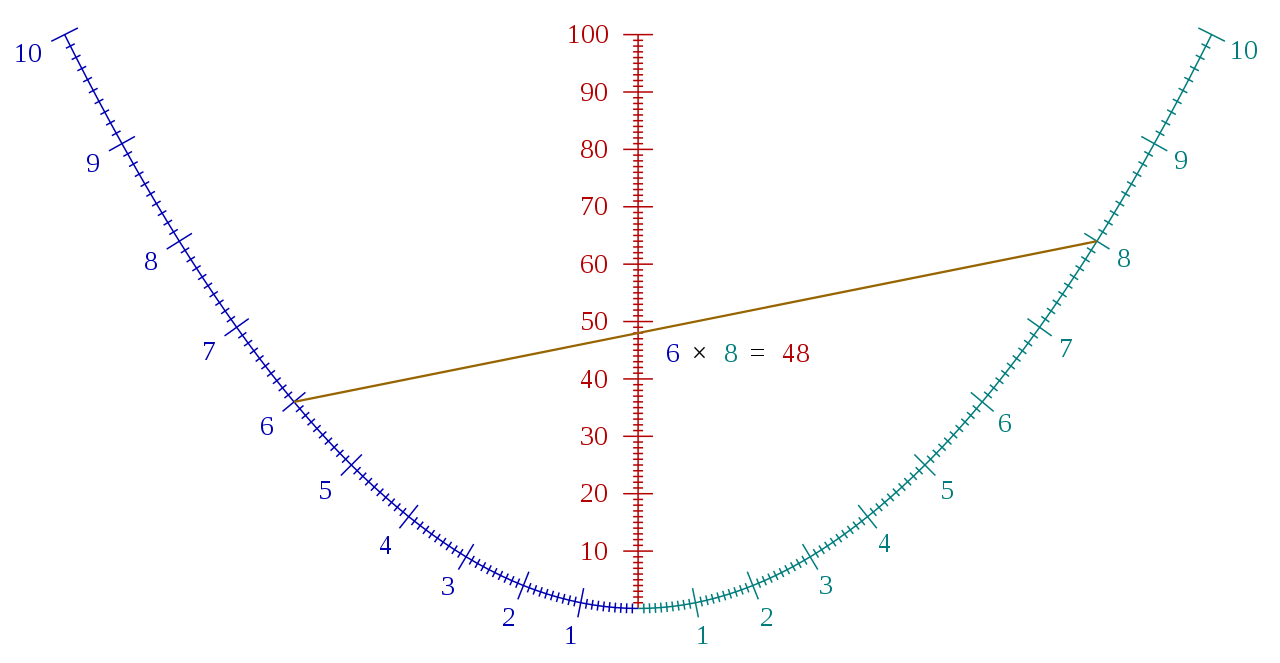
Find random examples among 1500+ creative data visualizations from talented people around the world in one place to get you inspired.
Find random examples among 1500+ creative data visualizations from talented people around the world in one place to get you inspired.