Matrix Diagram
Also called: Corellogram, Correlation Matrix
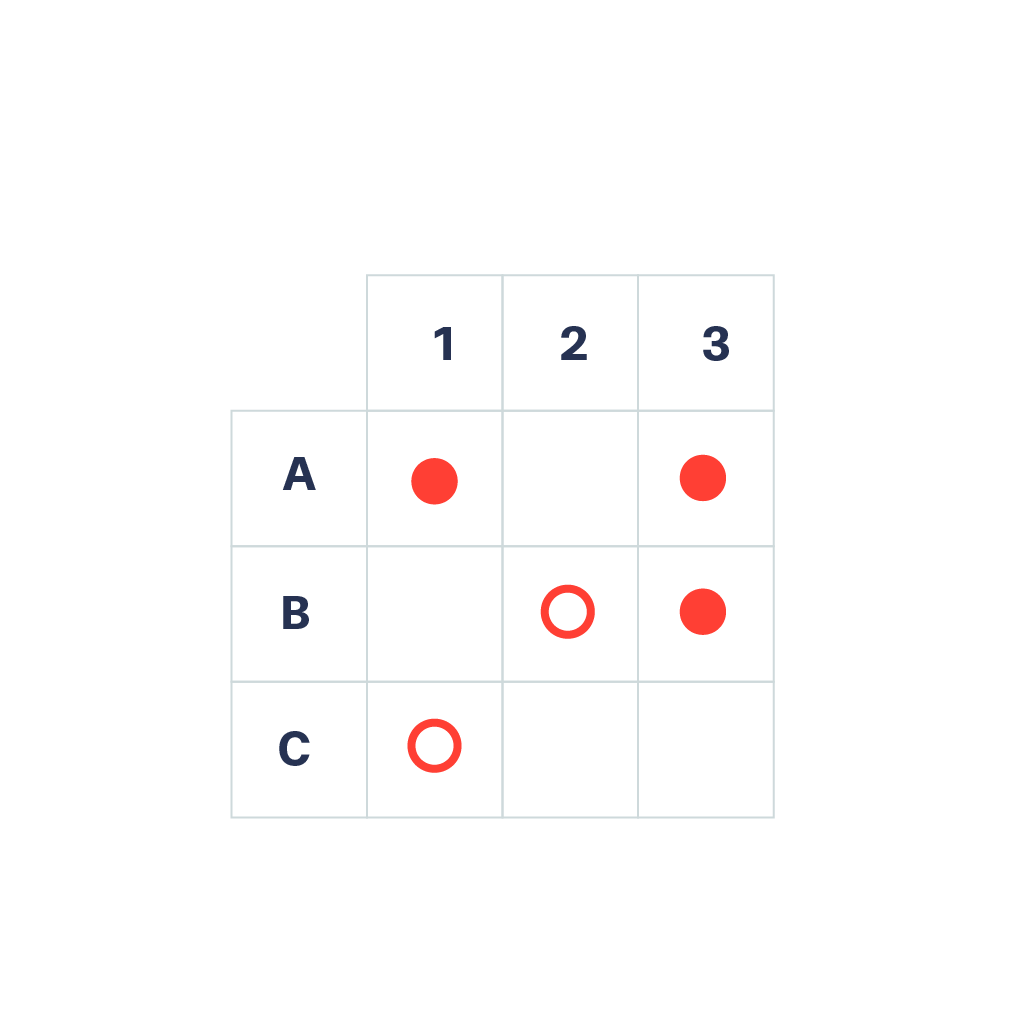
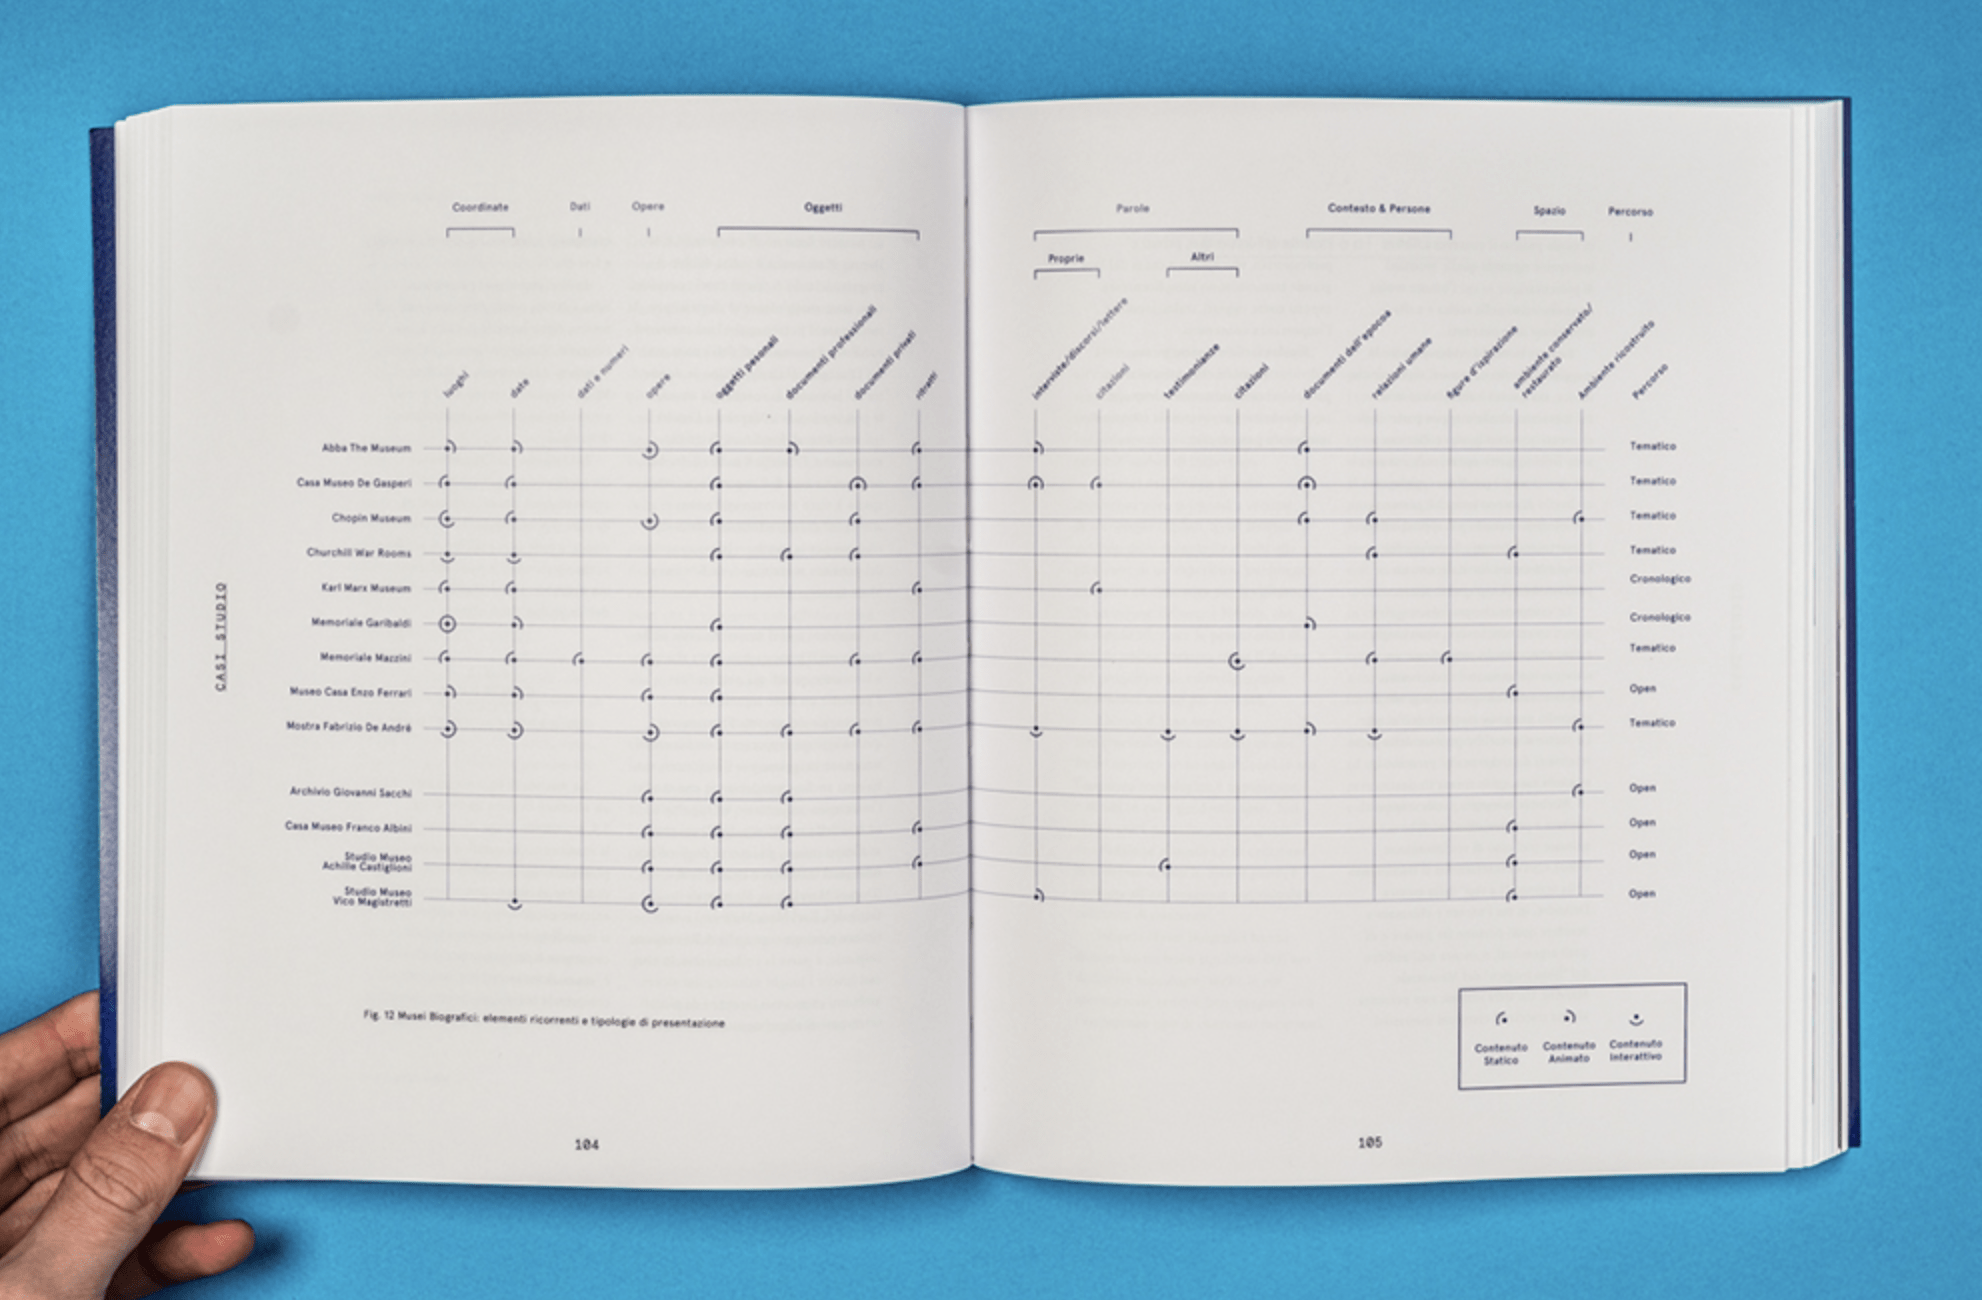
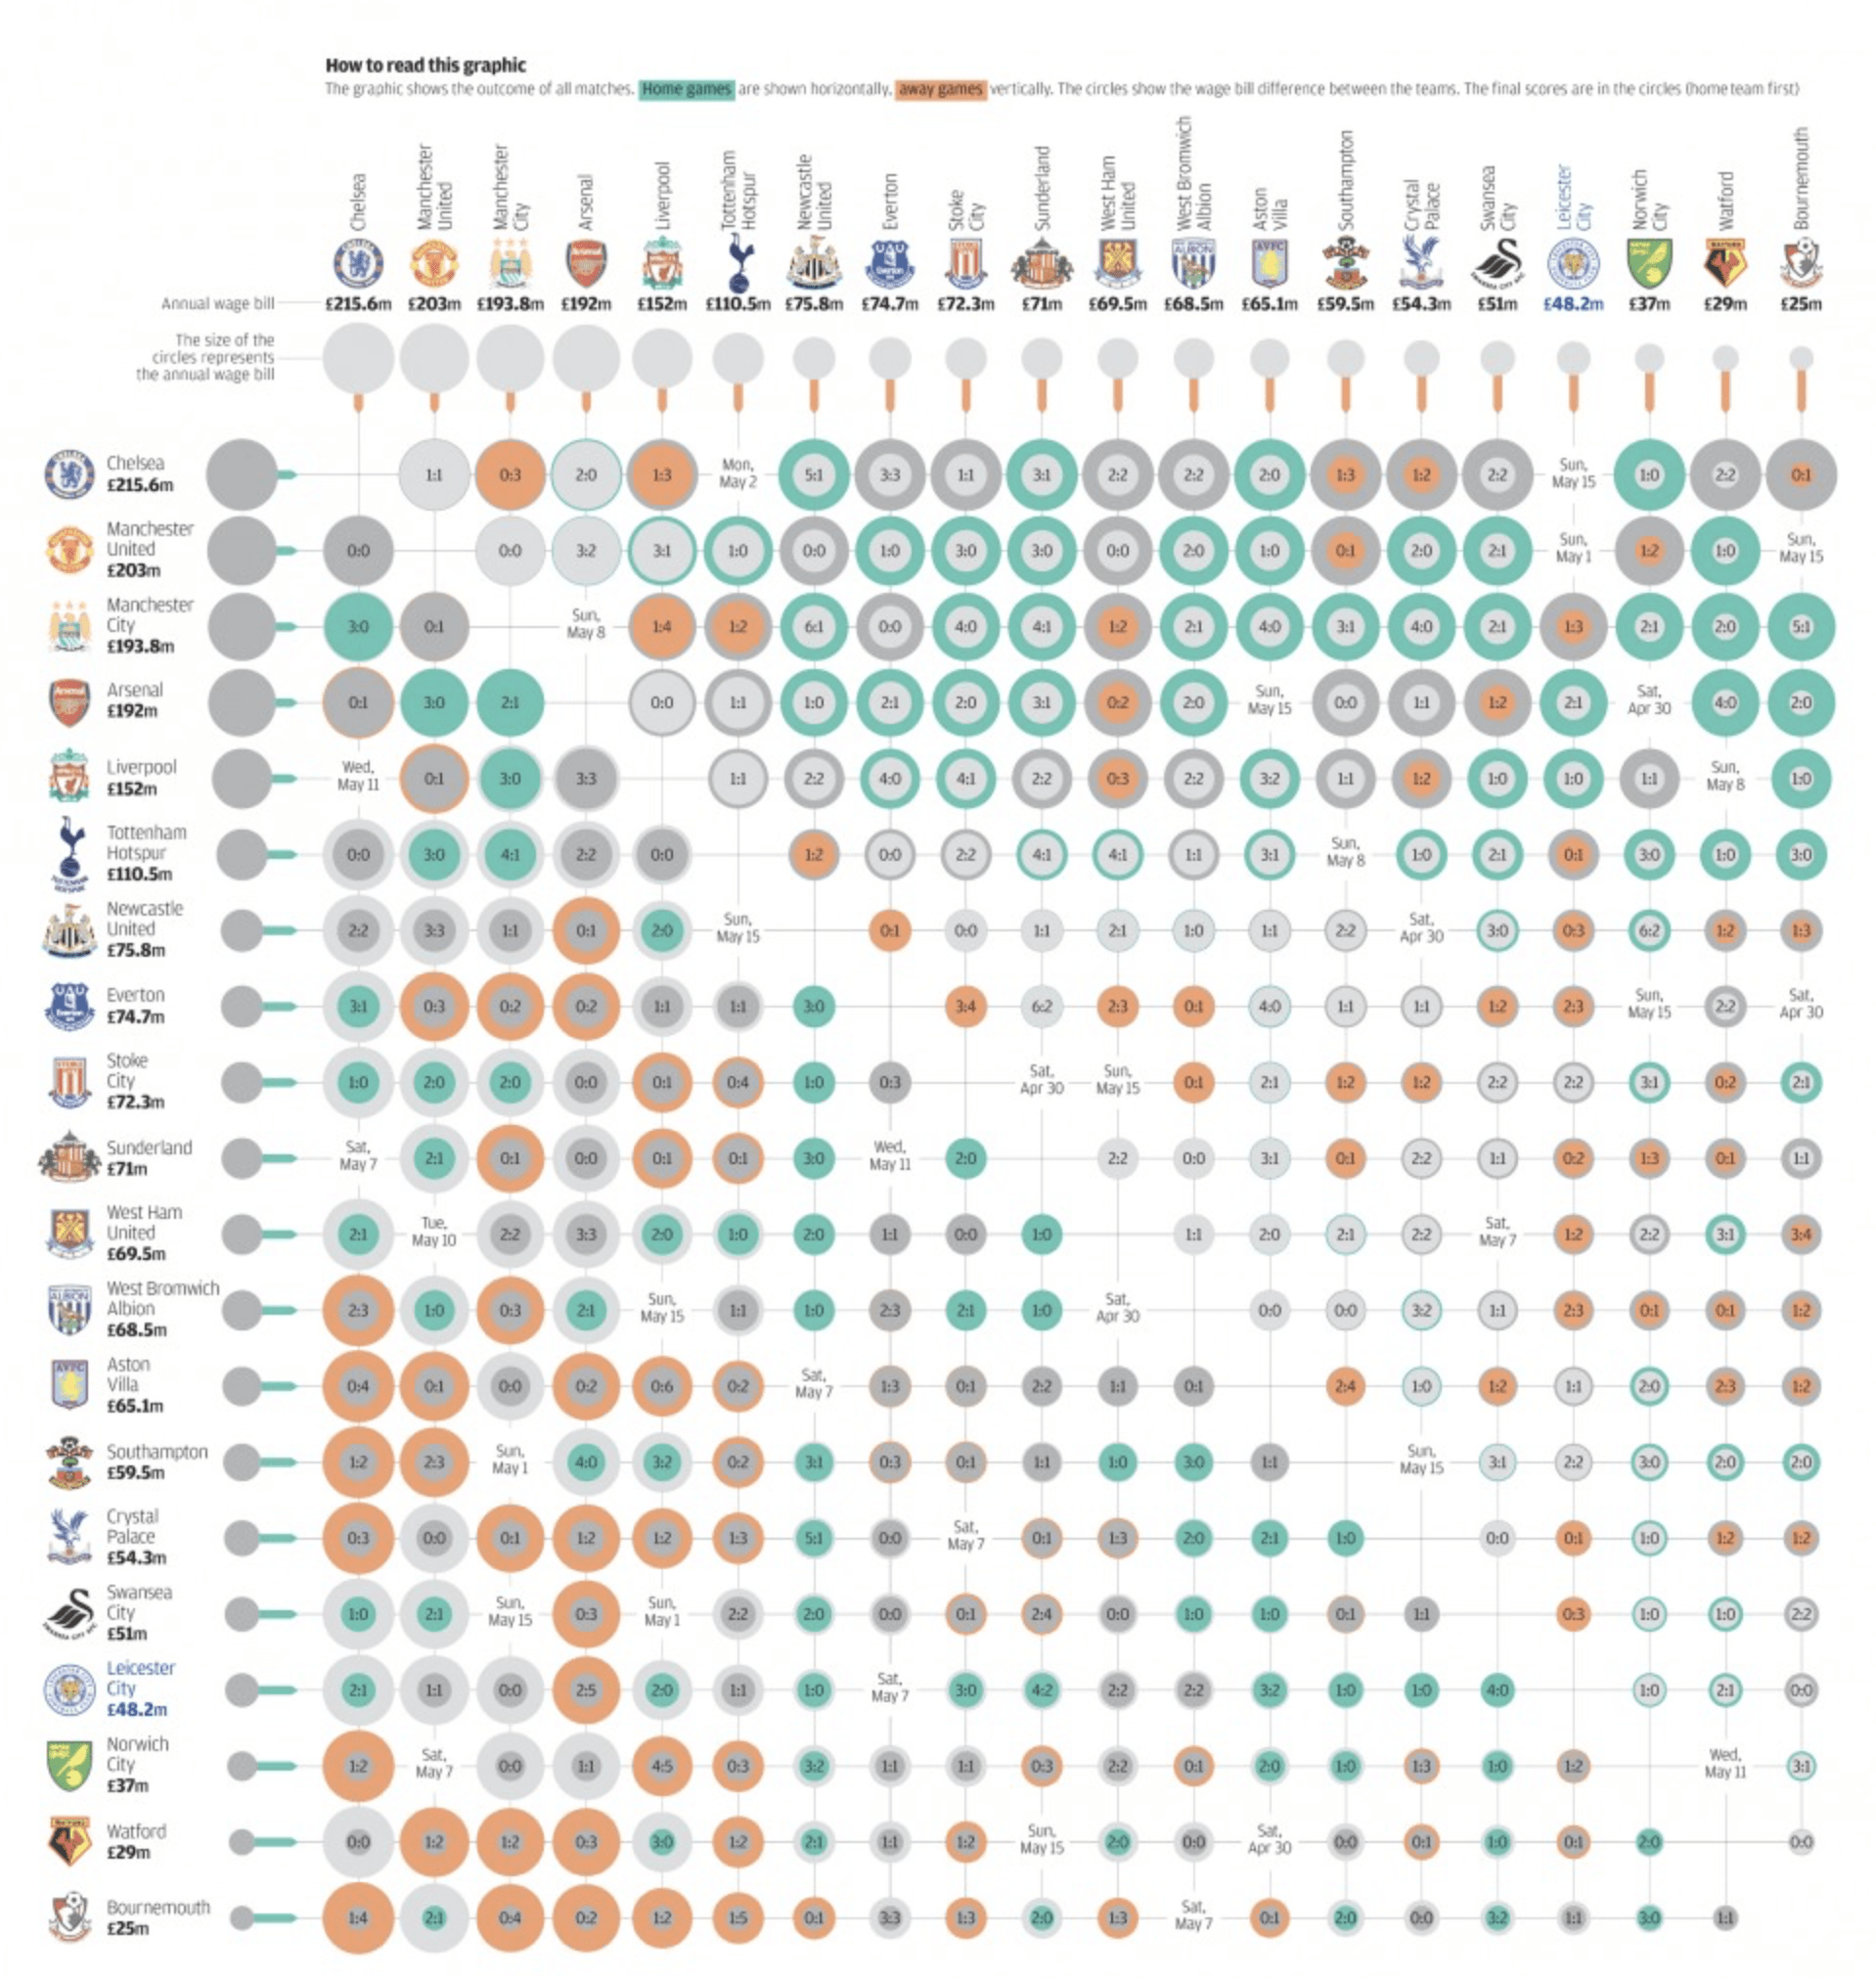
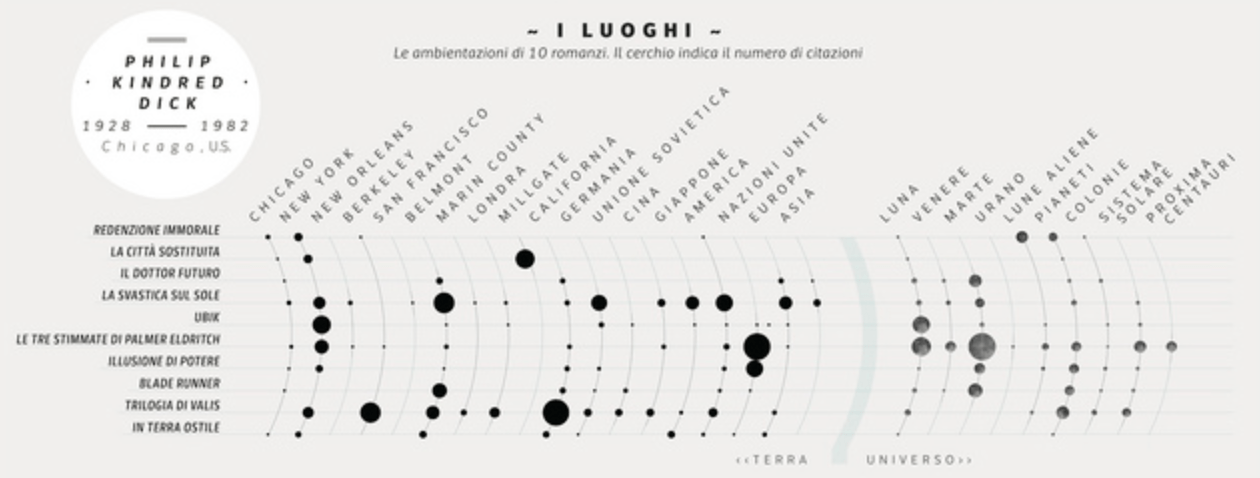
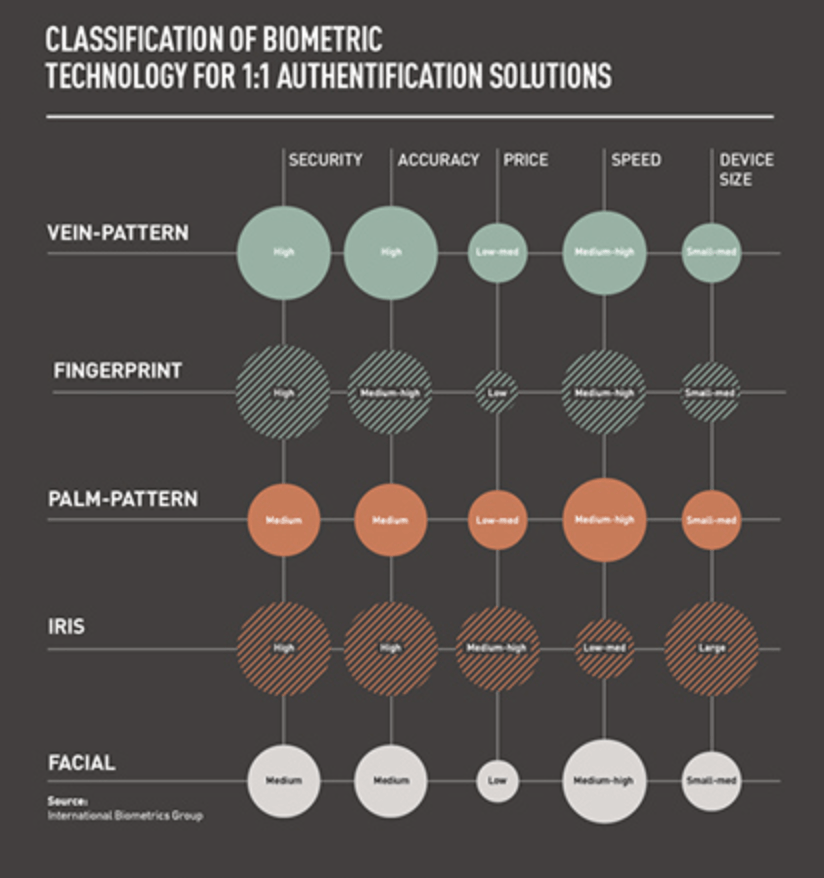
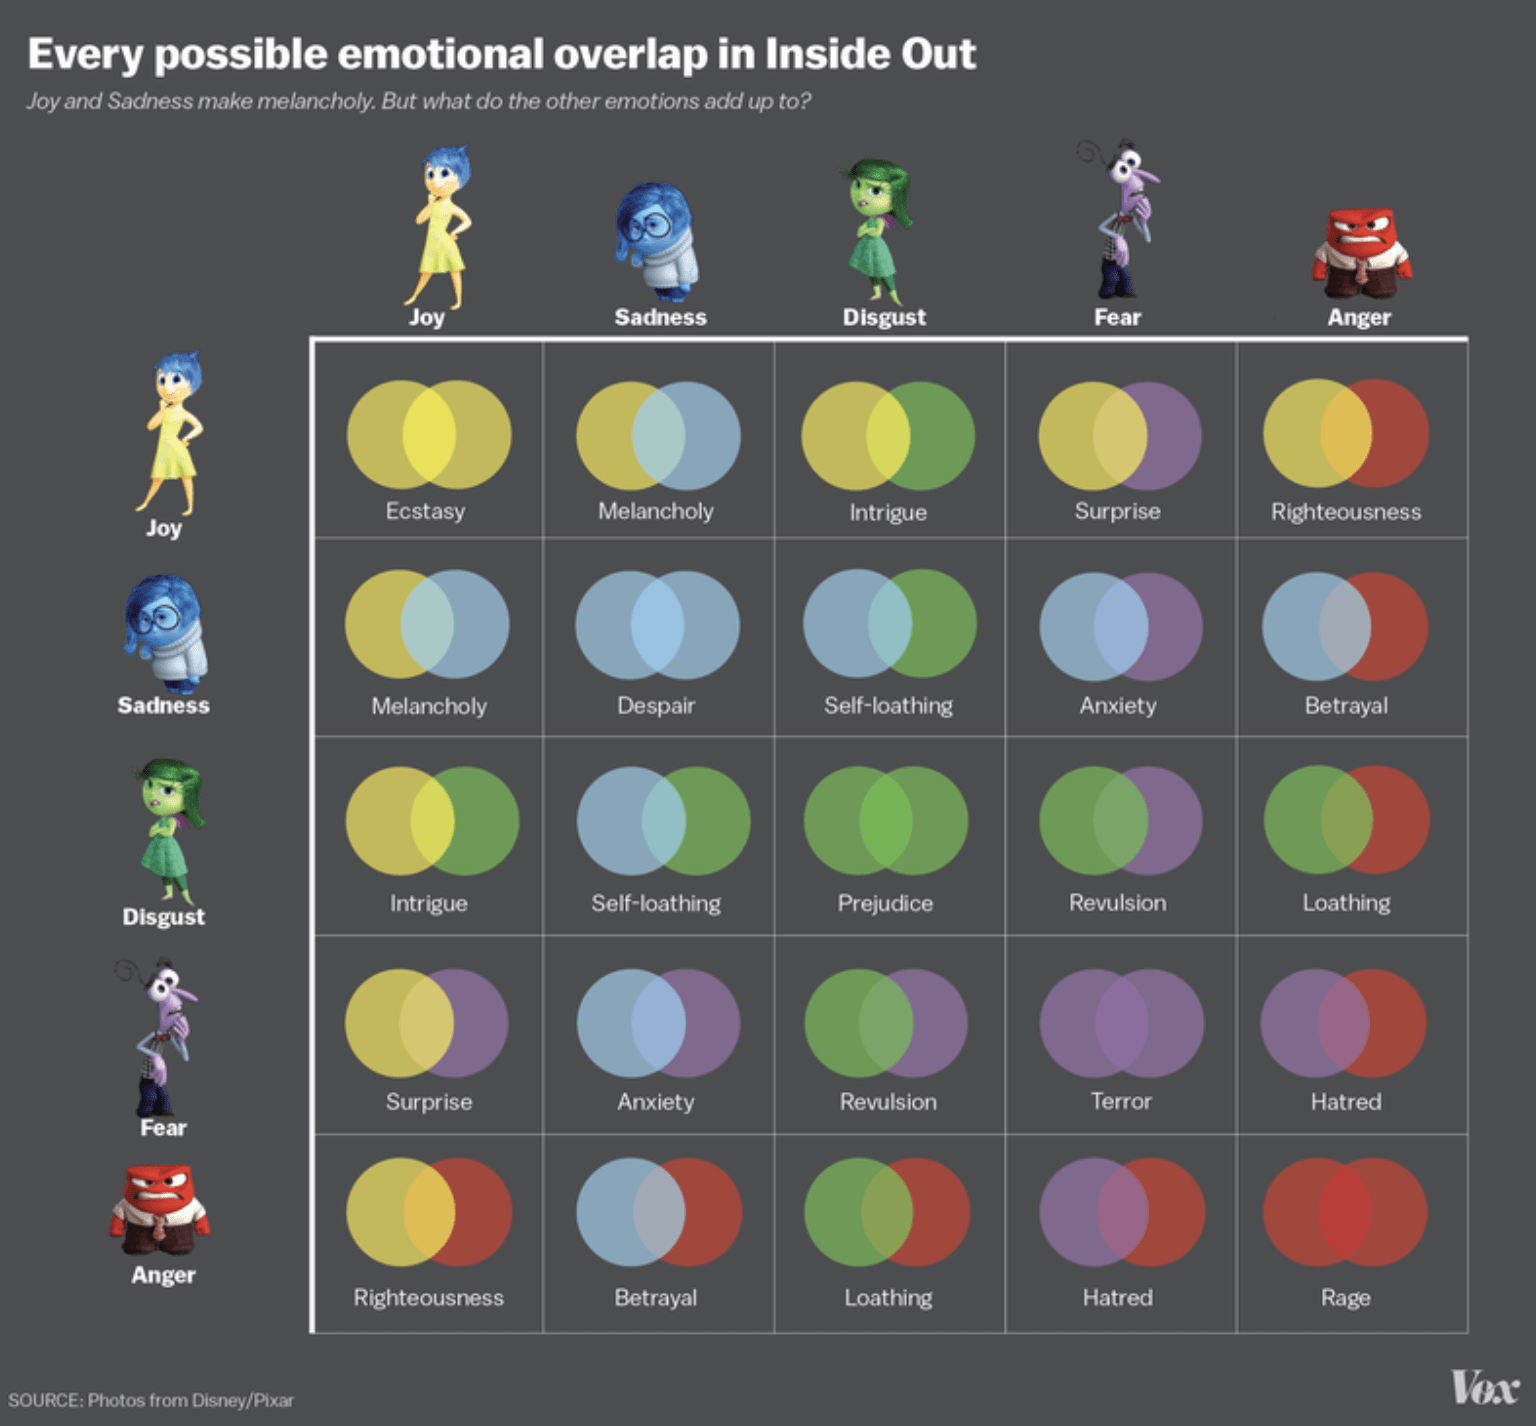
The Matrix Diagram shows the relationship between items. At each intersection a relationship is either absent or present. It then gives information about the relationship, such as its strength, the roles played by various individuals or measurements. It can be shaped differently depending on how many groups must be compared. Six differently shaped matrices are possible: L, T, Y, X, C, R and roof-shaped.