Fan Chart (Time Series)
Also called: fan graph
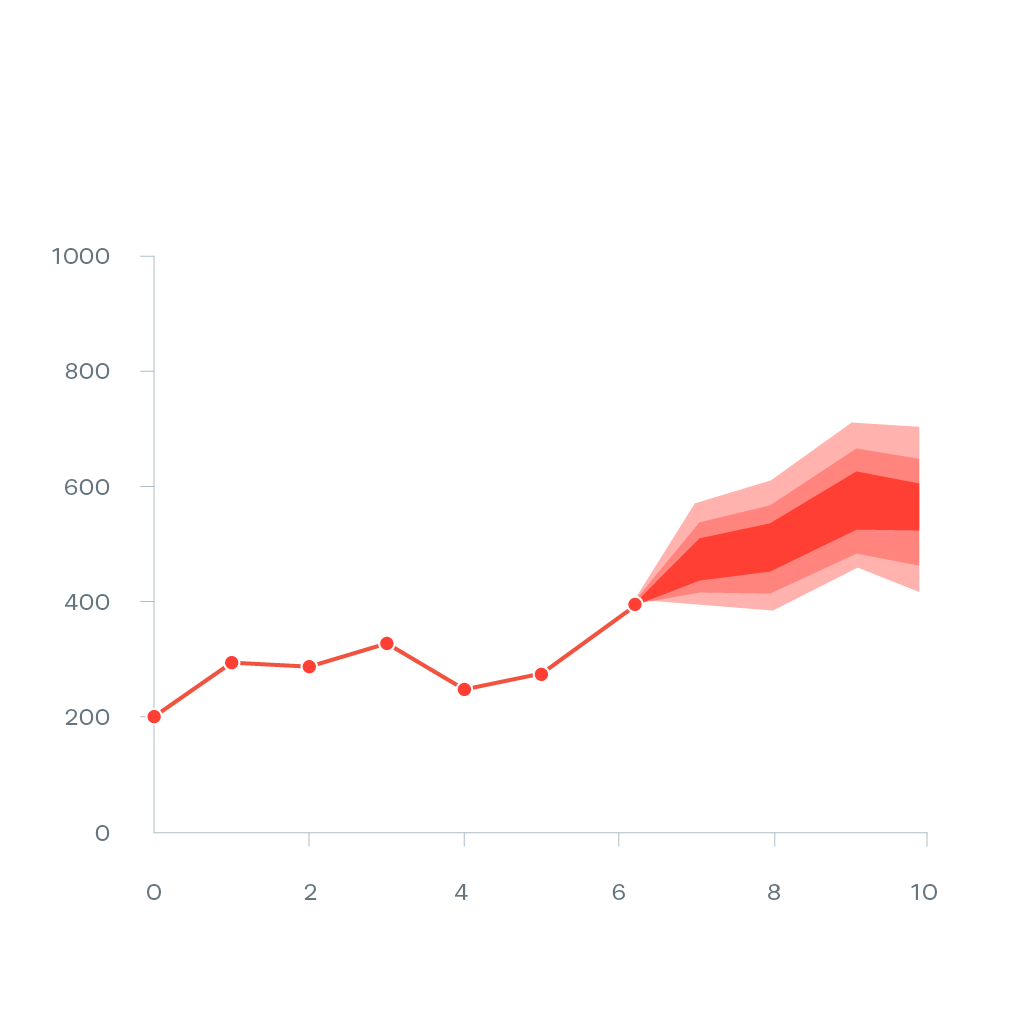
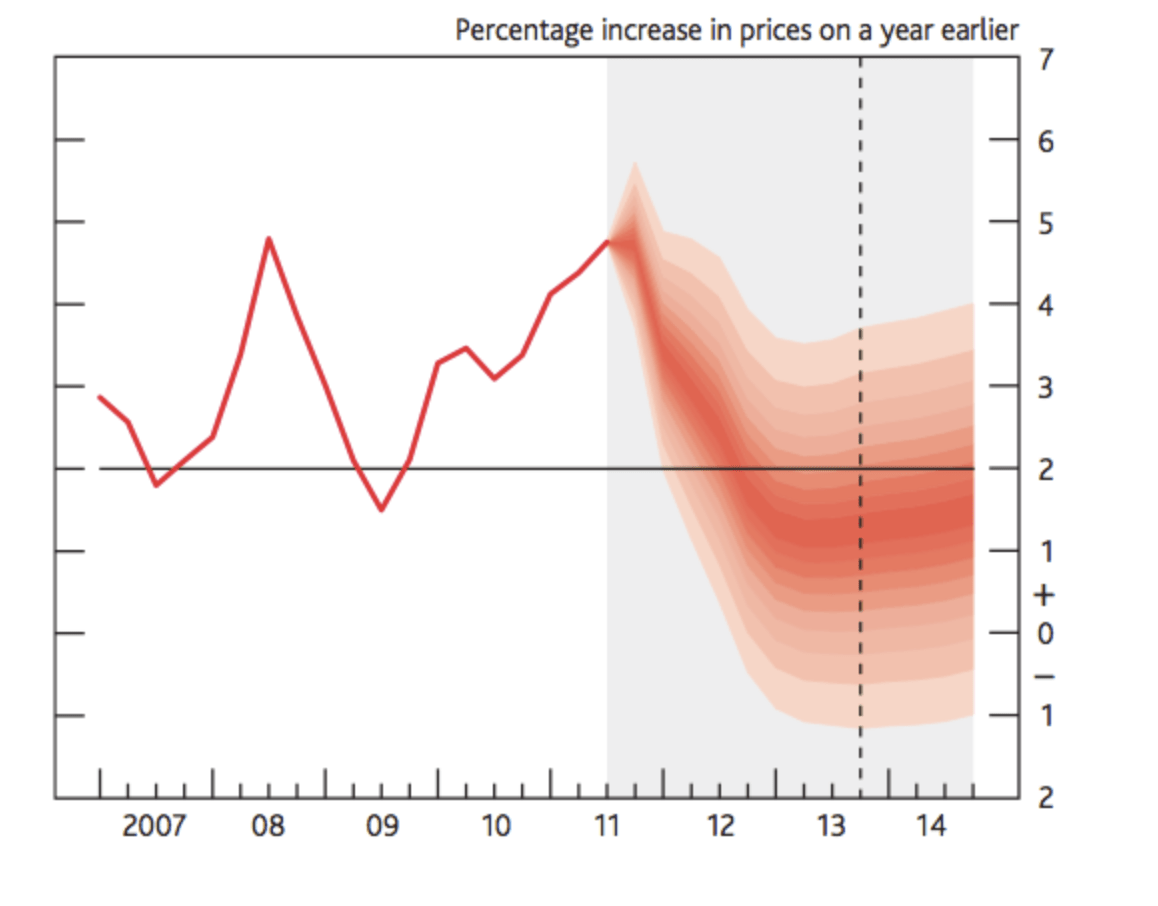
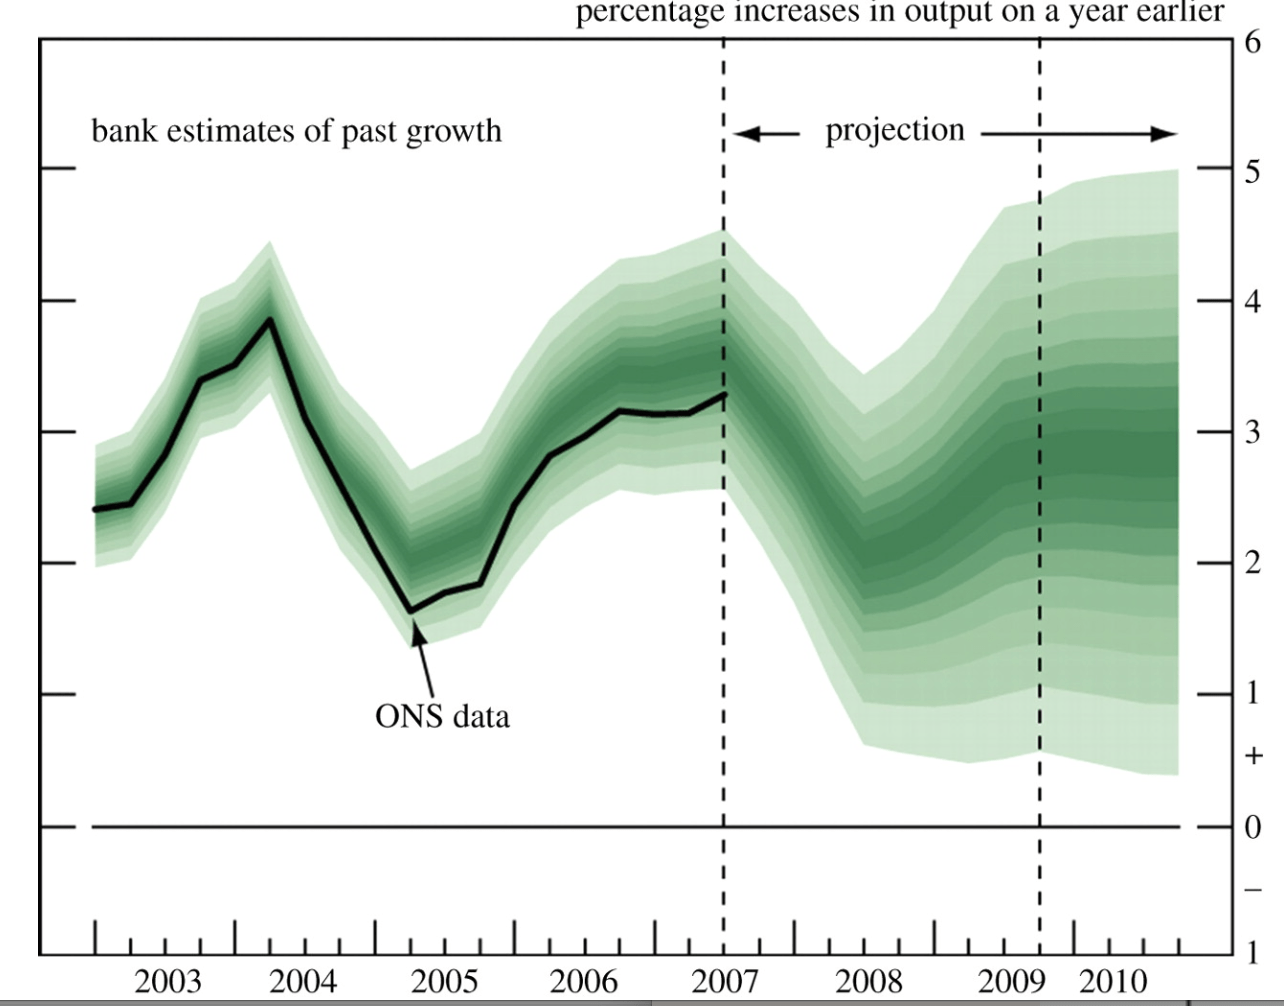
A fan chart is a chart that joins a line graph for observed past data, and a range area chart for future predictions.
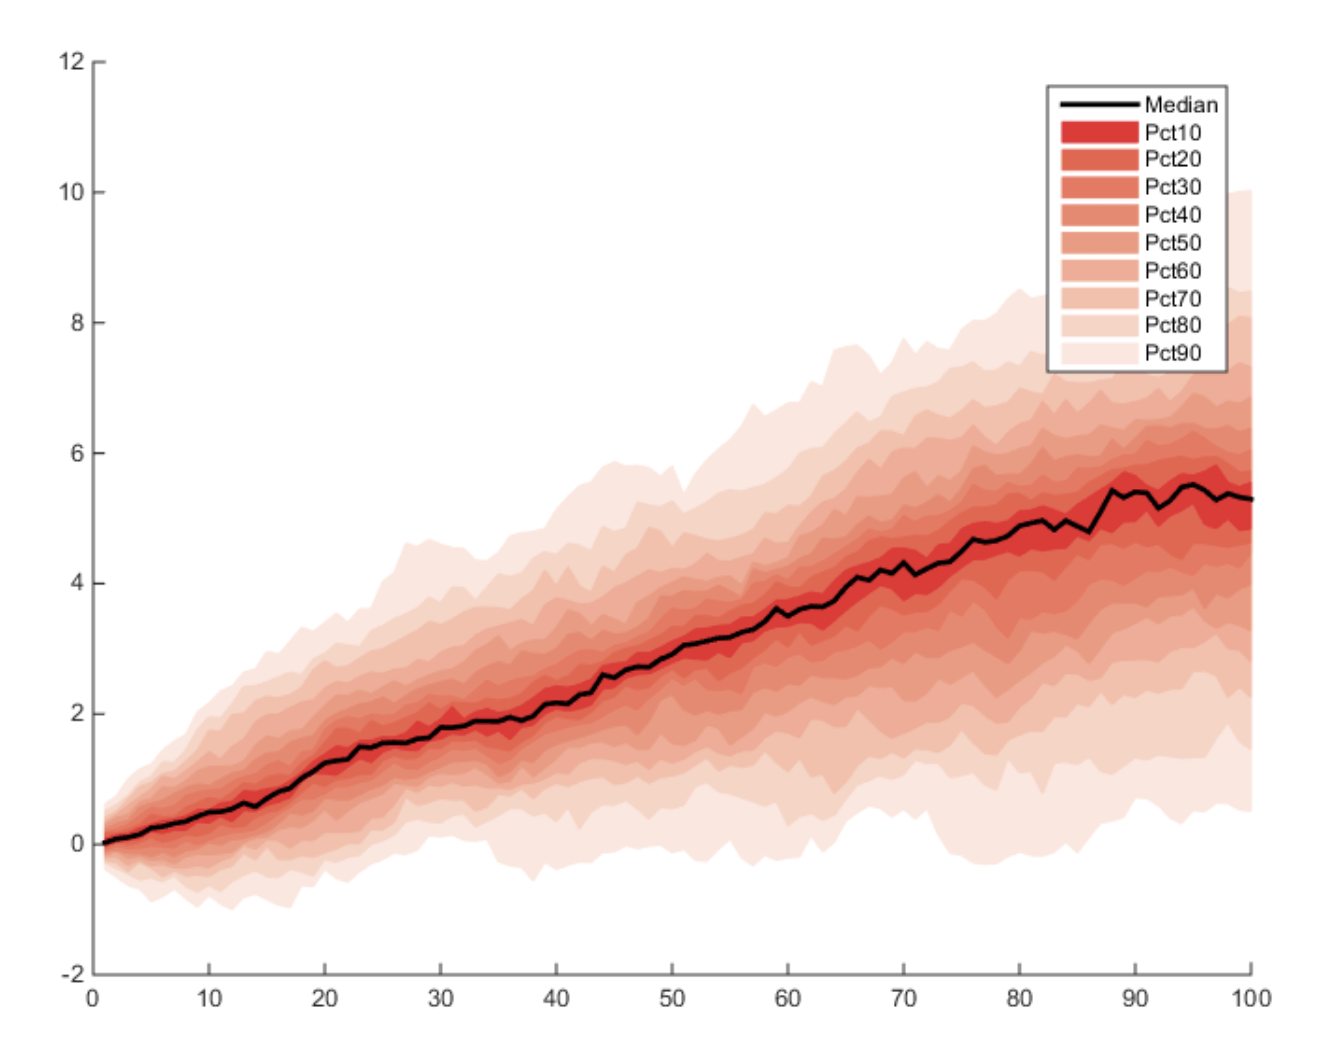
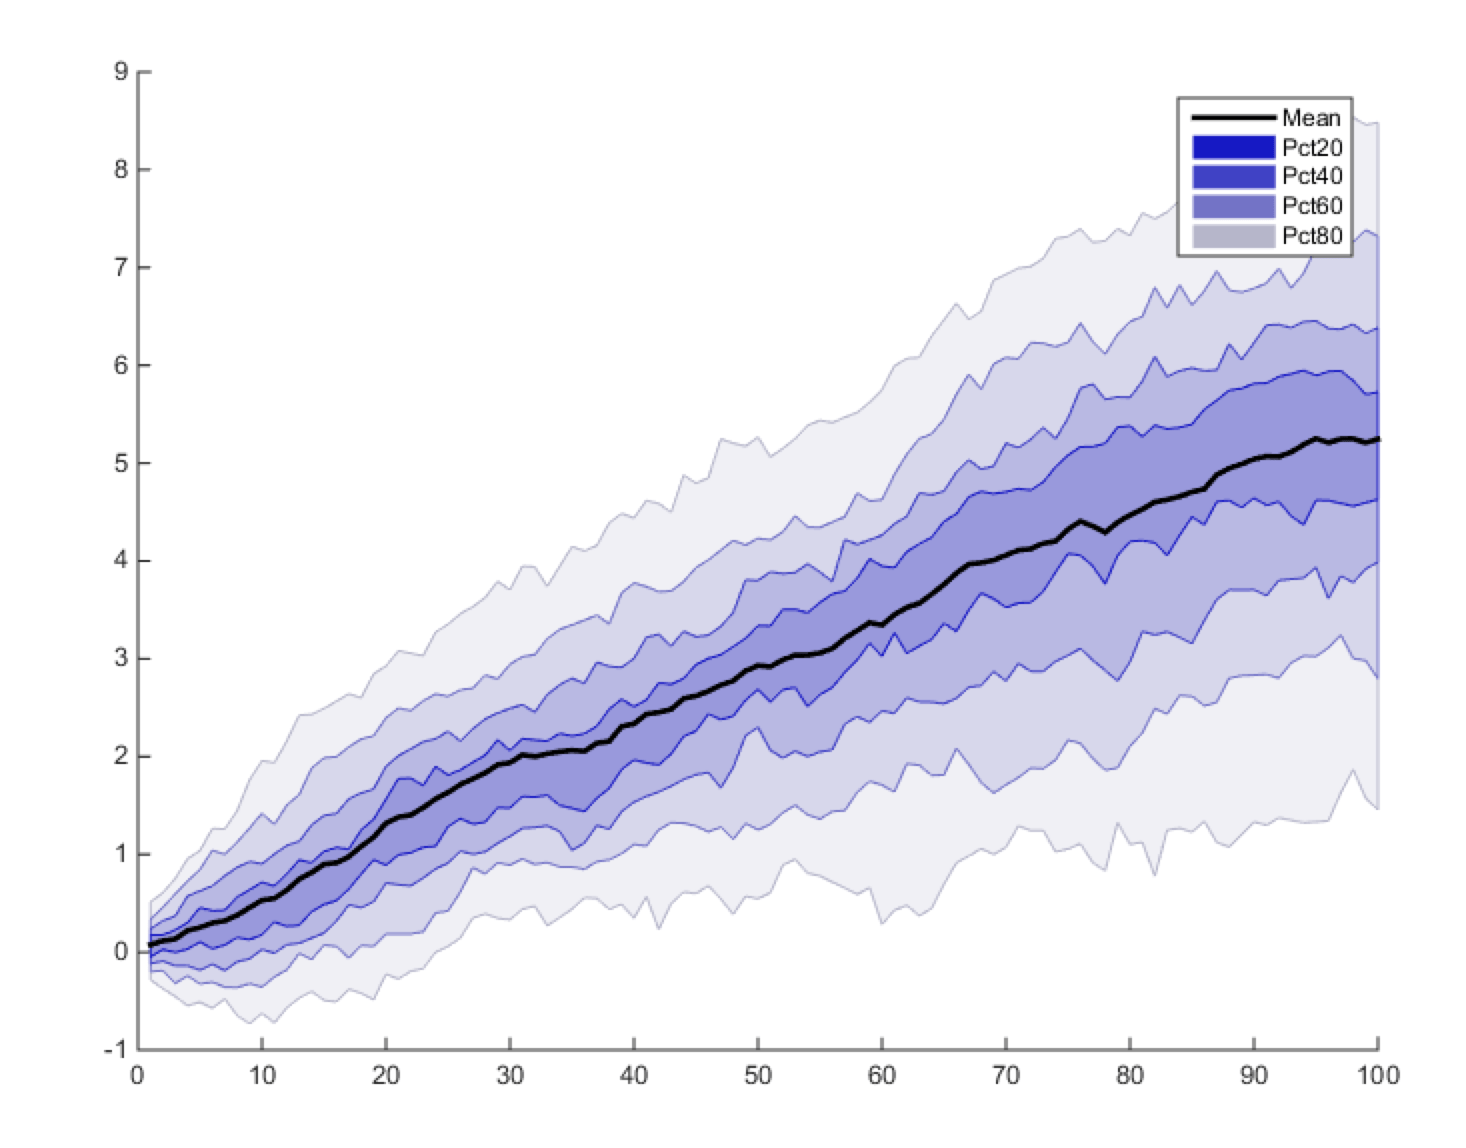
Predictions are shown as ranges for possible values of future data together with a line showing a central estimate or most likely value for the future outcomes. As predictions become increasingly uncertain the further into the future one goes, these forecast ranges spread out, creating distinctive wedge or “fan” shapes, hence the term. Alternative forms of the chart can also include uncertainty for past data, such as preliminary data that is subject to revision.
Read more about fan charts here