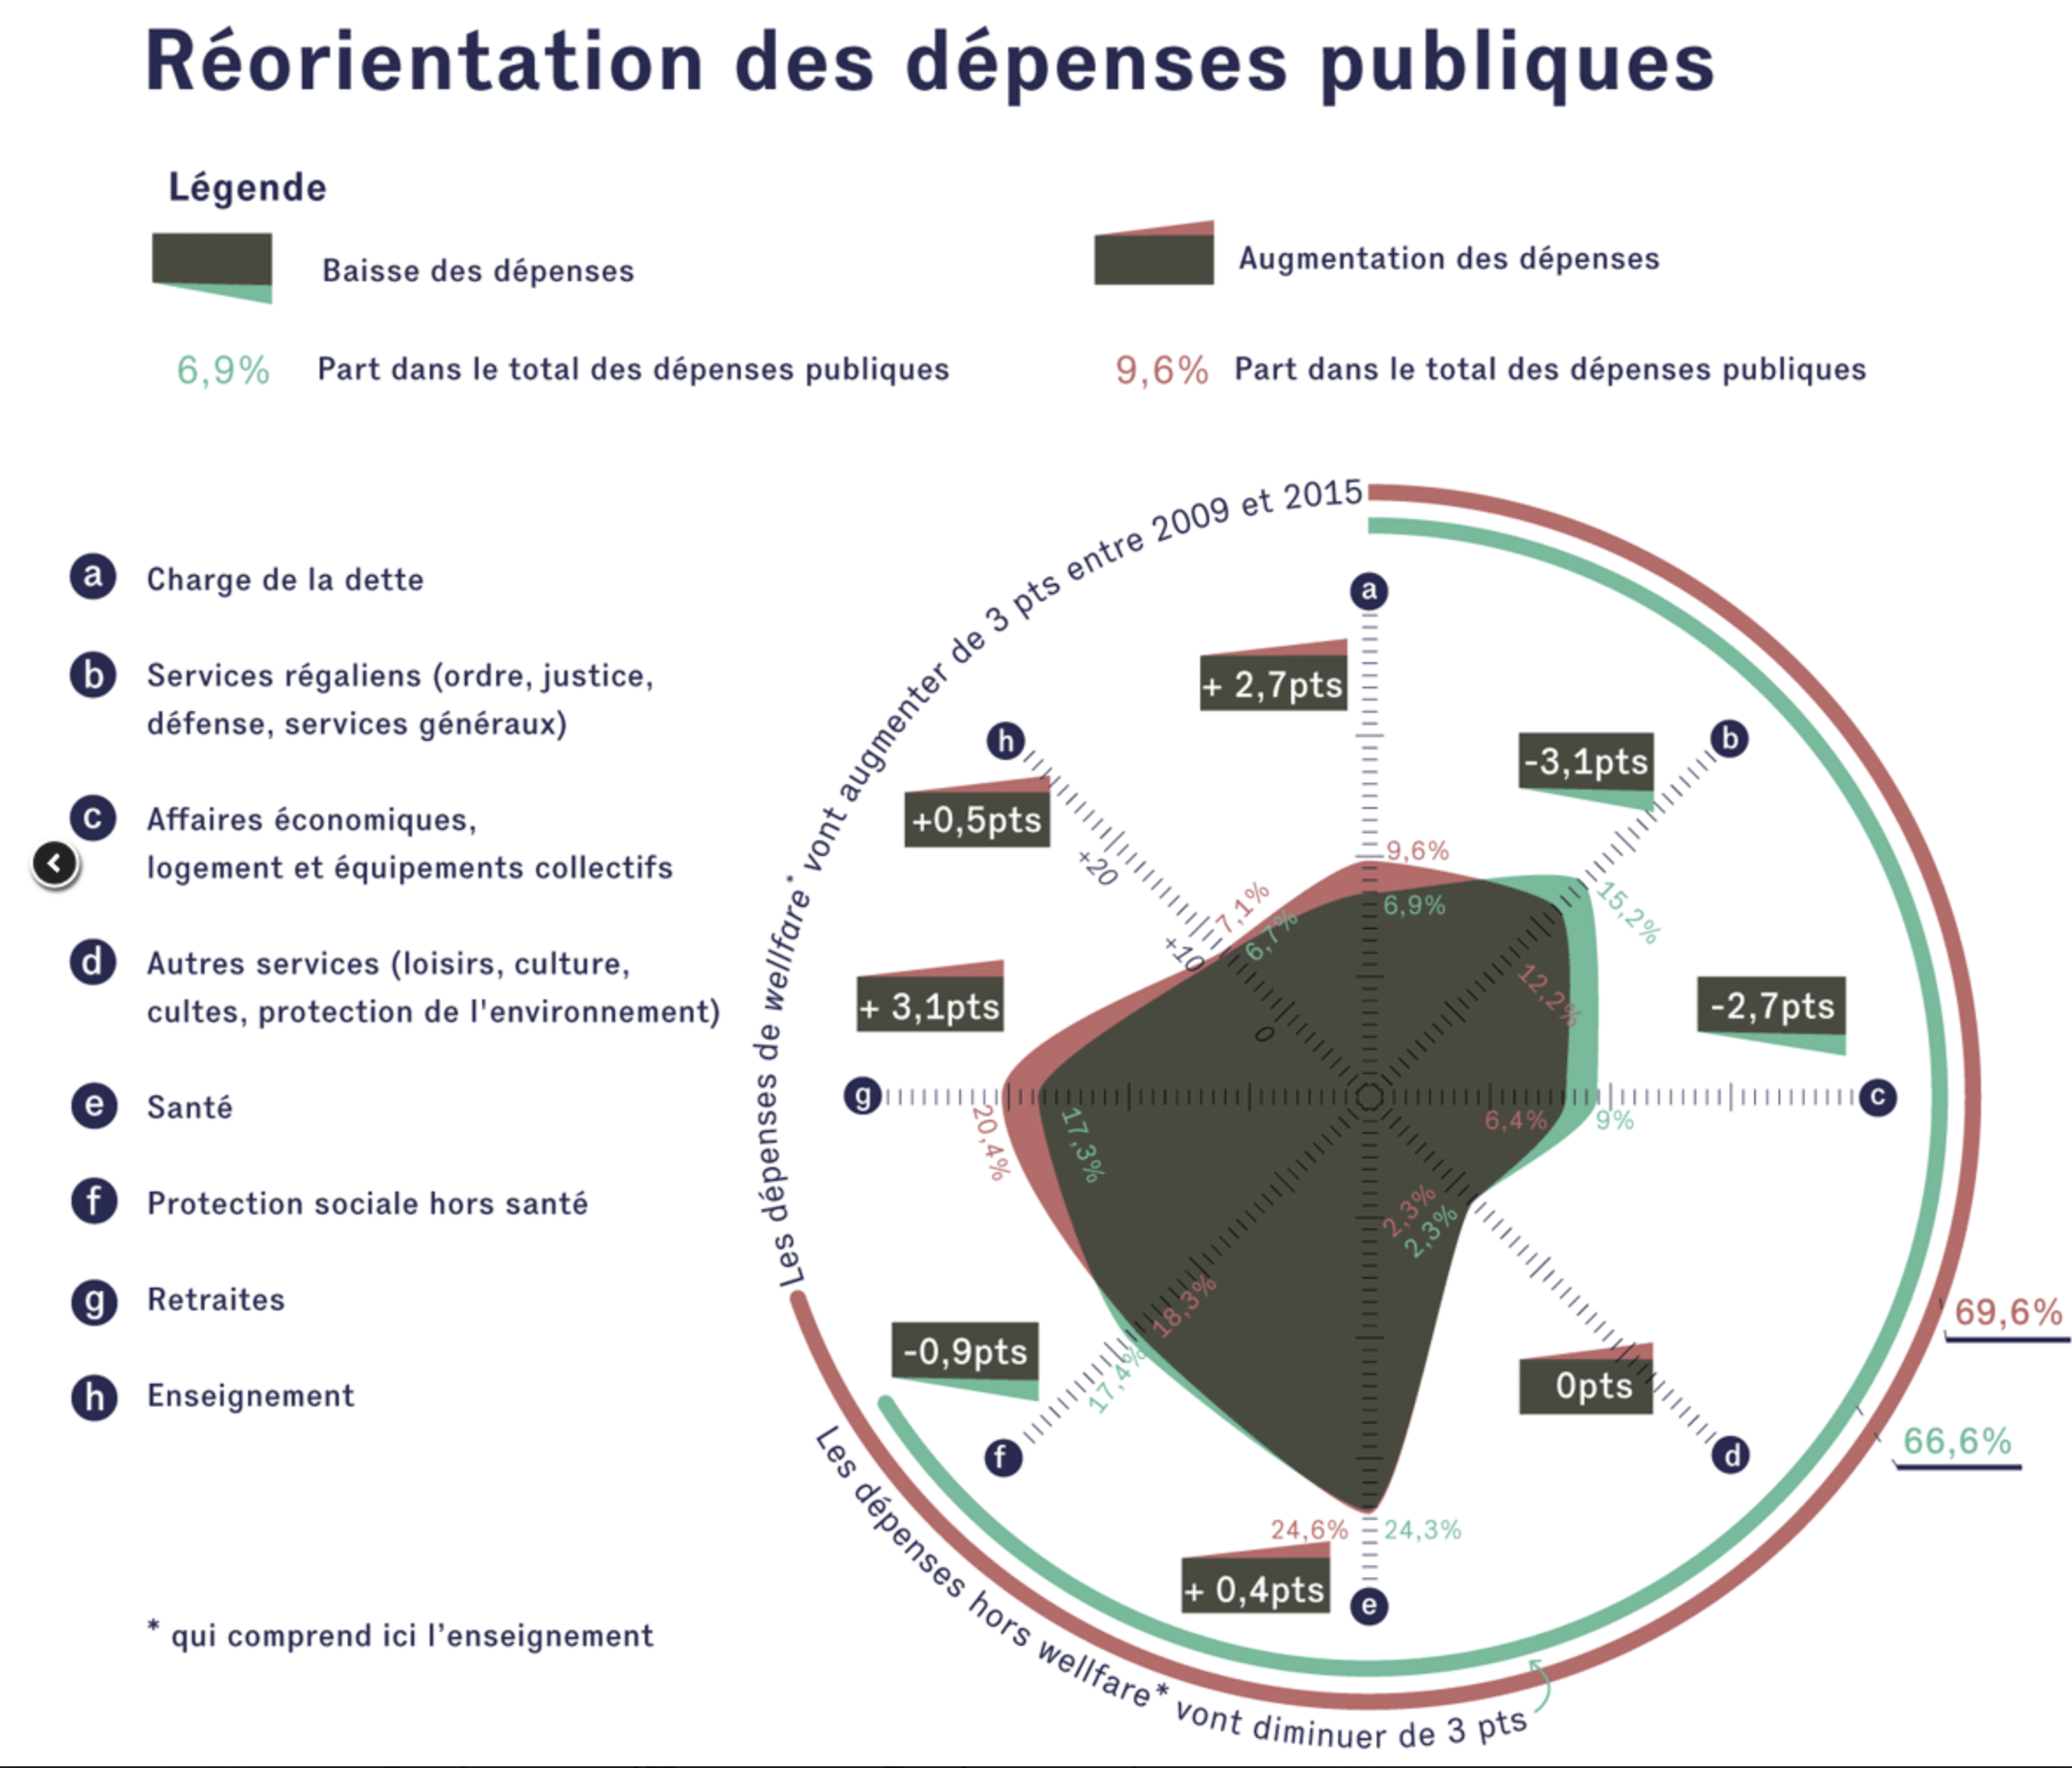
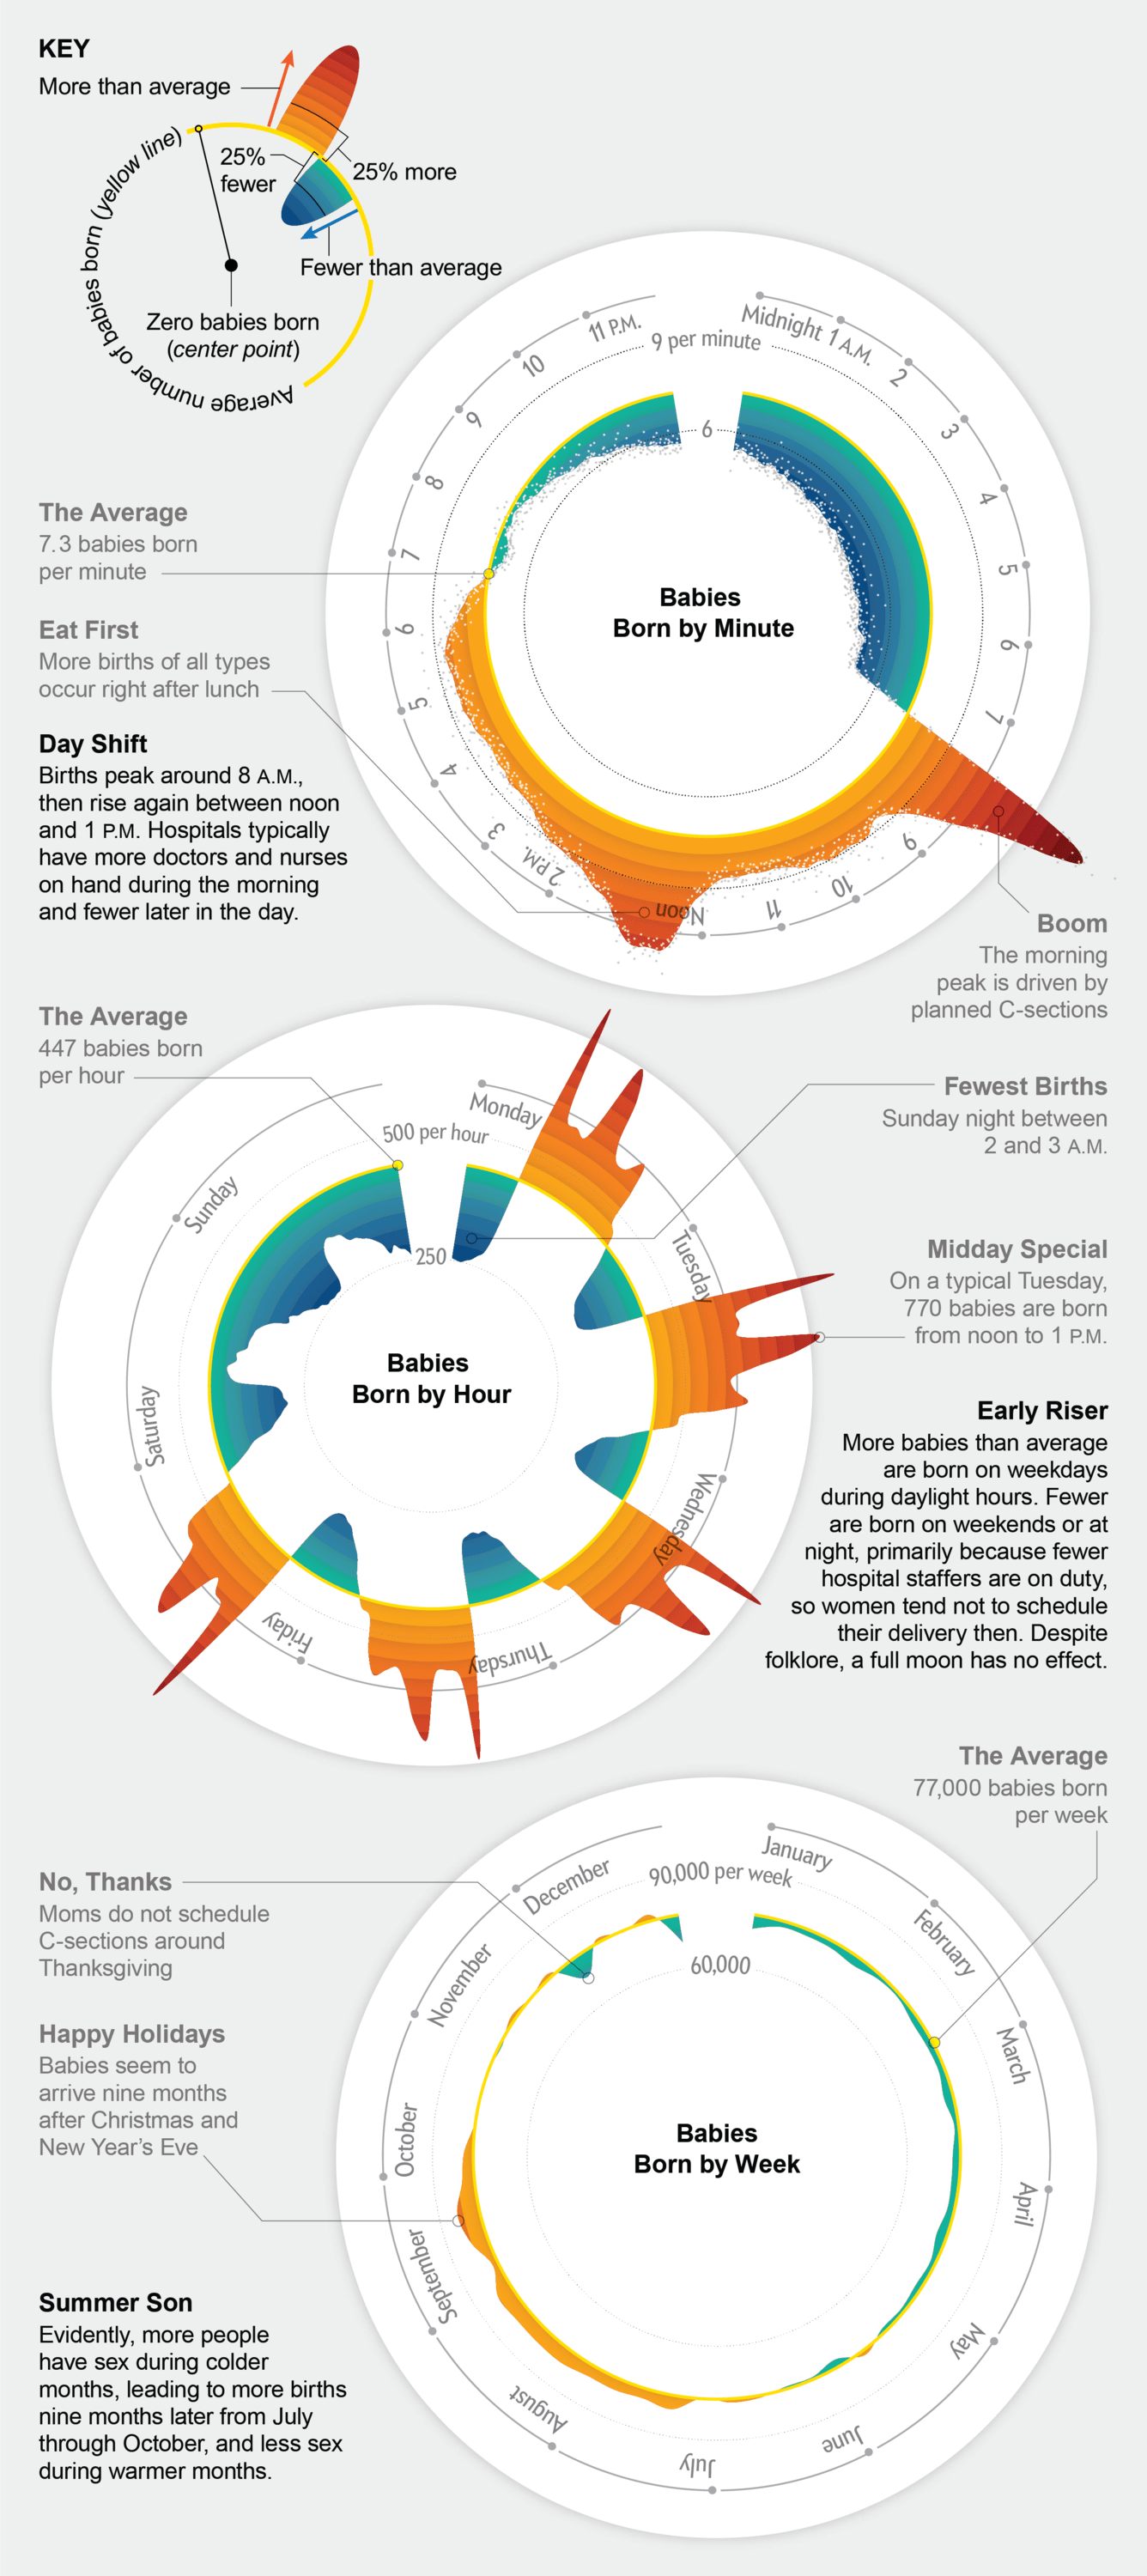
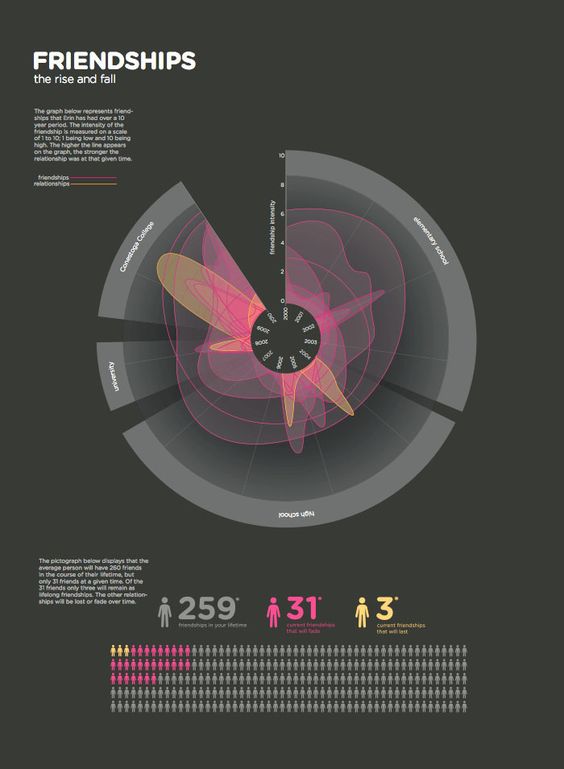
Radial Area Chart
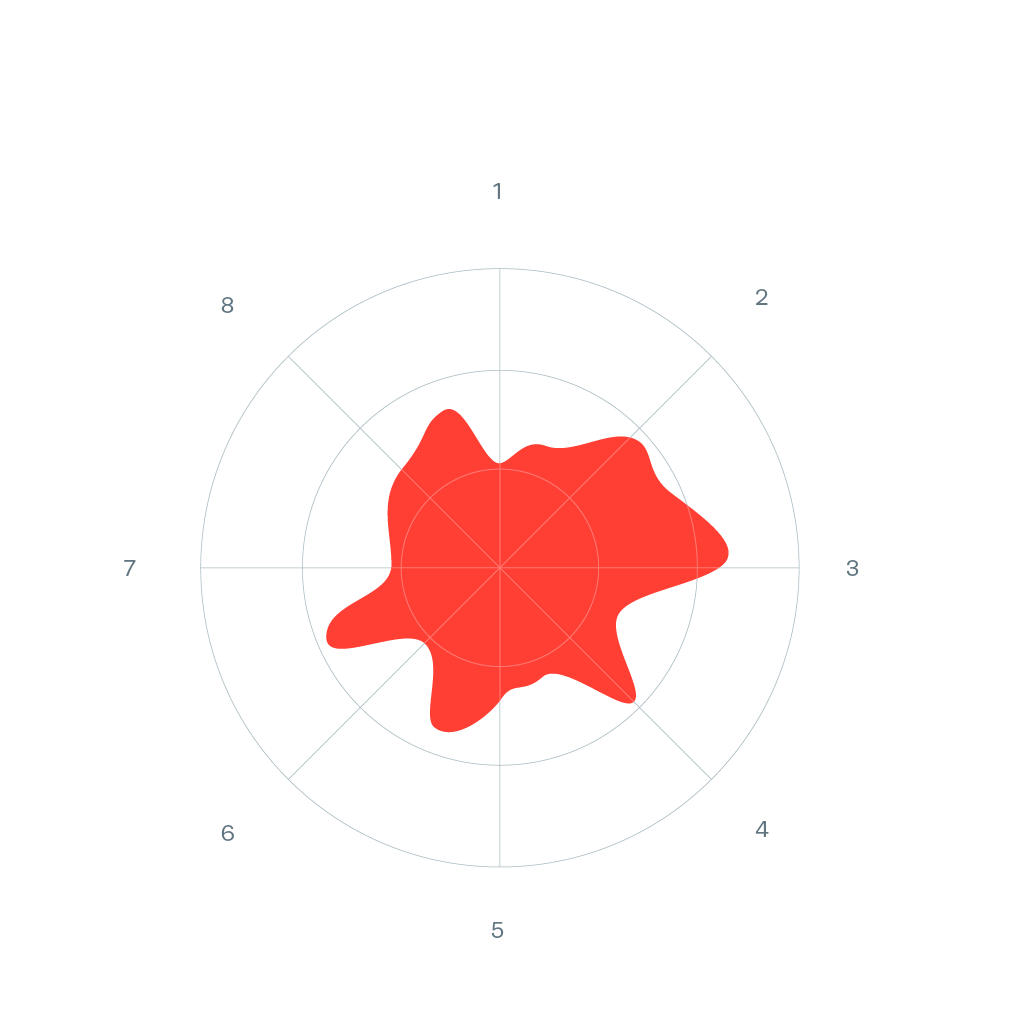
Radial Area Chart is a variation of Area Chart. An area chart displays graphically quantitive data. It is based on the line chart. The area between axis and line are commonly emphasized with colors, textures and hatchings. Whereas area charts are used to represent cumulated totals using numbers or percentages over time, Radial Area Chart can be also used to display categories instead.