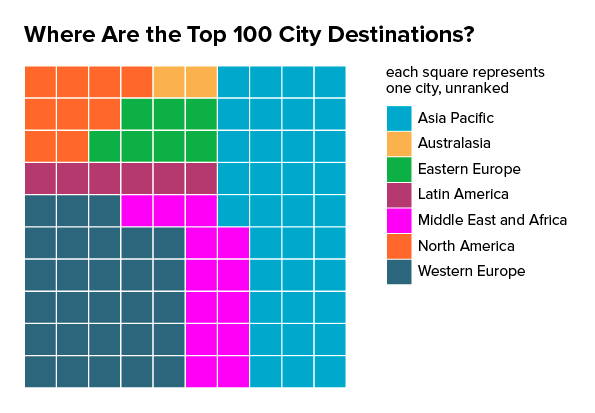
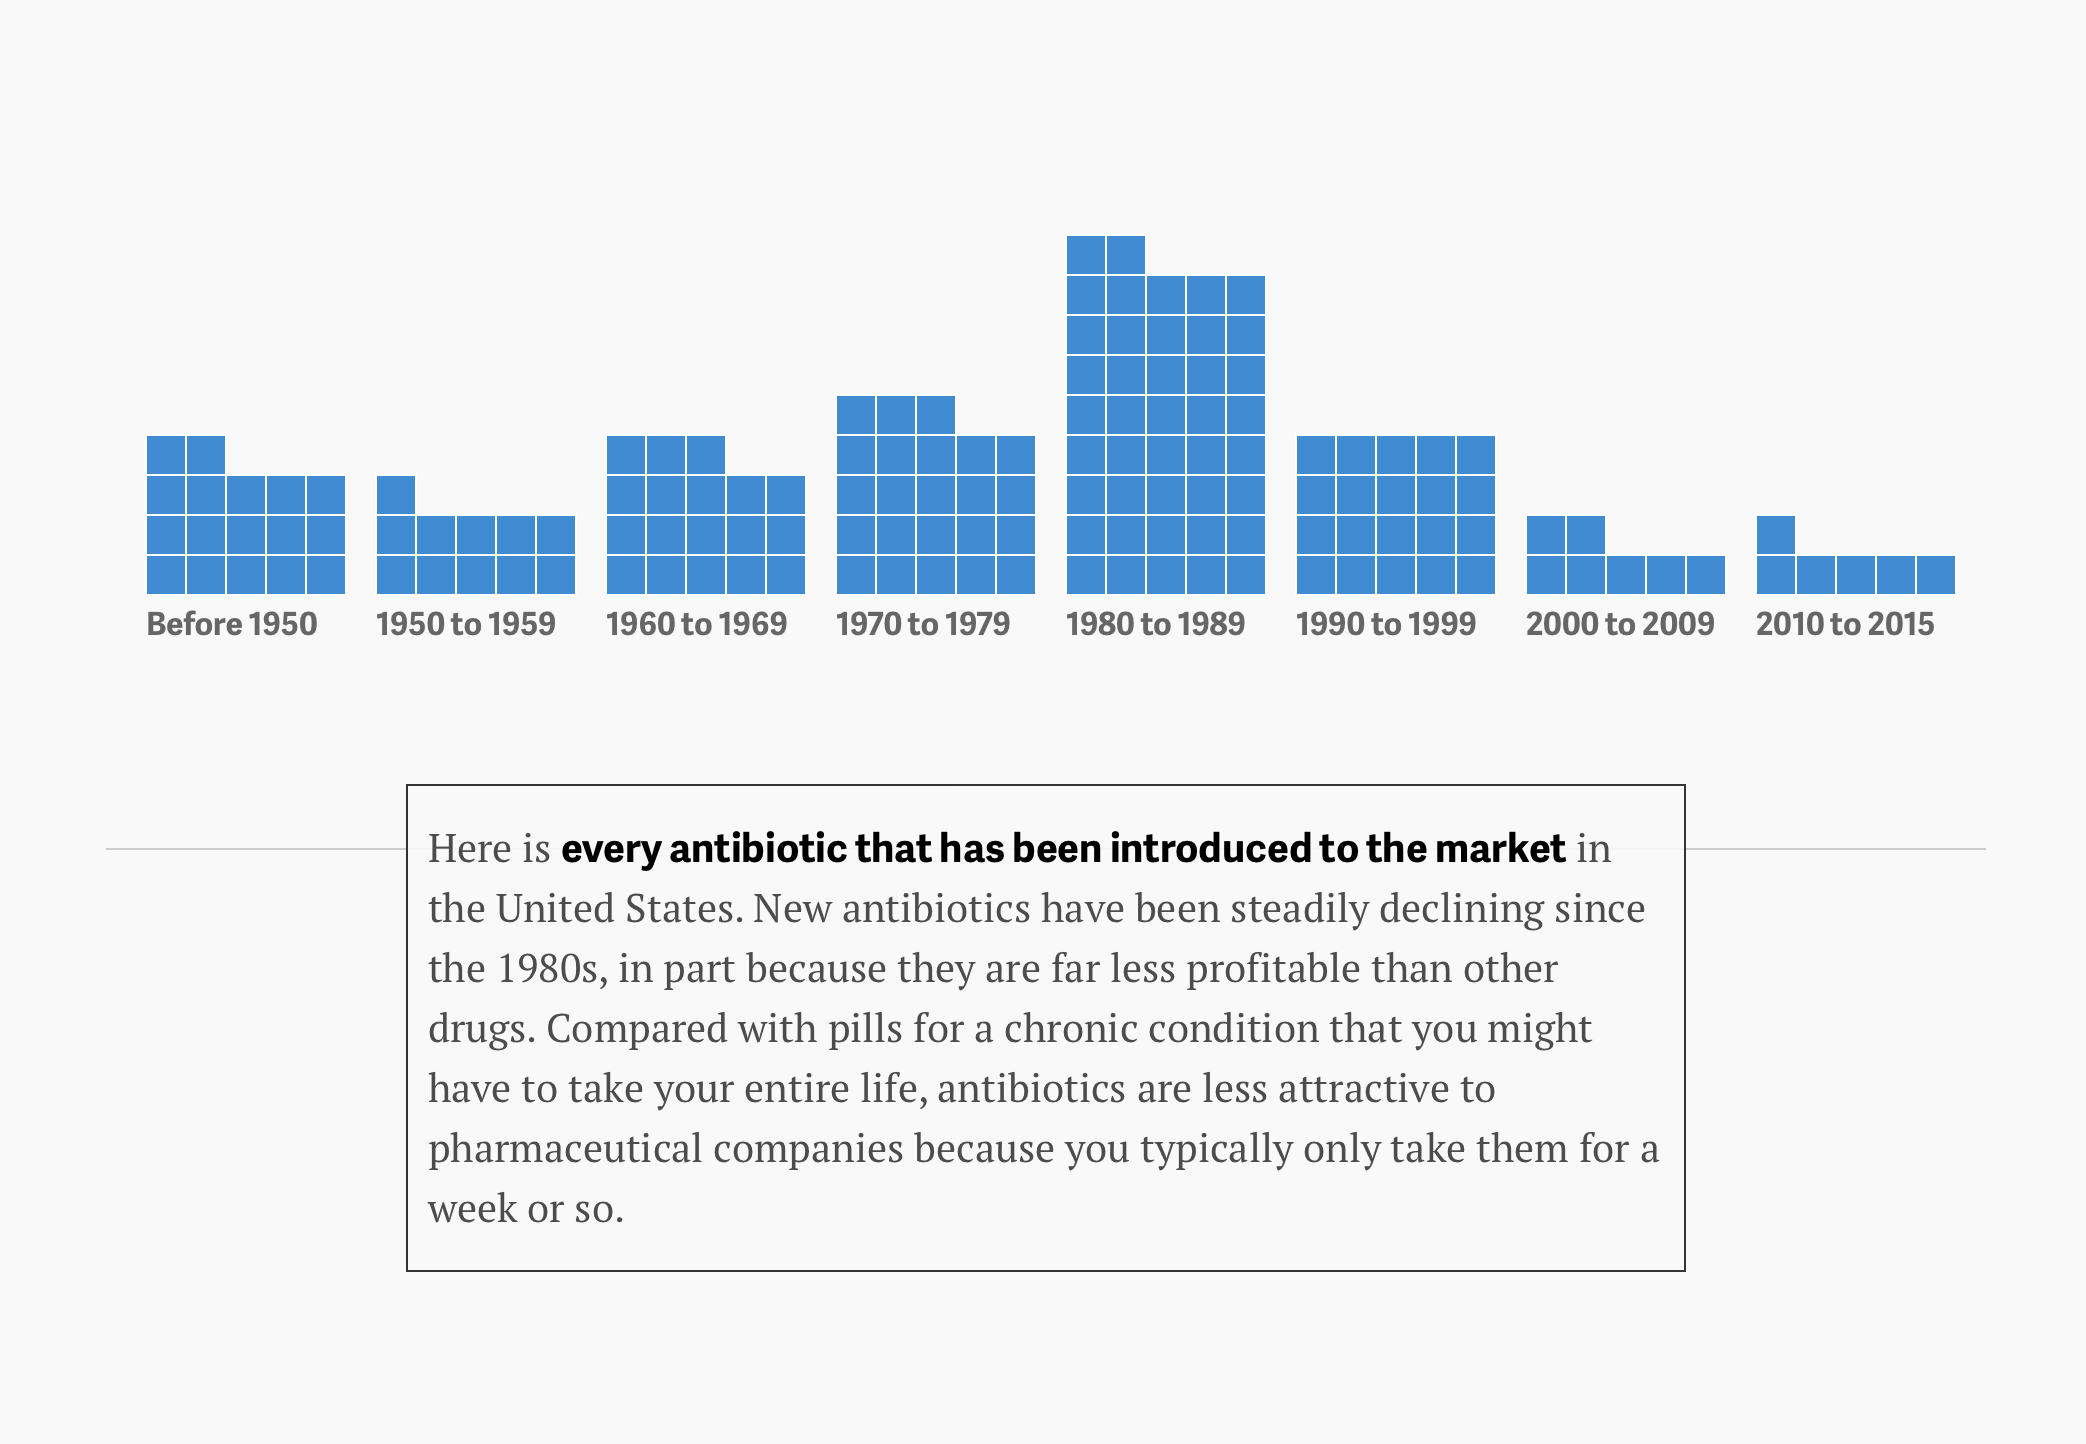
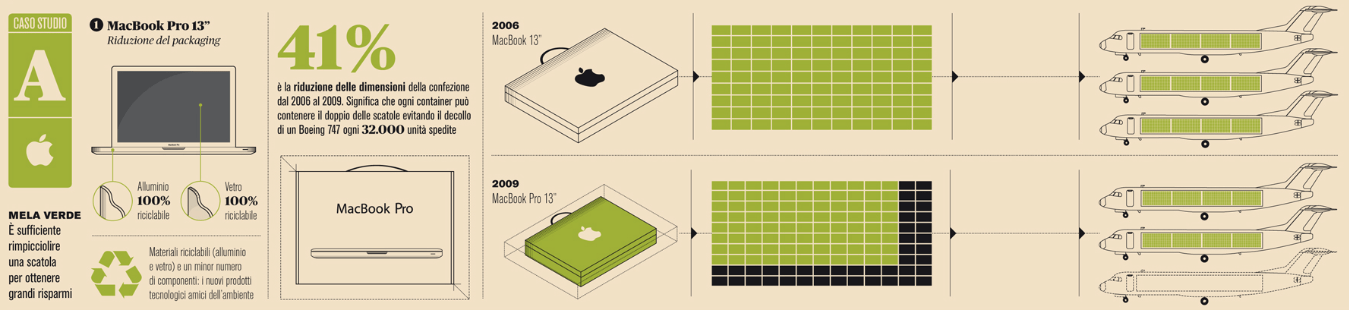
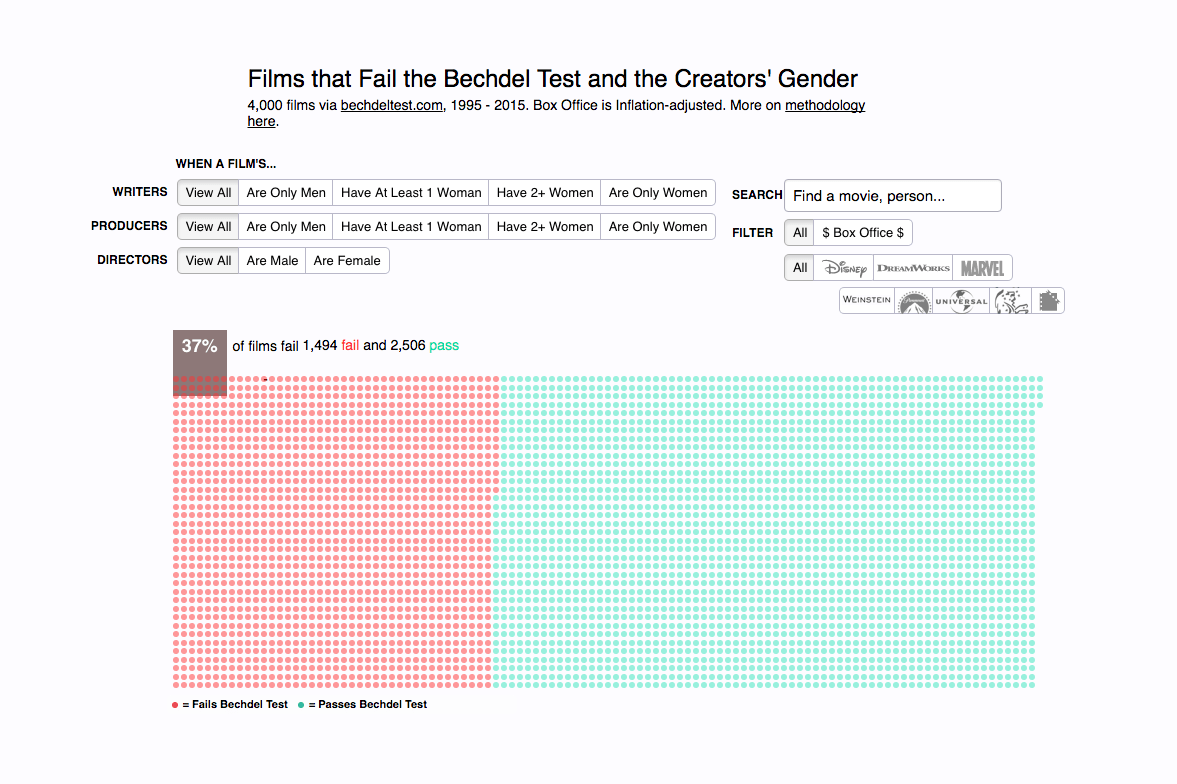
Waffle Chart
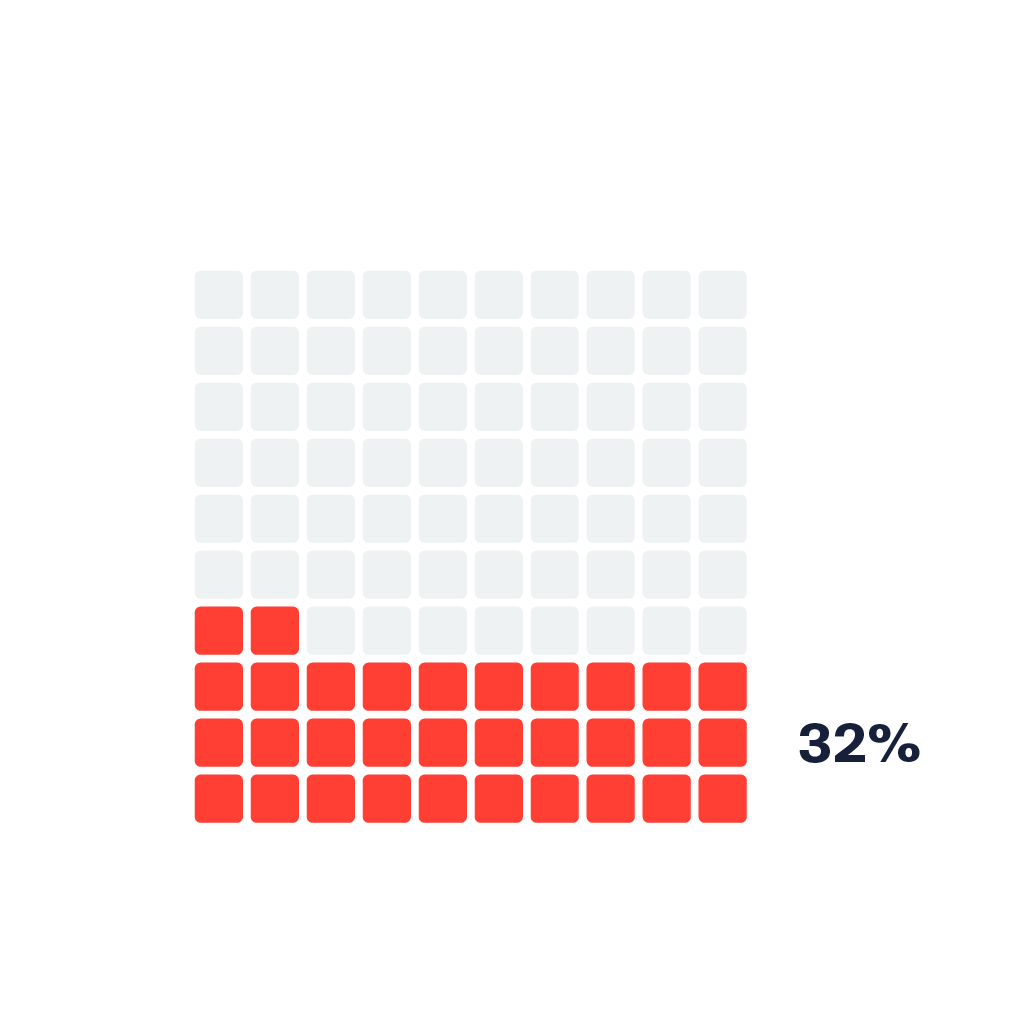
A waffle chart shows progress towards a target or a completion percentage. There is a grid of small cells, of which coloured cells represent the data.
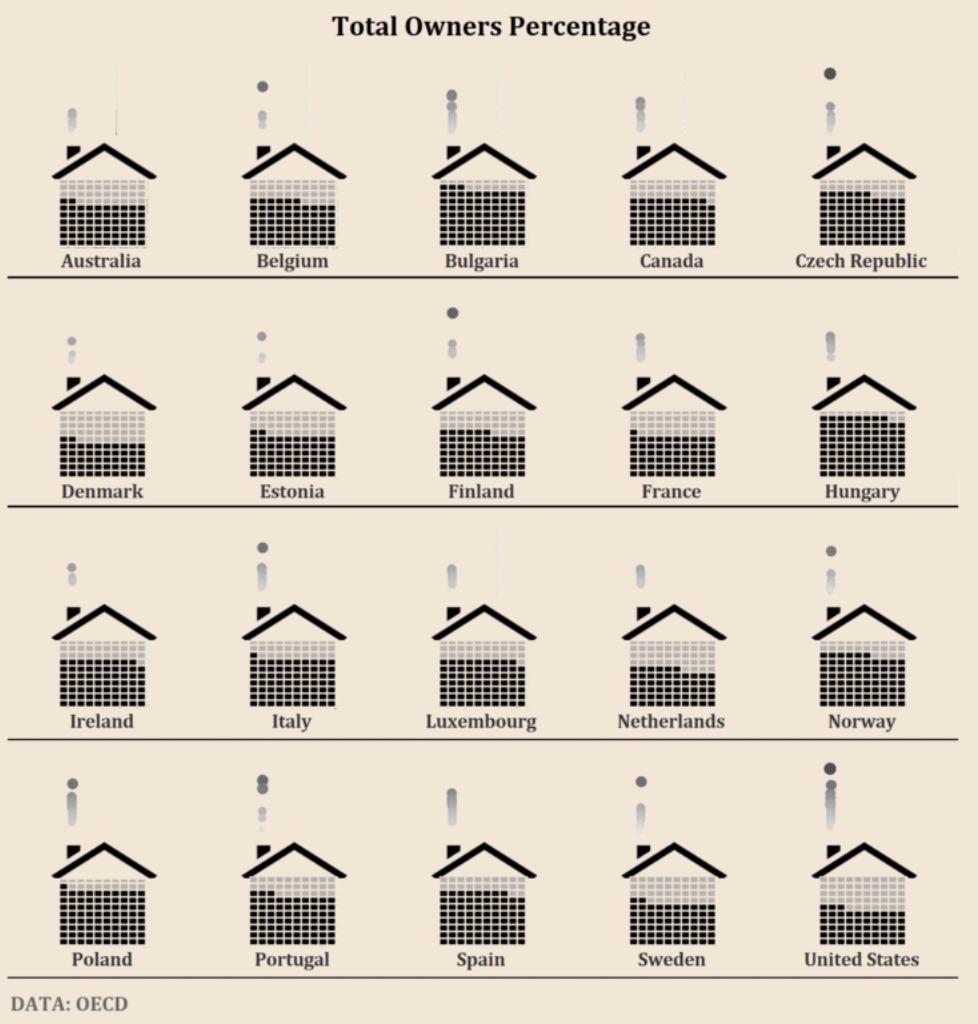
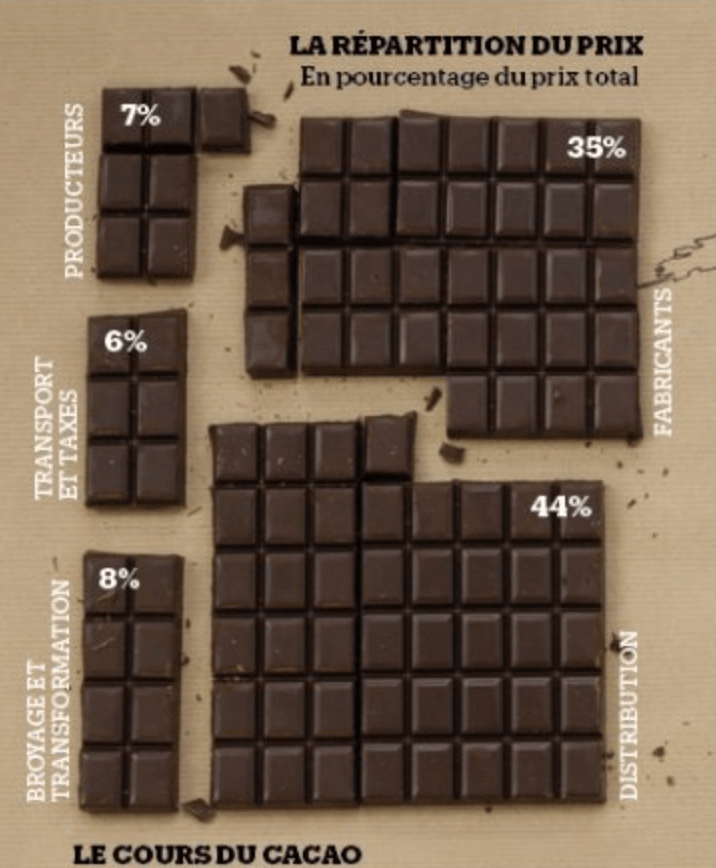
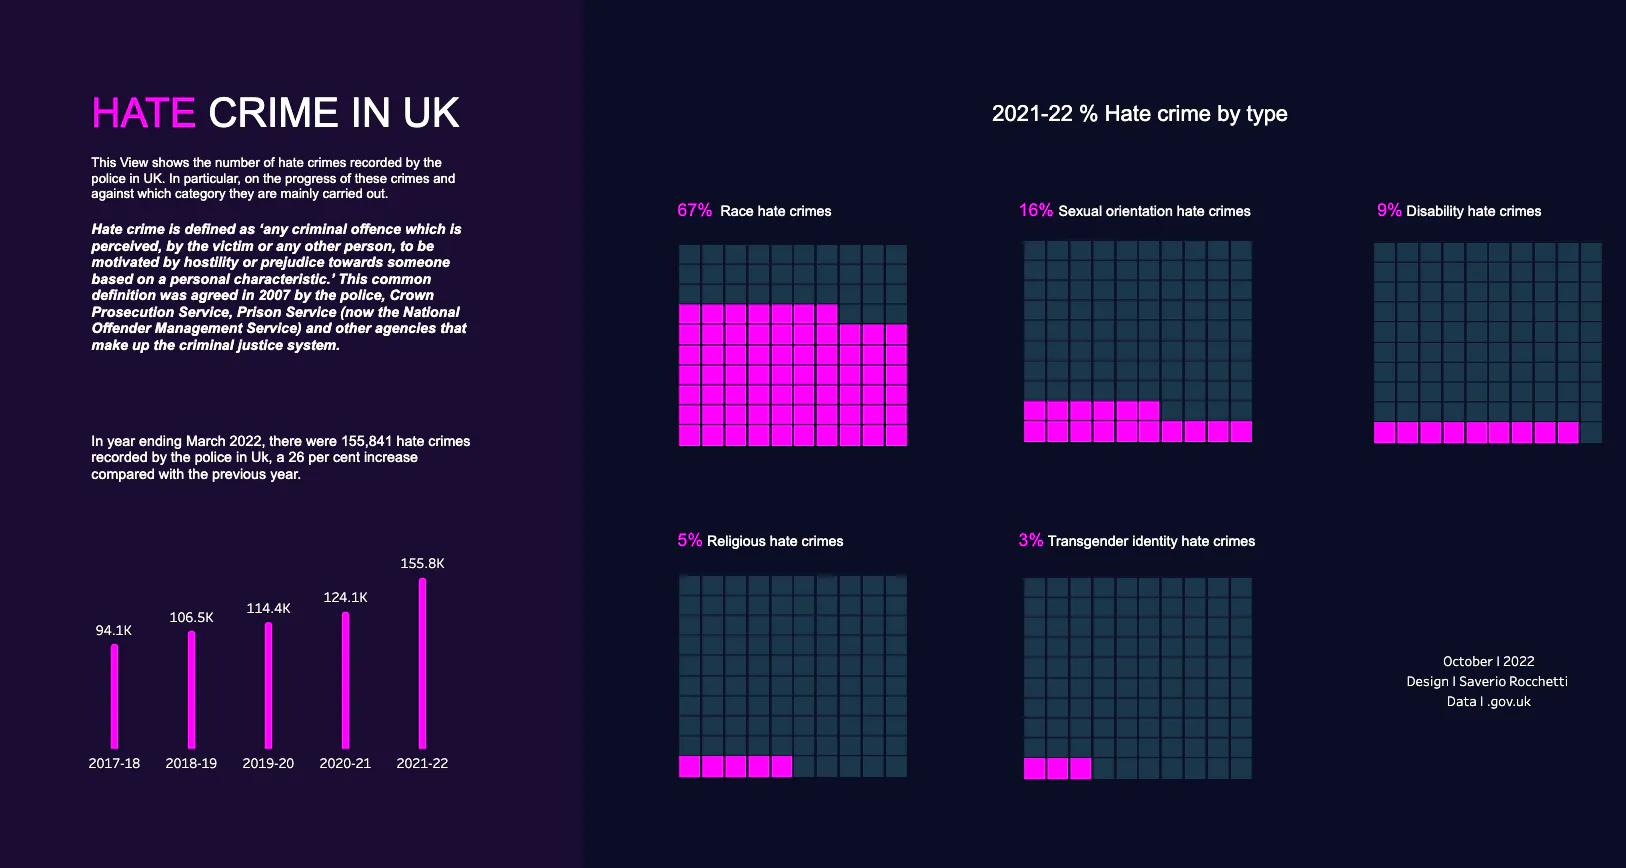
A chart can consist of one category or several categories. Multiple waffle charts can be put together to show a comparison between different charts.