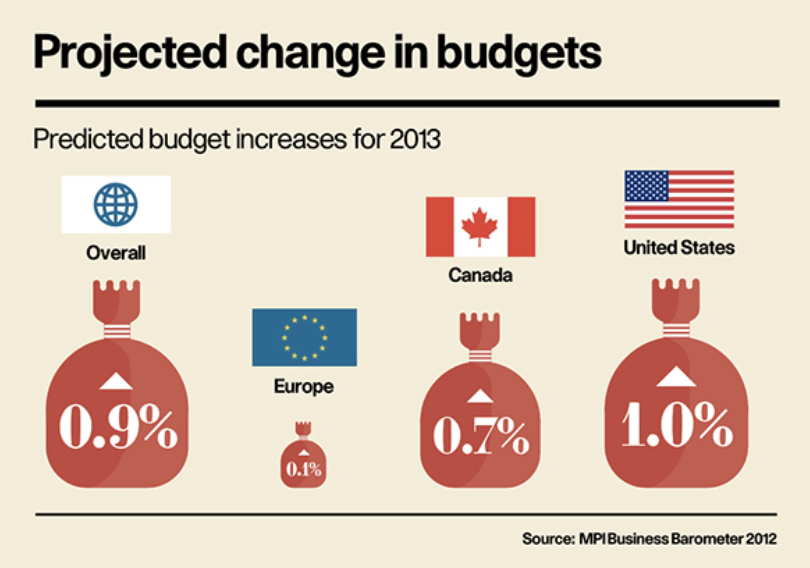
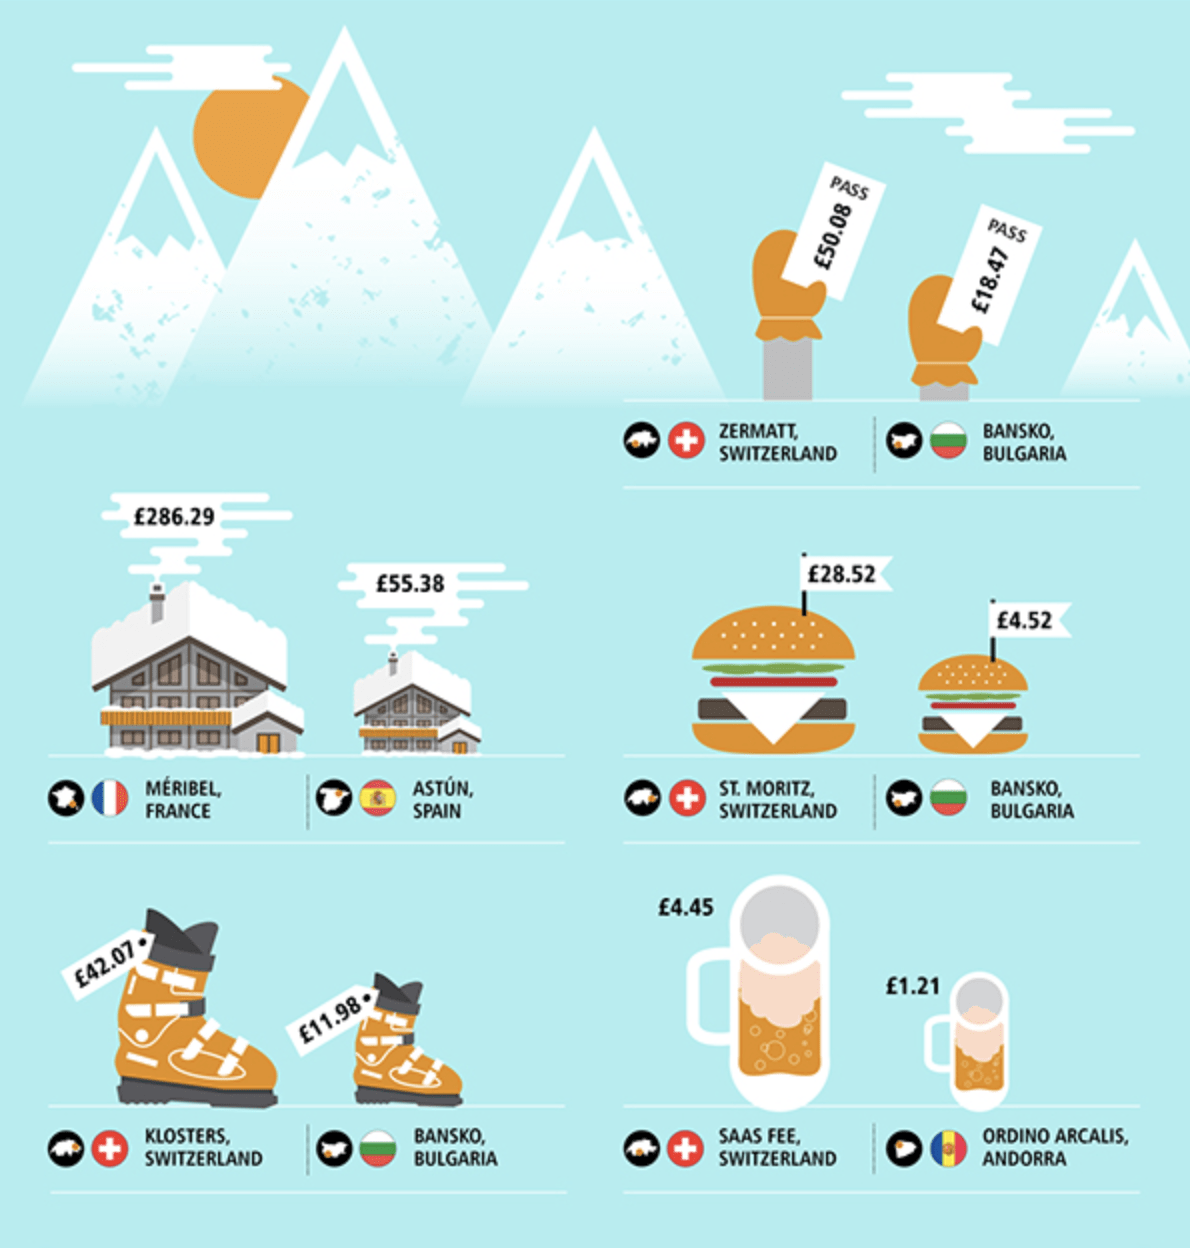
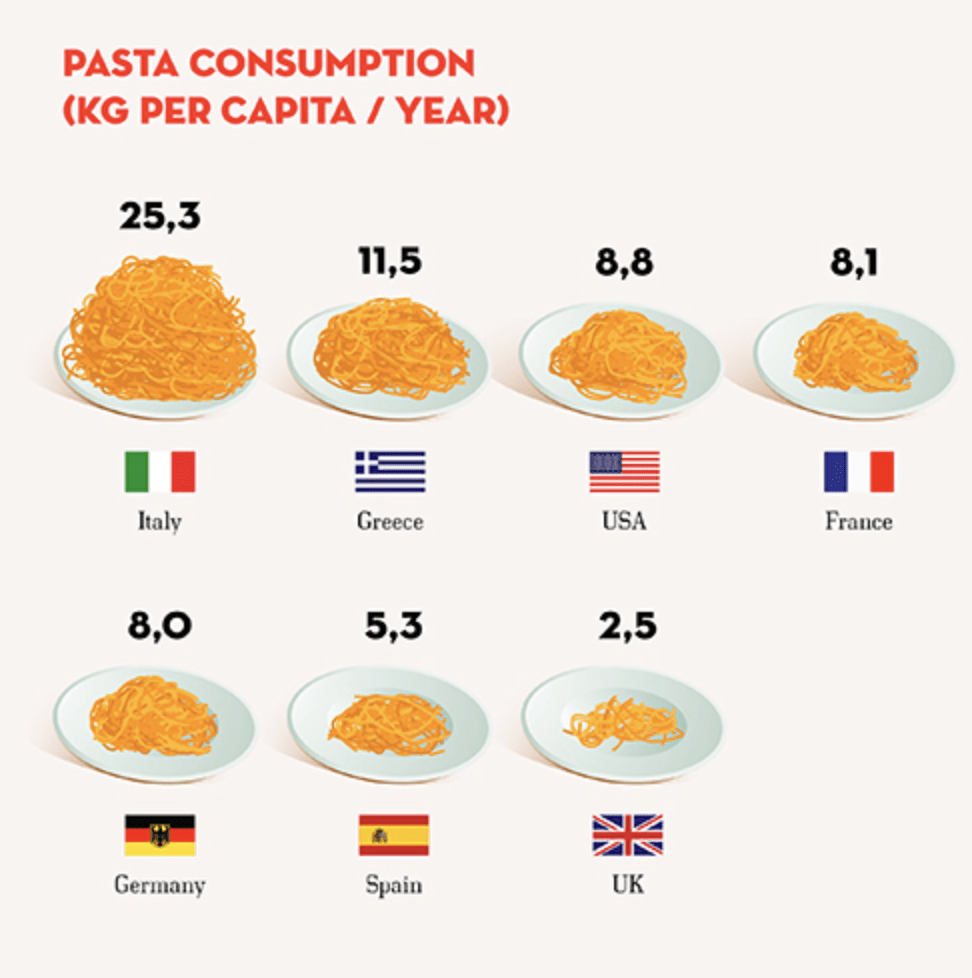
Proportional Area Chart (Icon)
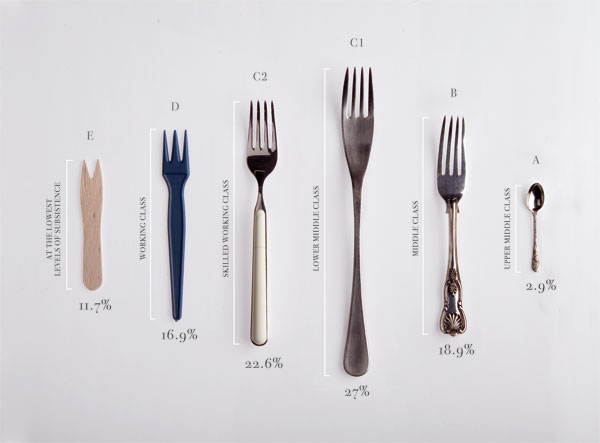
A Proportional Area Chart (Icon) is used for comparing proportions (size, quantities, etc.) to provide a quick overview of the relative size of data without the use of scales.
Similar data visualizations includes proportional area charts, displayed as circles or a squares.