Multi-level Donut Chart
Also called: Exploded Donut Chart. Multi-series Donut Chart
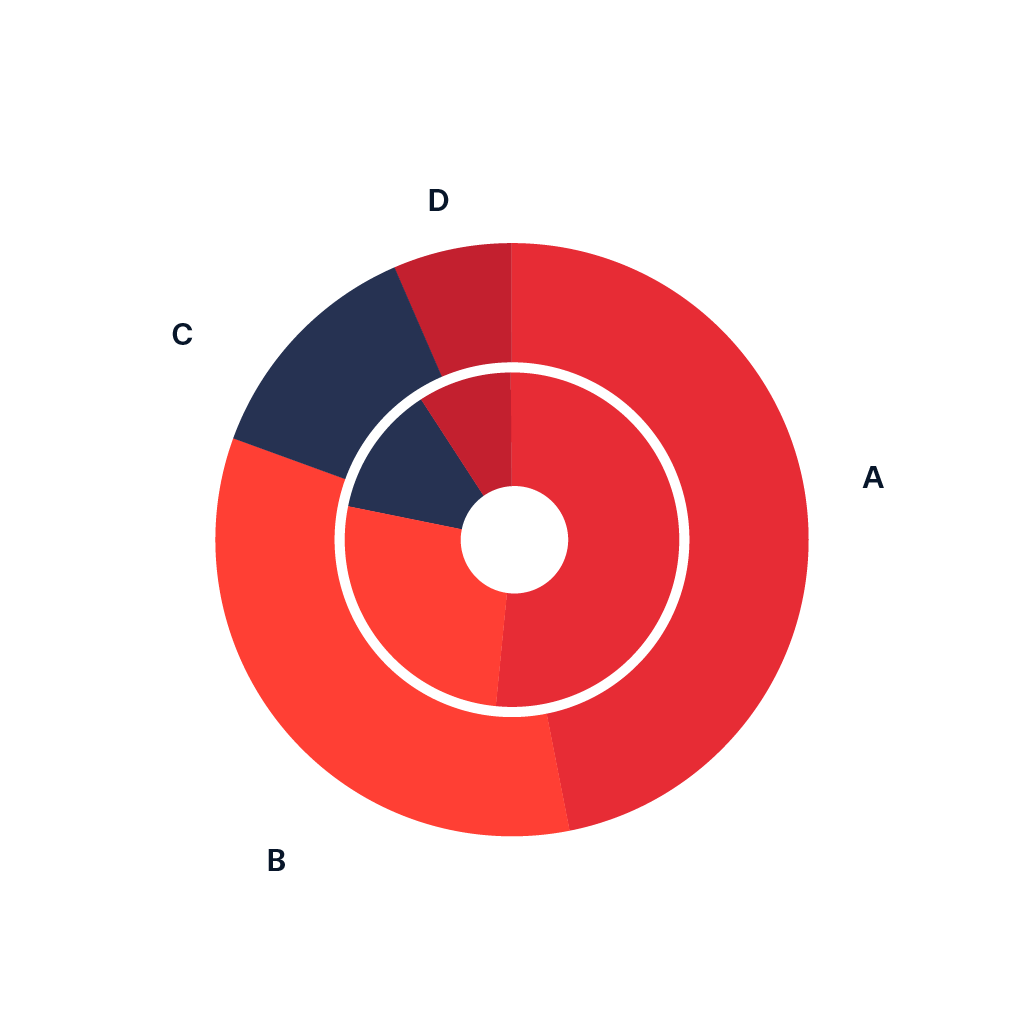
Multi-level Donut charts are a set of concentric circles which is used to visualize hierarchical relationships. The size of each item represents its contribution to the inner parent category. It starts with a single item that is put as a circle in the center. This is the root node. A concentric ring is set around this central circle to see the breakup of that item. The concentric ring is then segmented to show how various child items have contributed to the parent item.