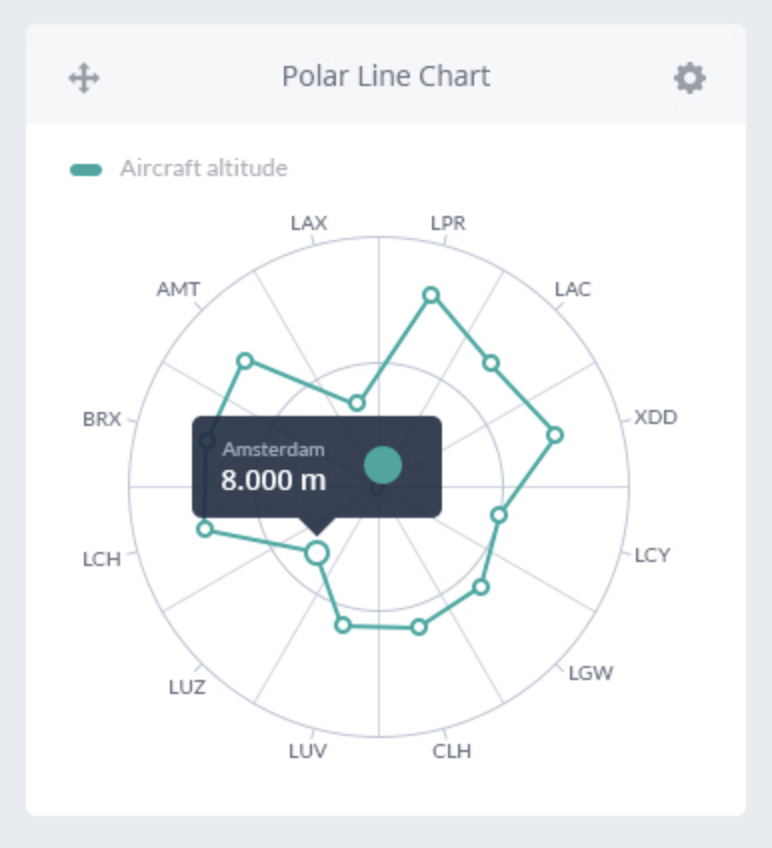
Radial Line Graph
Also called: Polar line chart
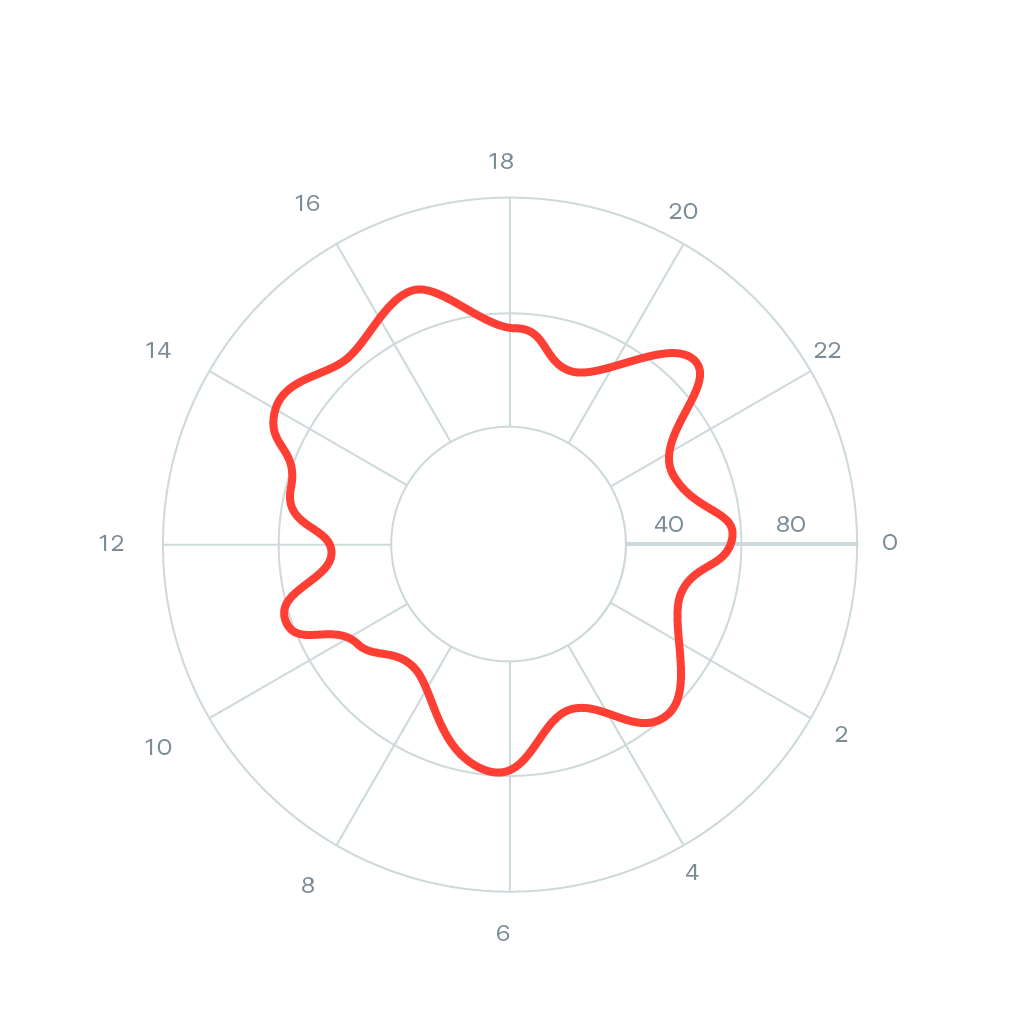
Radial Line Graph is a part of radial graphs that takes data and render it as collection of data points wrapped around a circle. It is also mapping a list of categories from the minimum to the maximum of the extent of the chart. Radial Line Graph is rendered using a collection of straight lines connecting data points.