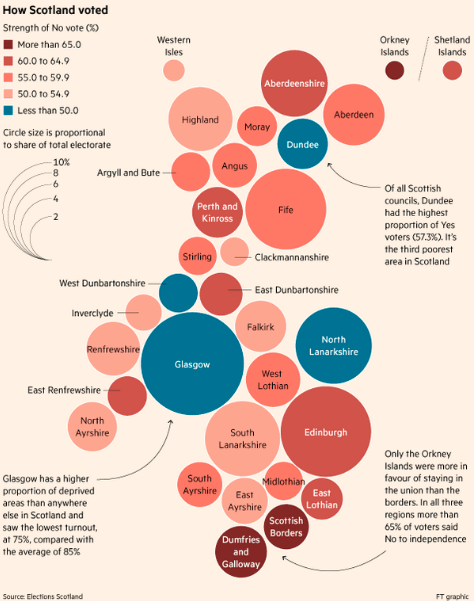
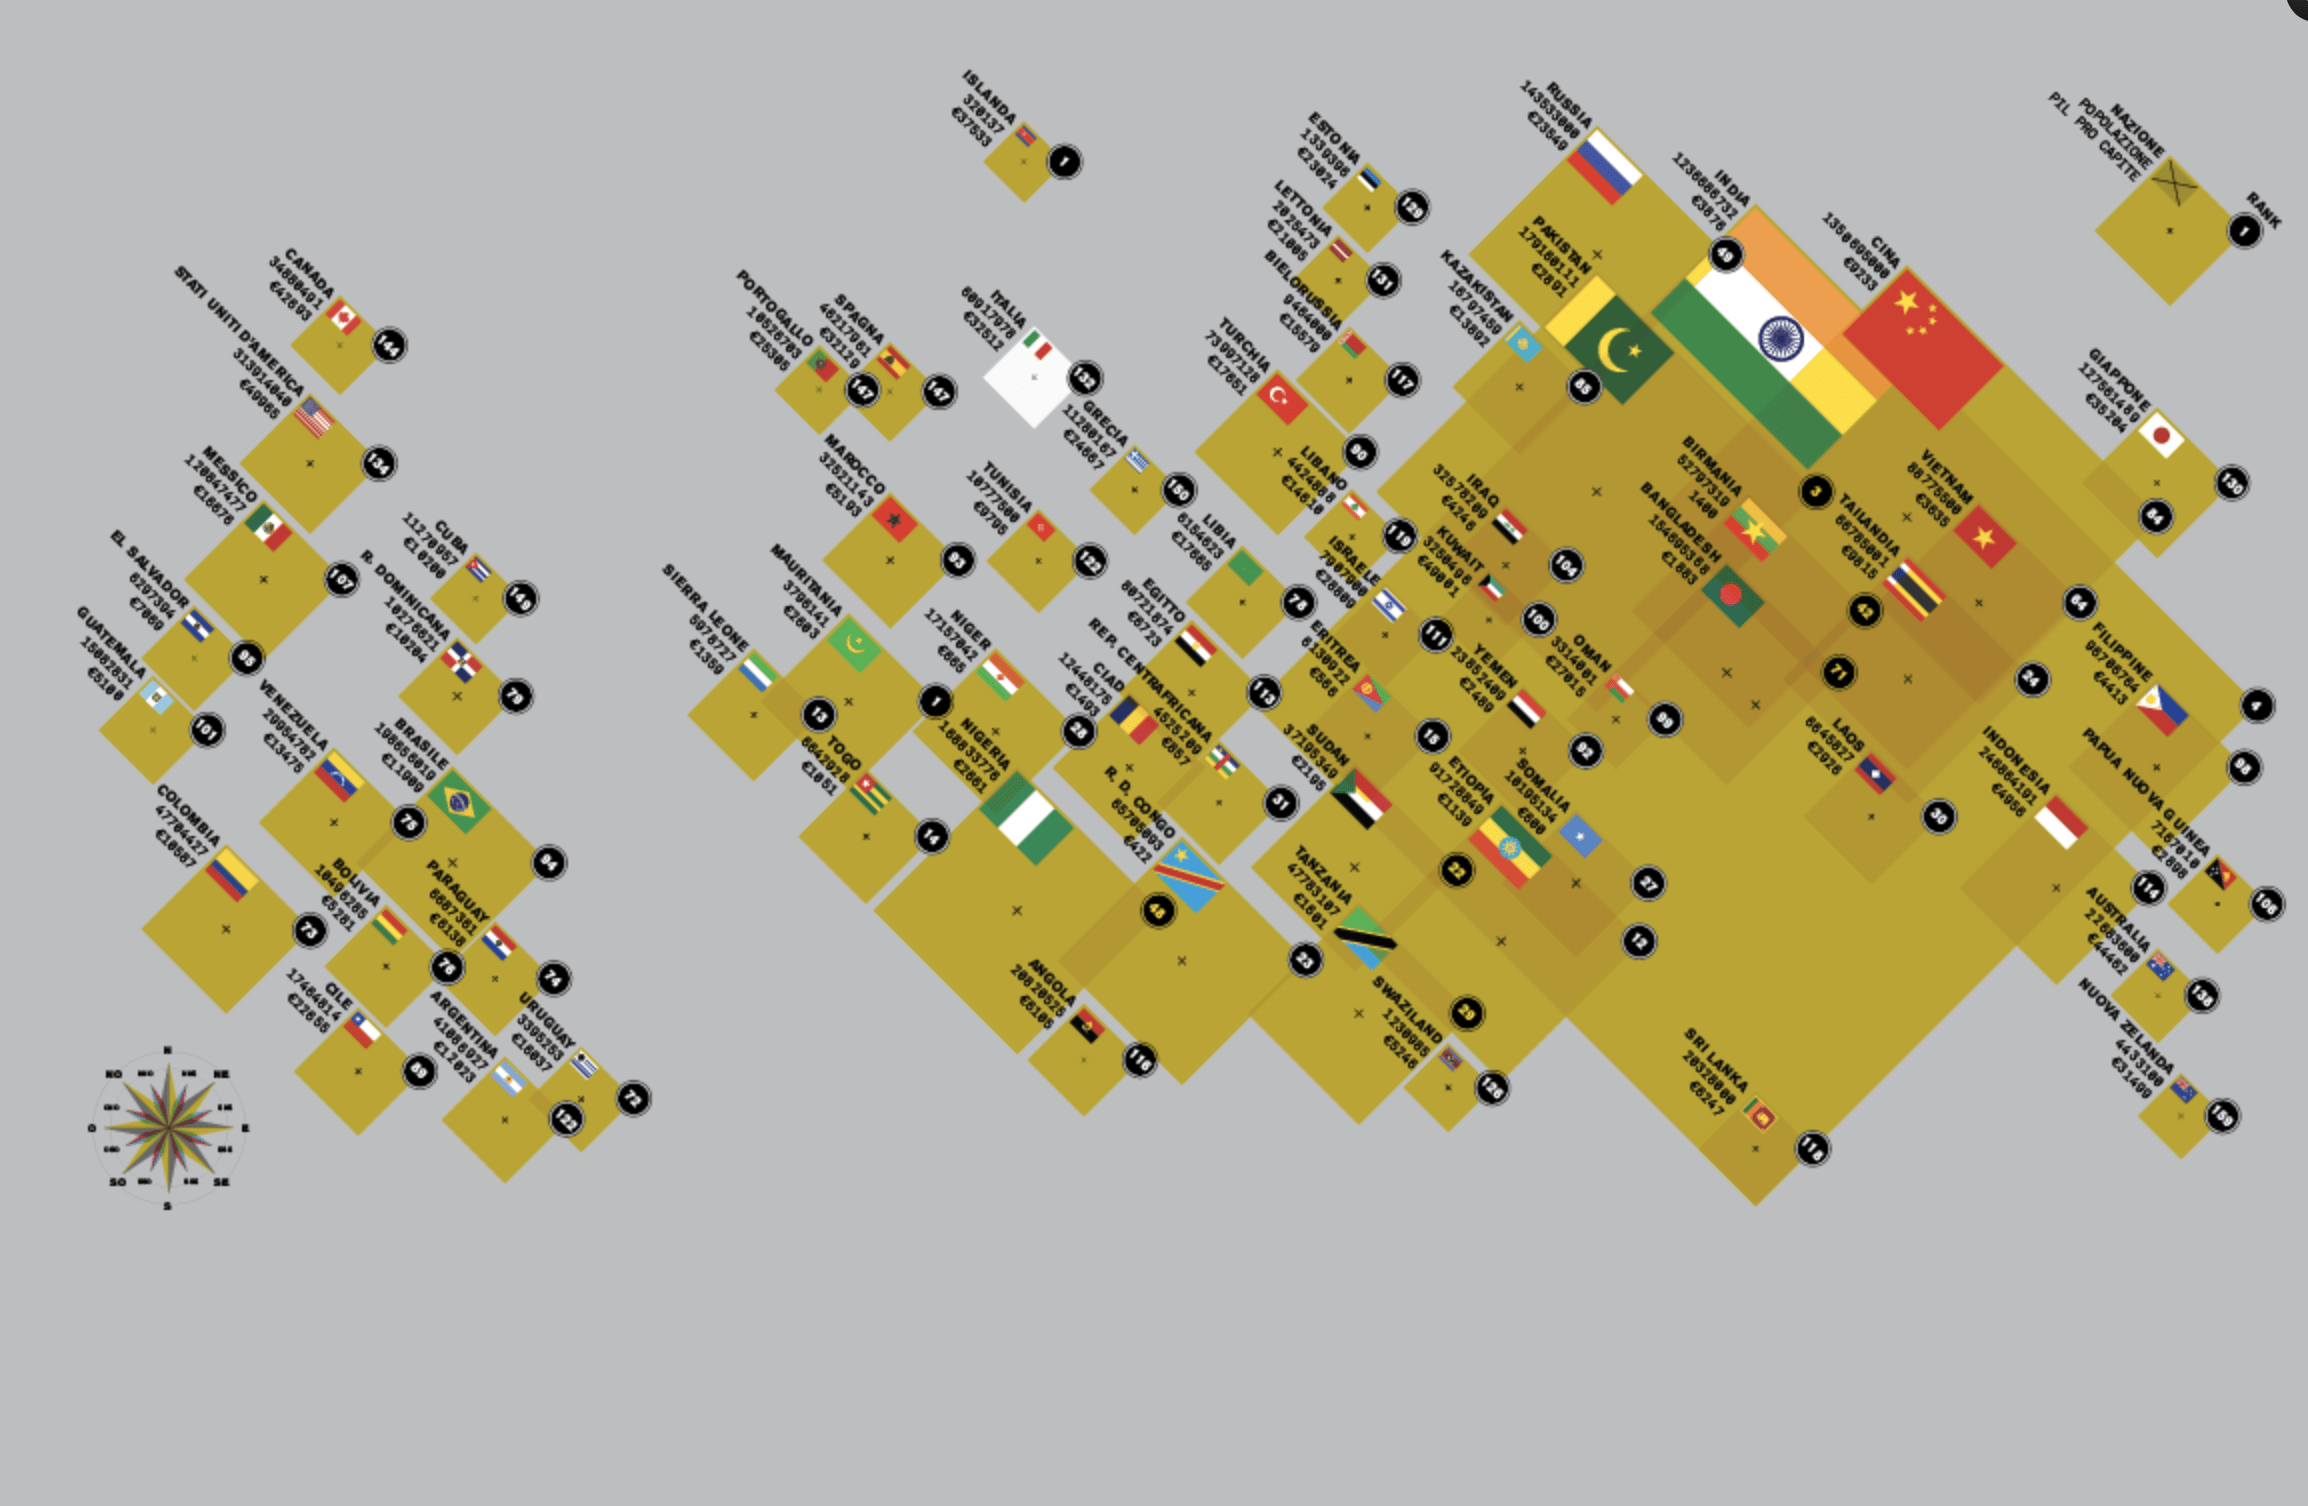
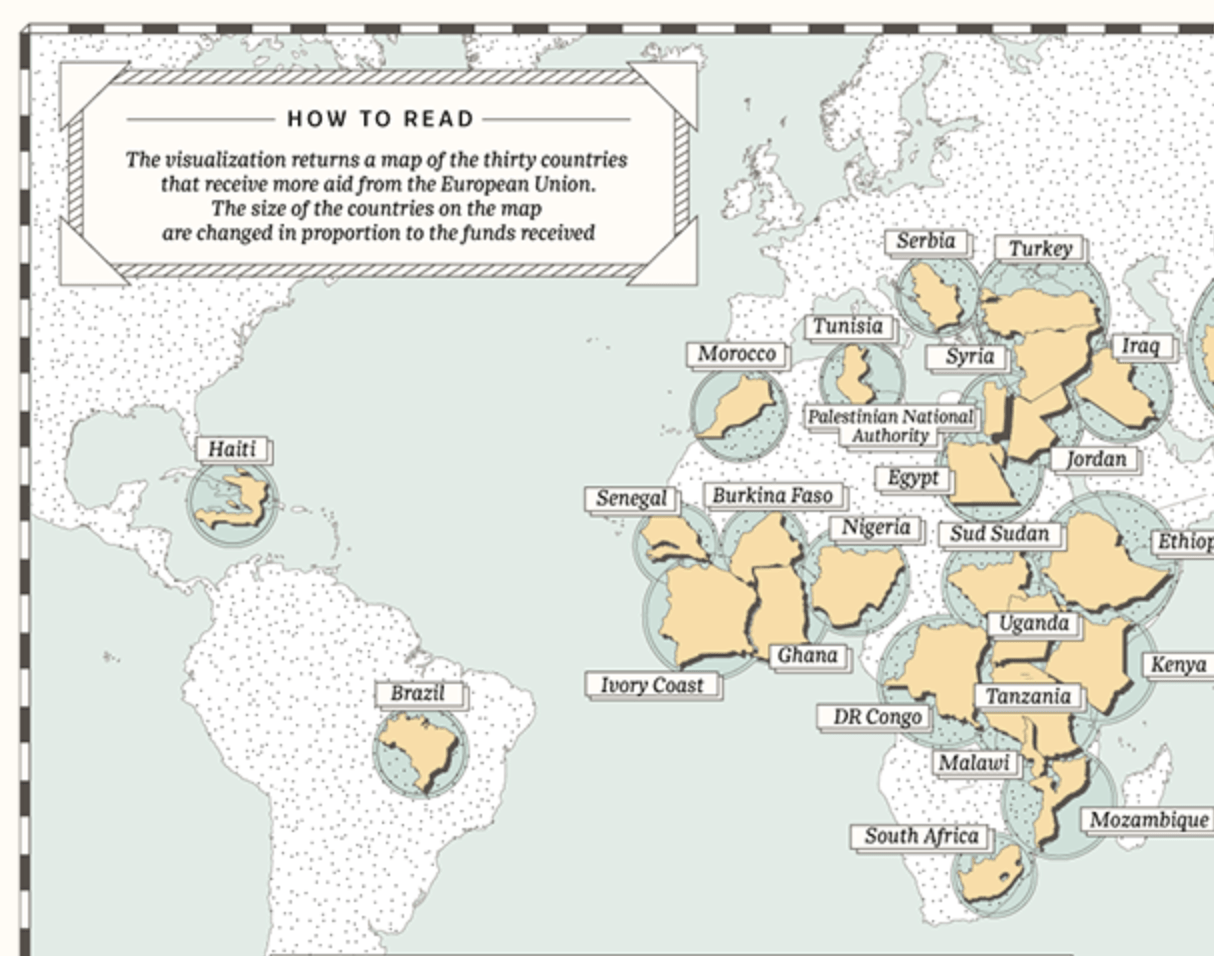
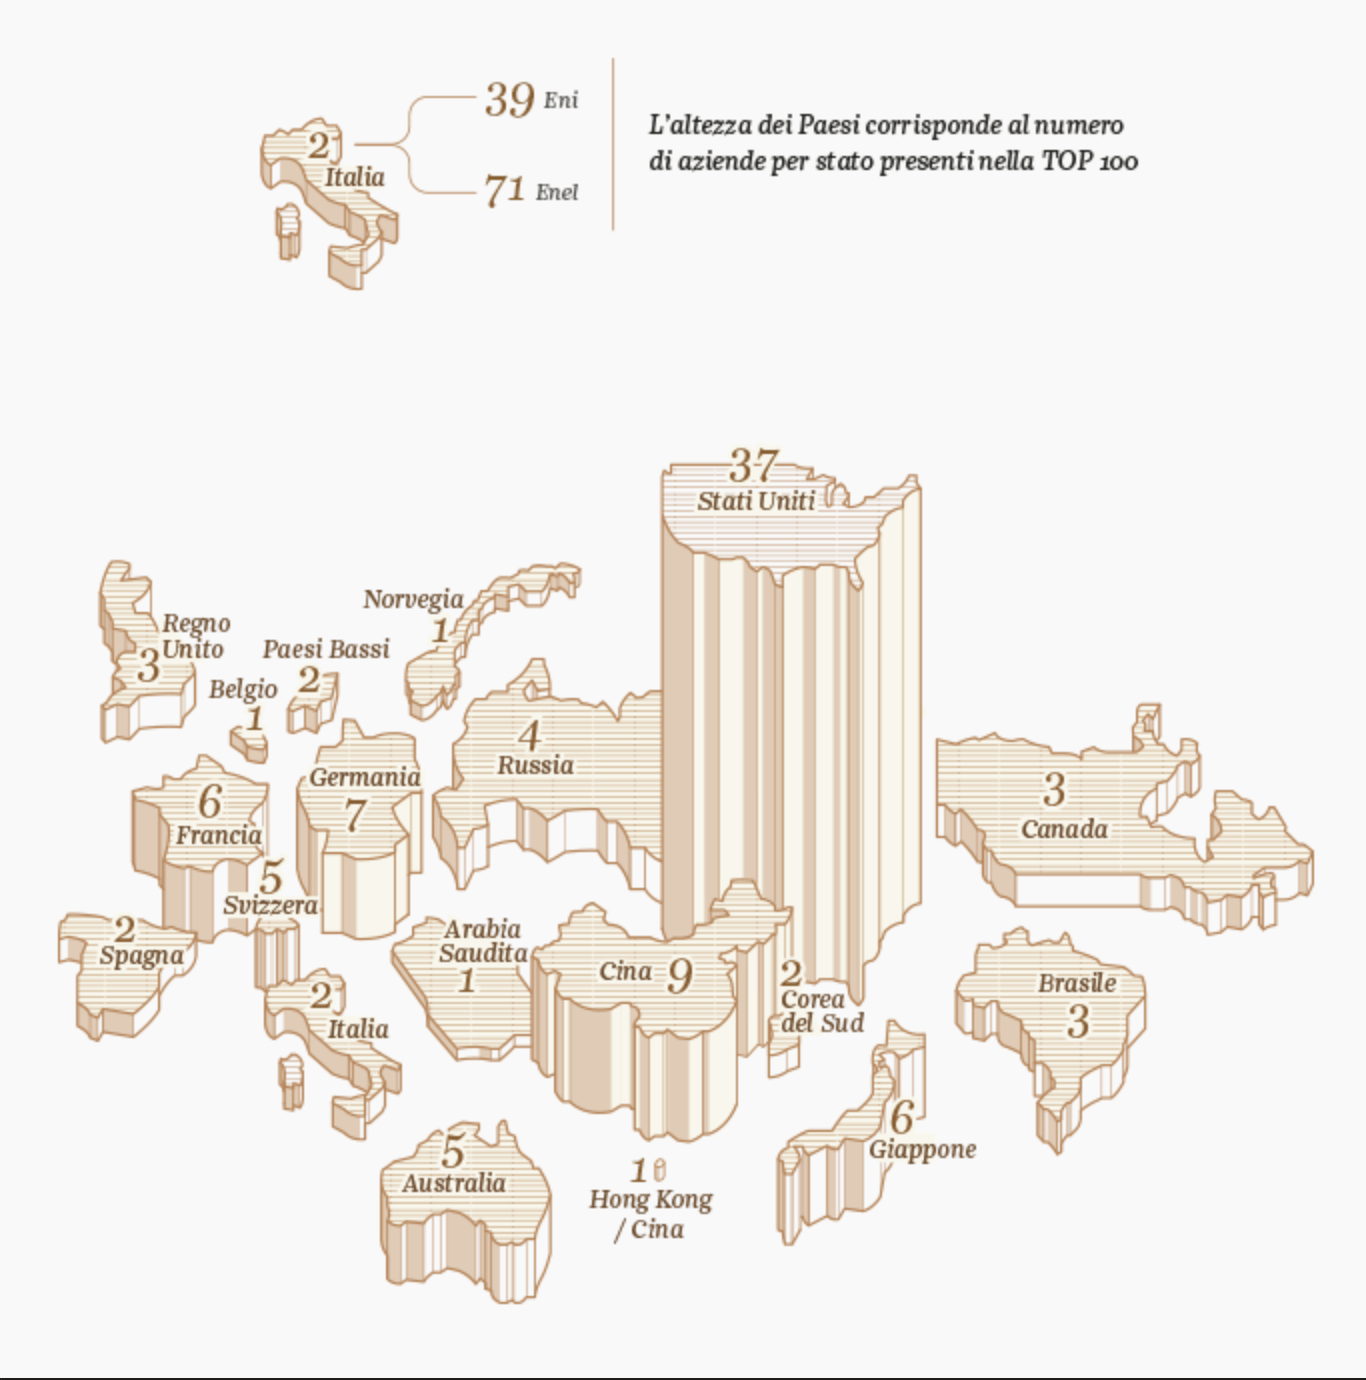
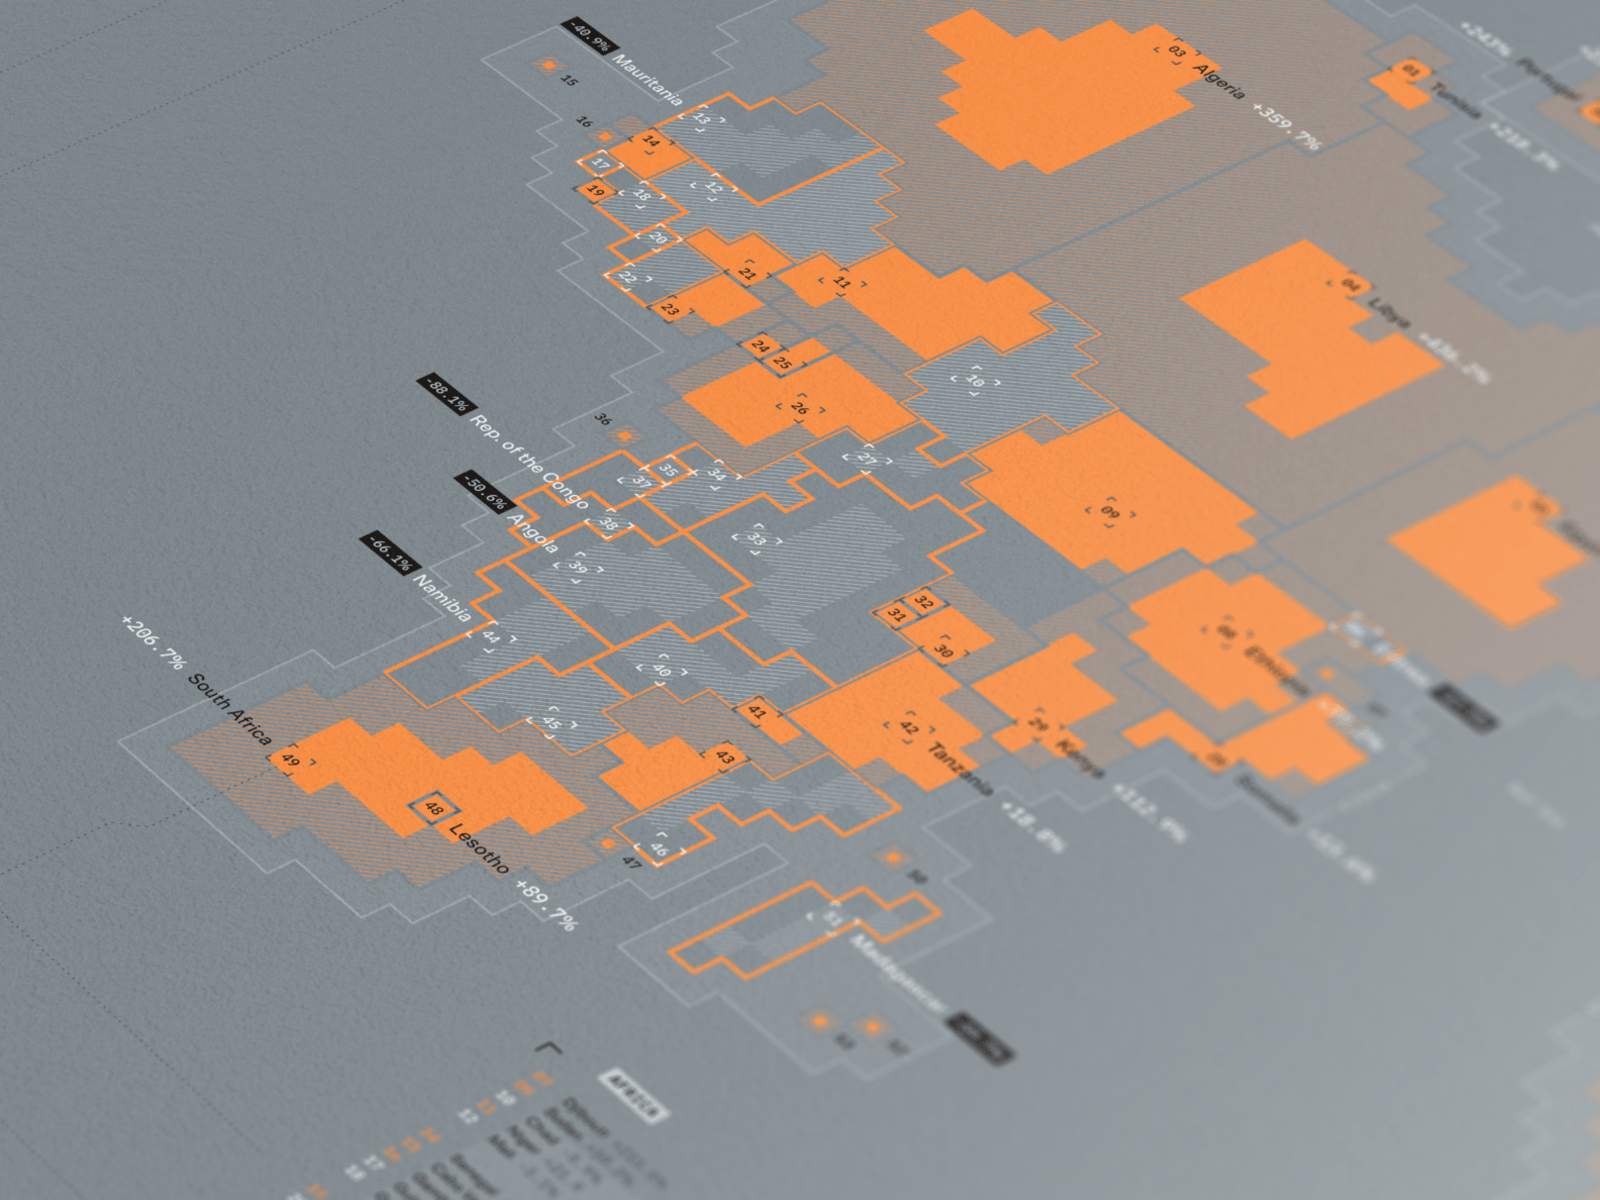
Cartogram

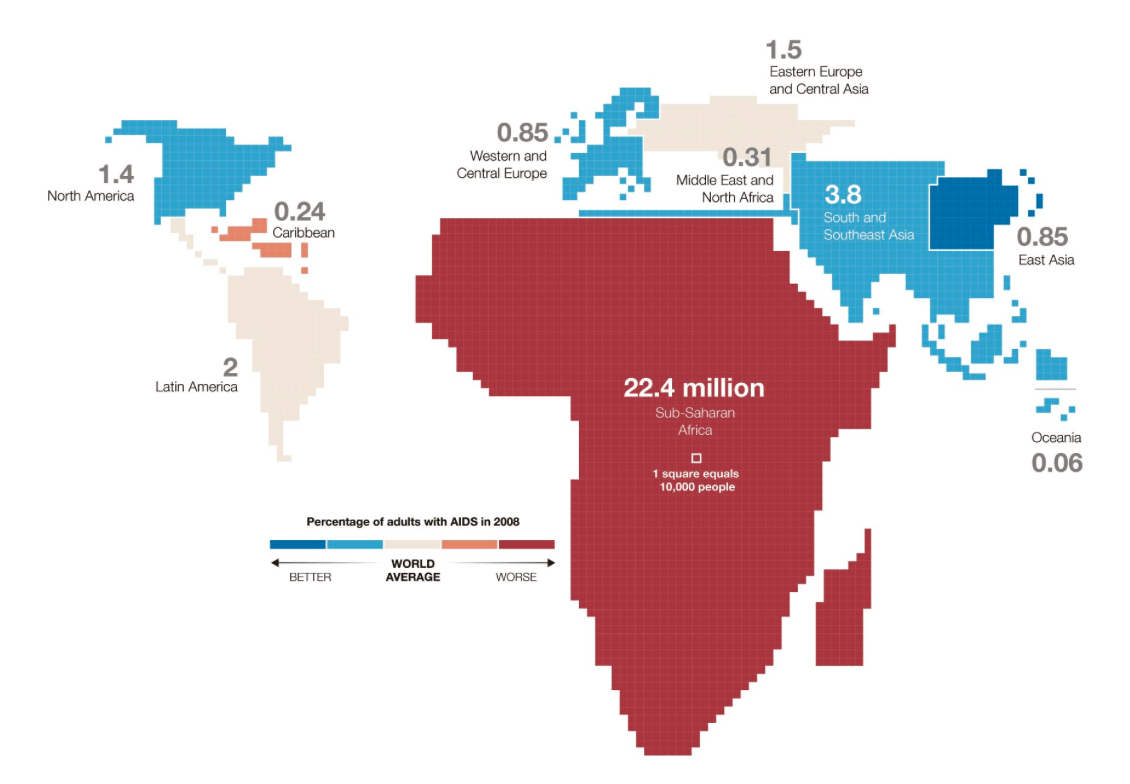
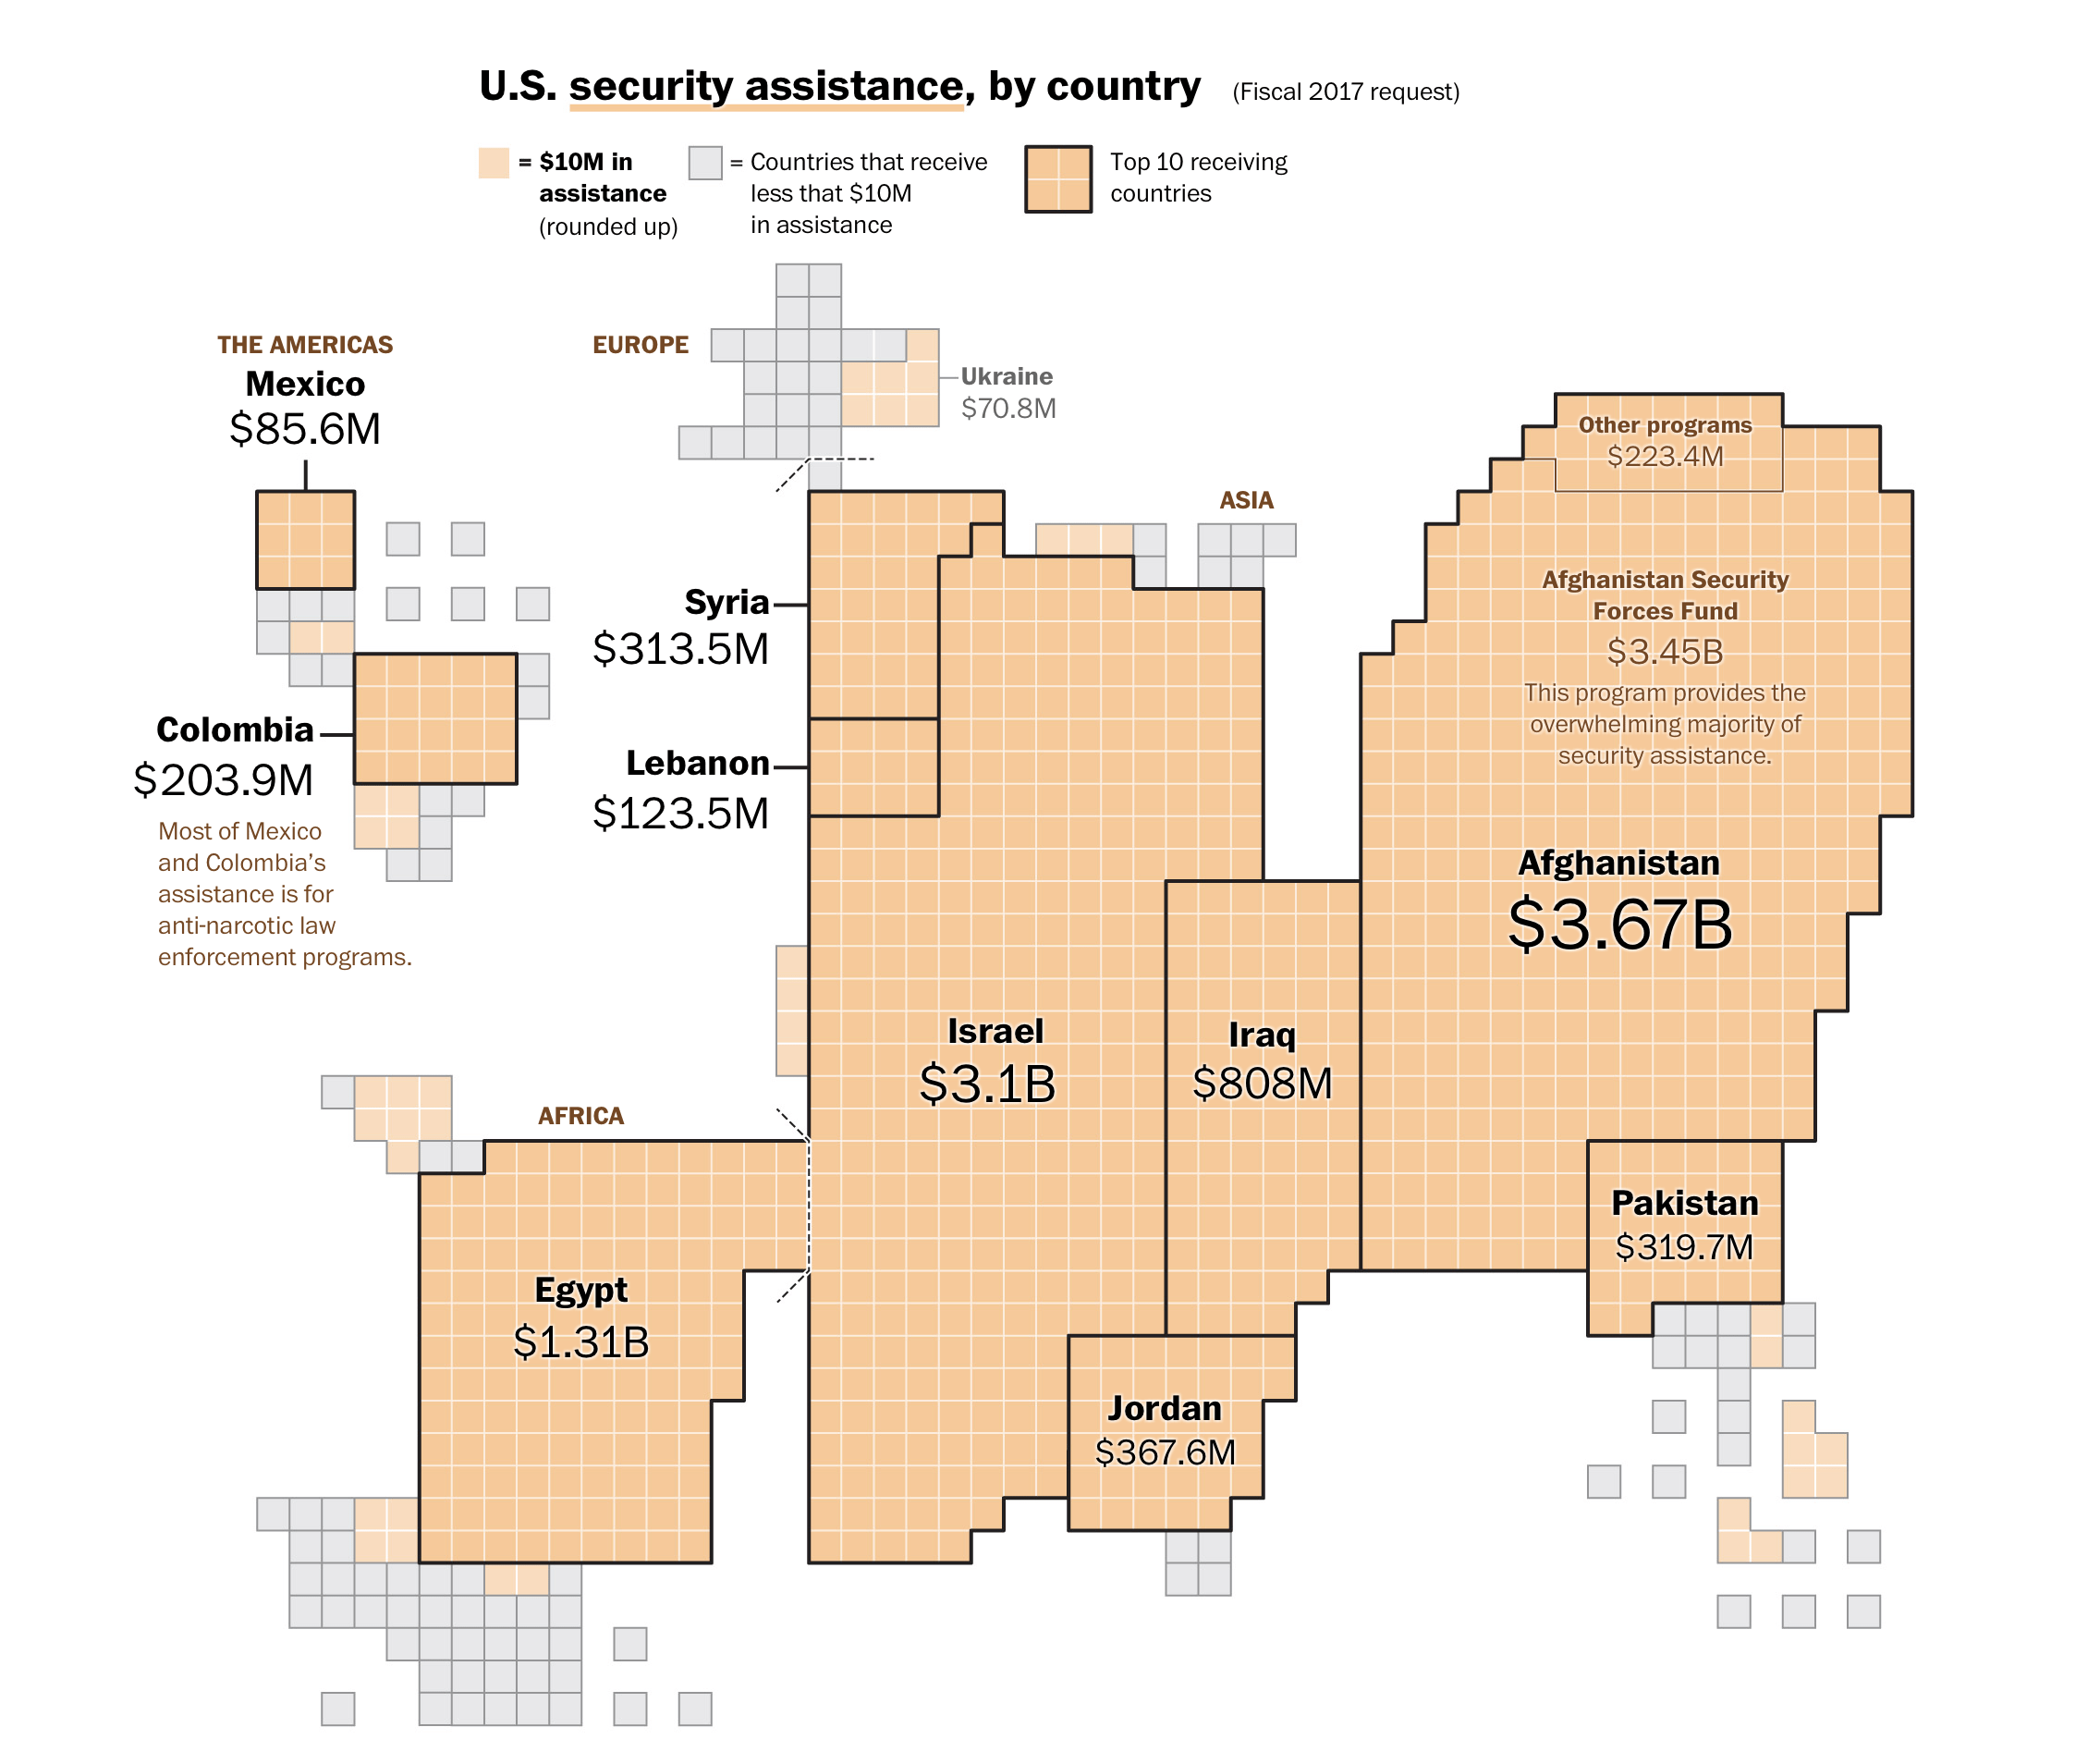
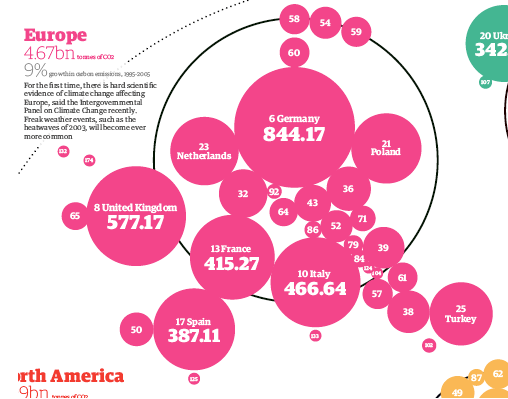
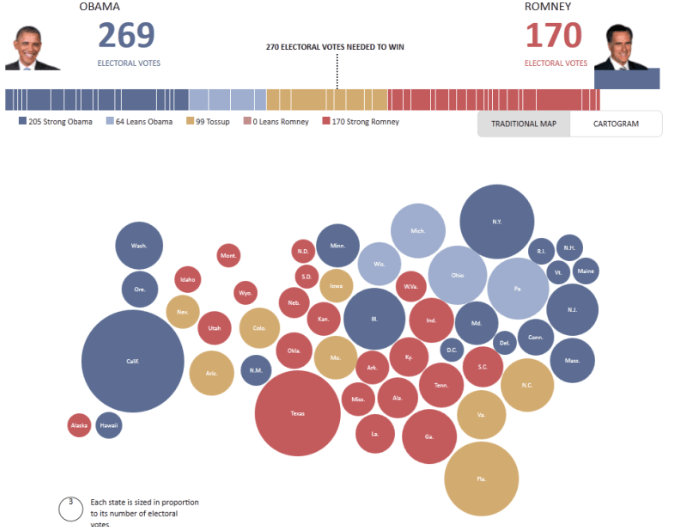
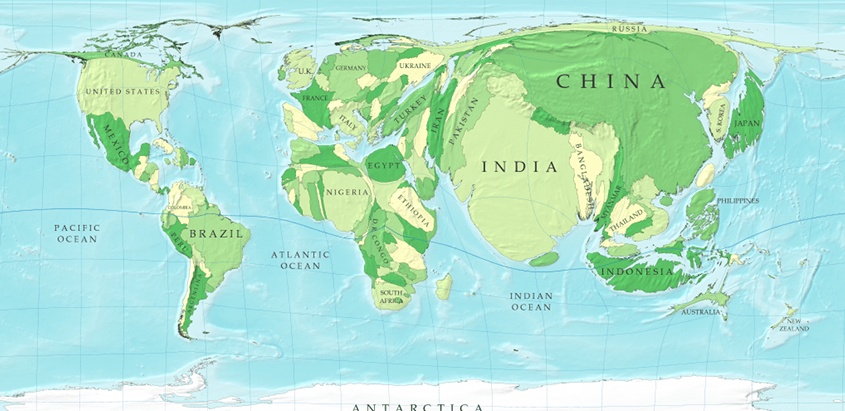
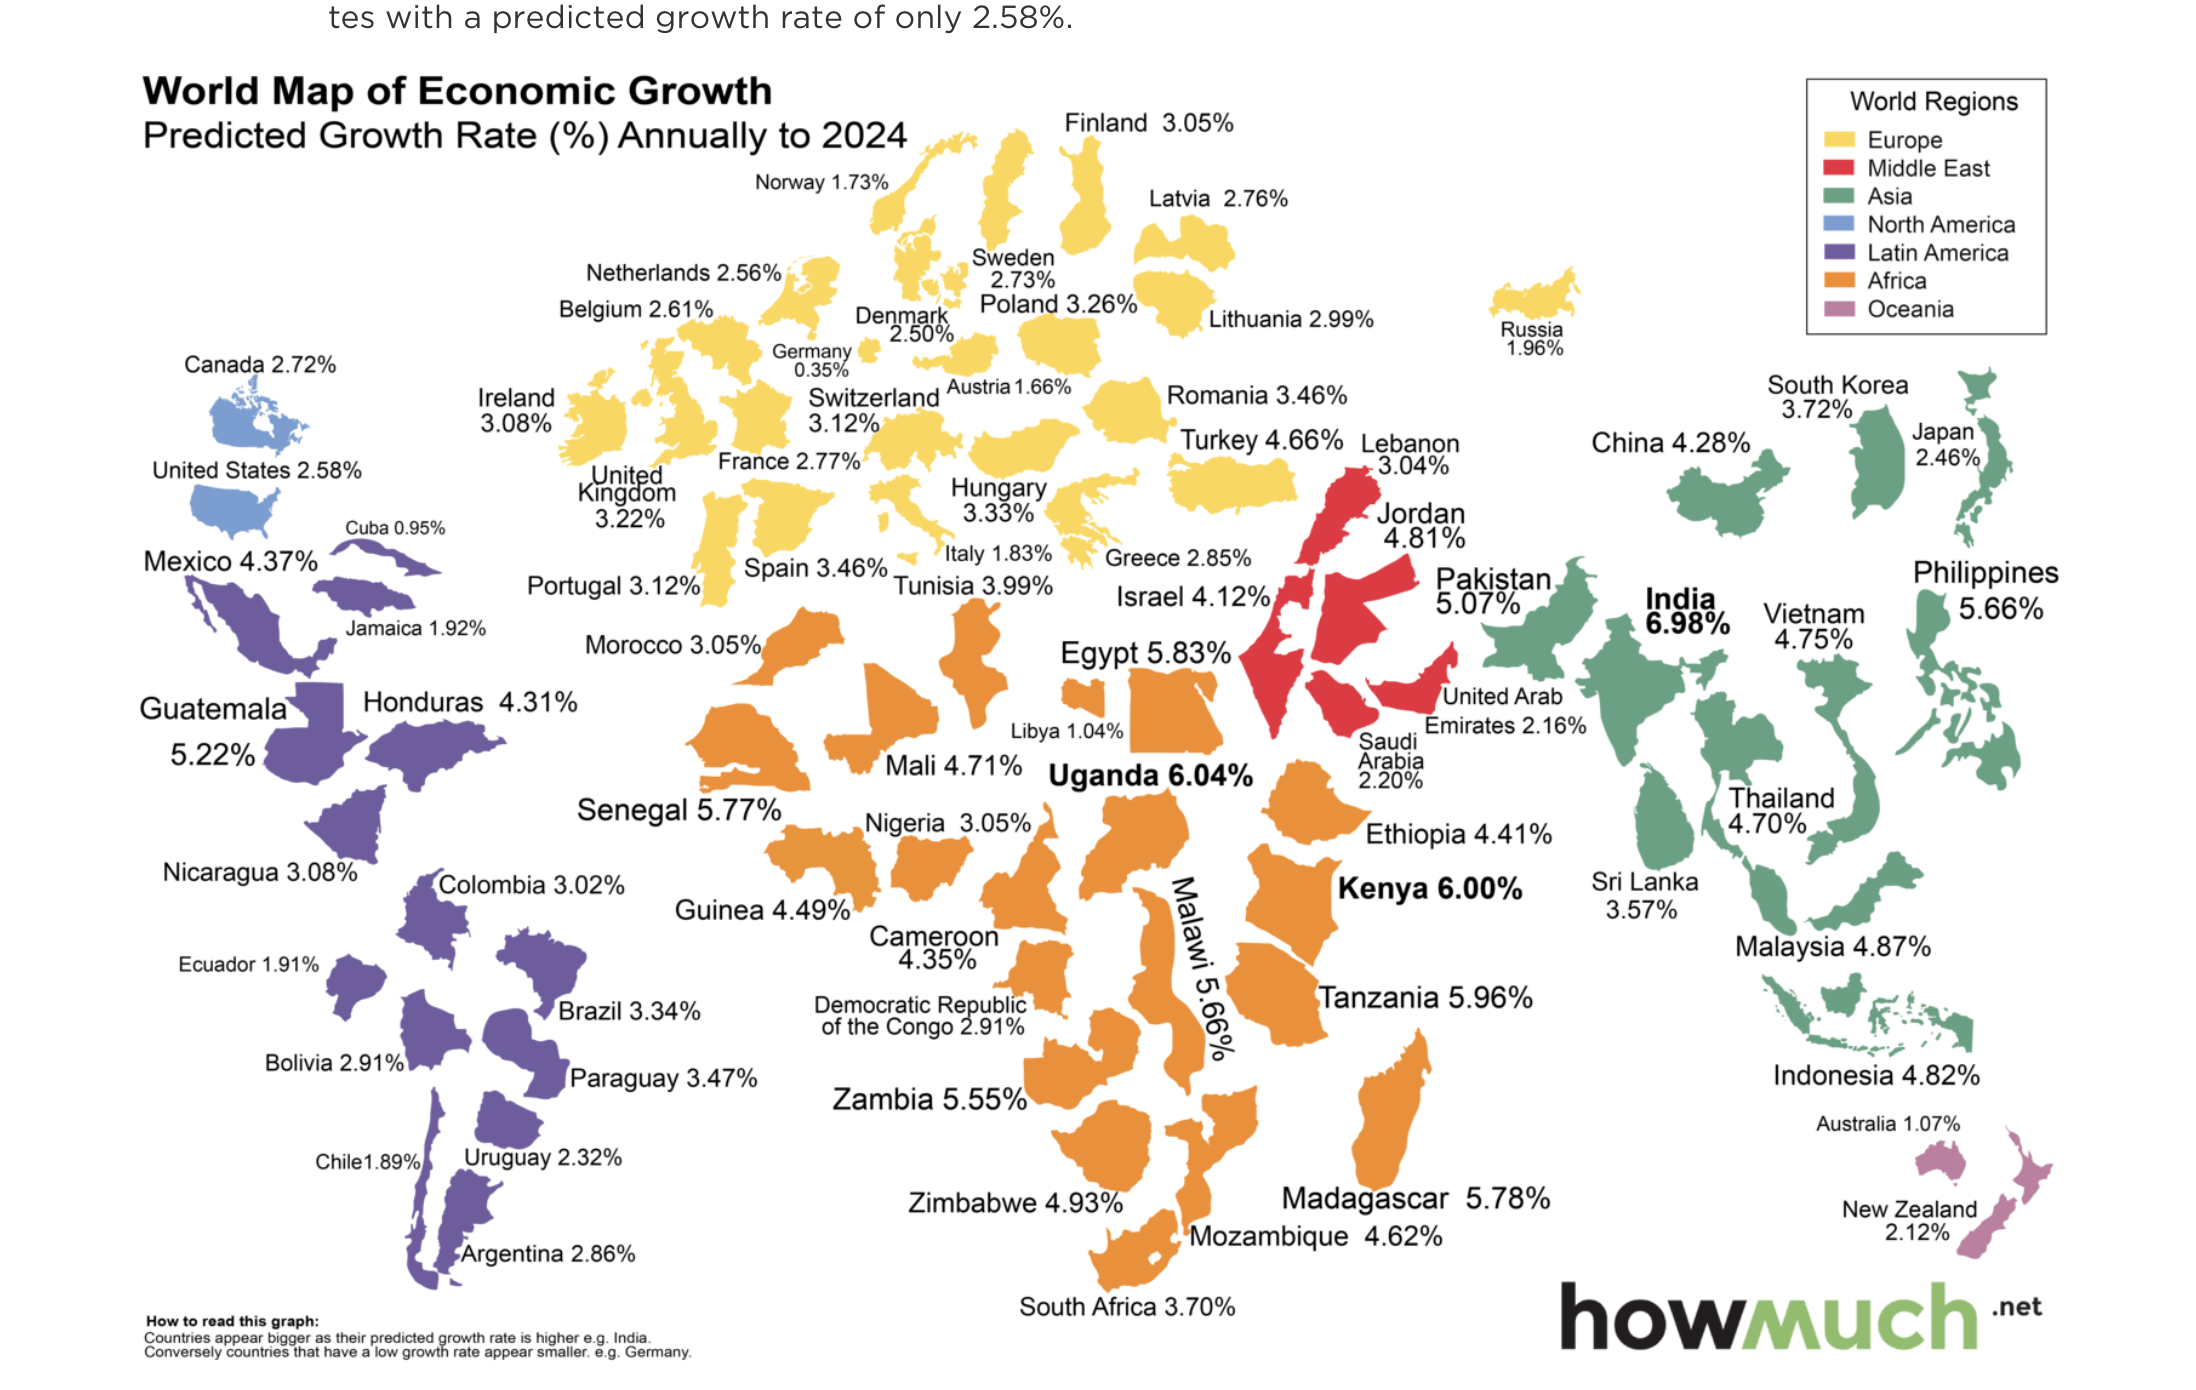
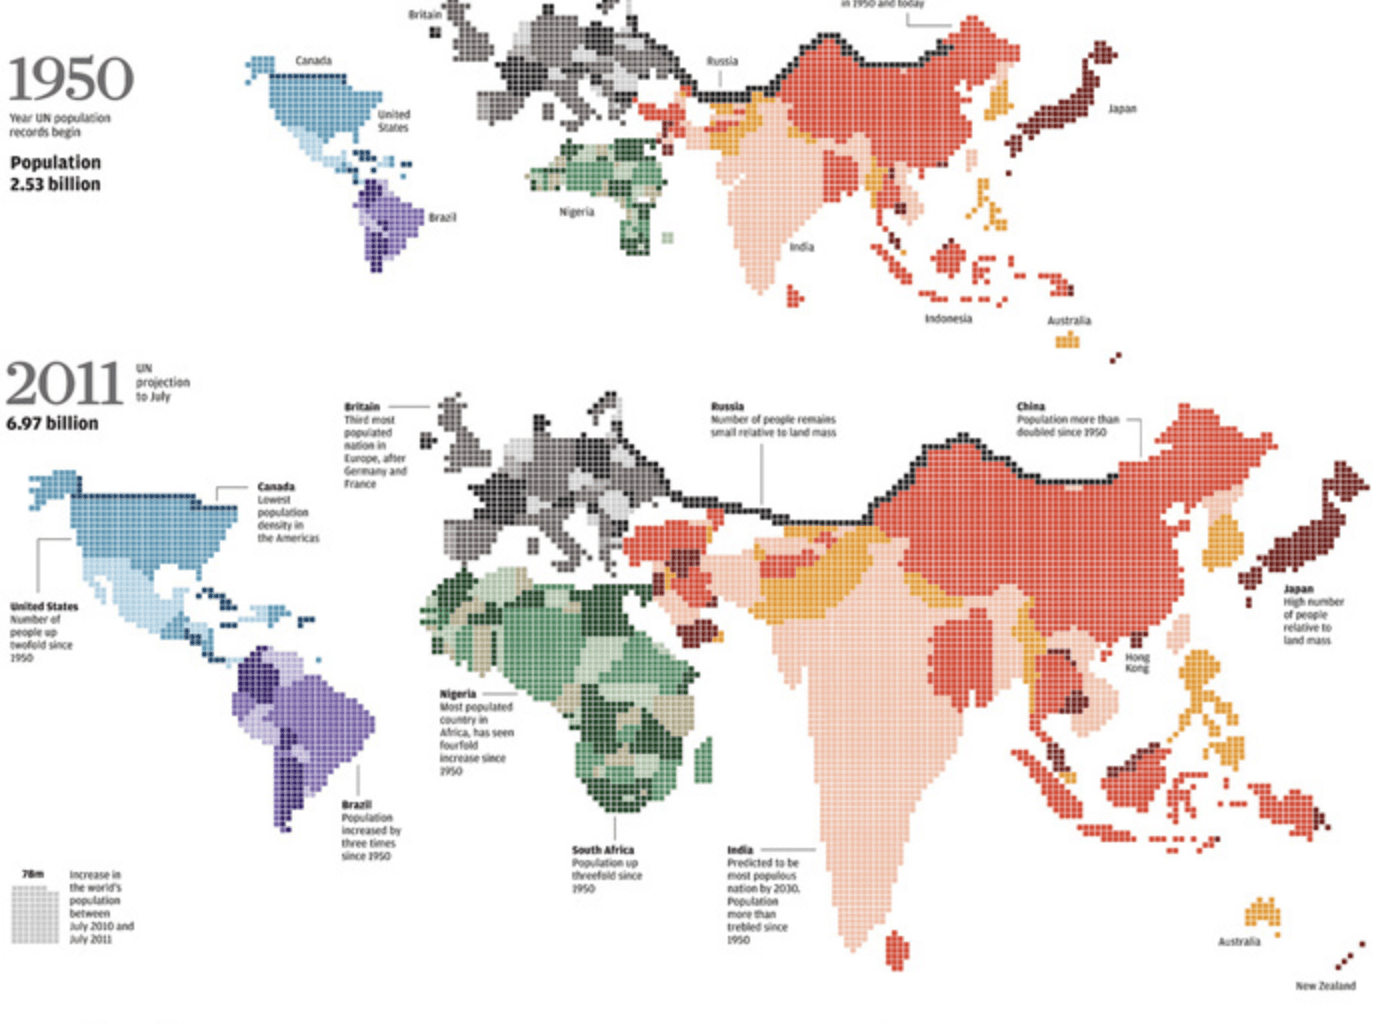
Cartograms distort the shape of geographic regions so that the area directly encodes a data variable. A common example is to redraw every country in the world sizing it proportionally to population or GDP. Can be done by circles, squares or distorted maps by manipulating the initial map.
Primarily used to visualize data related to countries, regions or states, for example votes in elections, population or income.