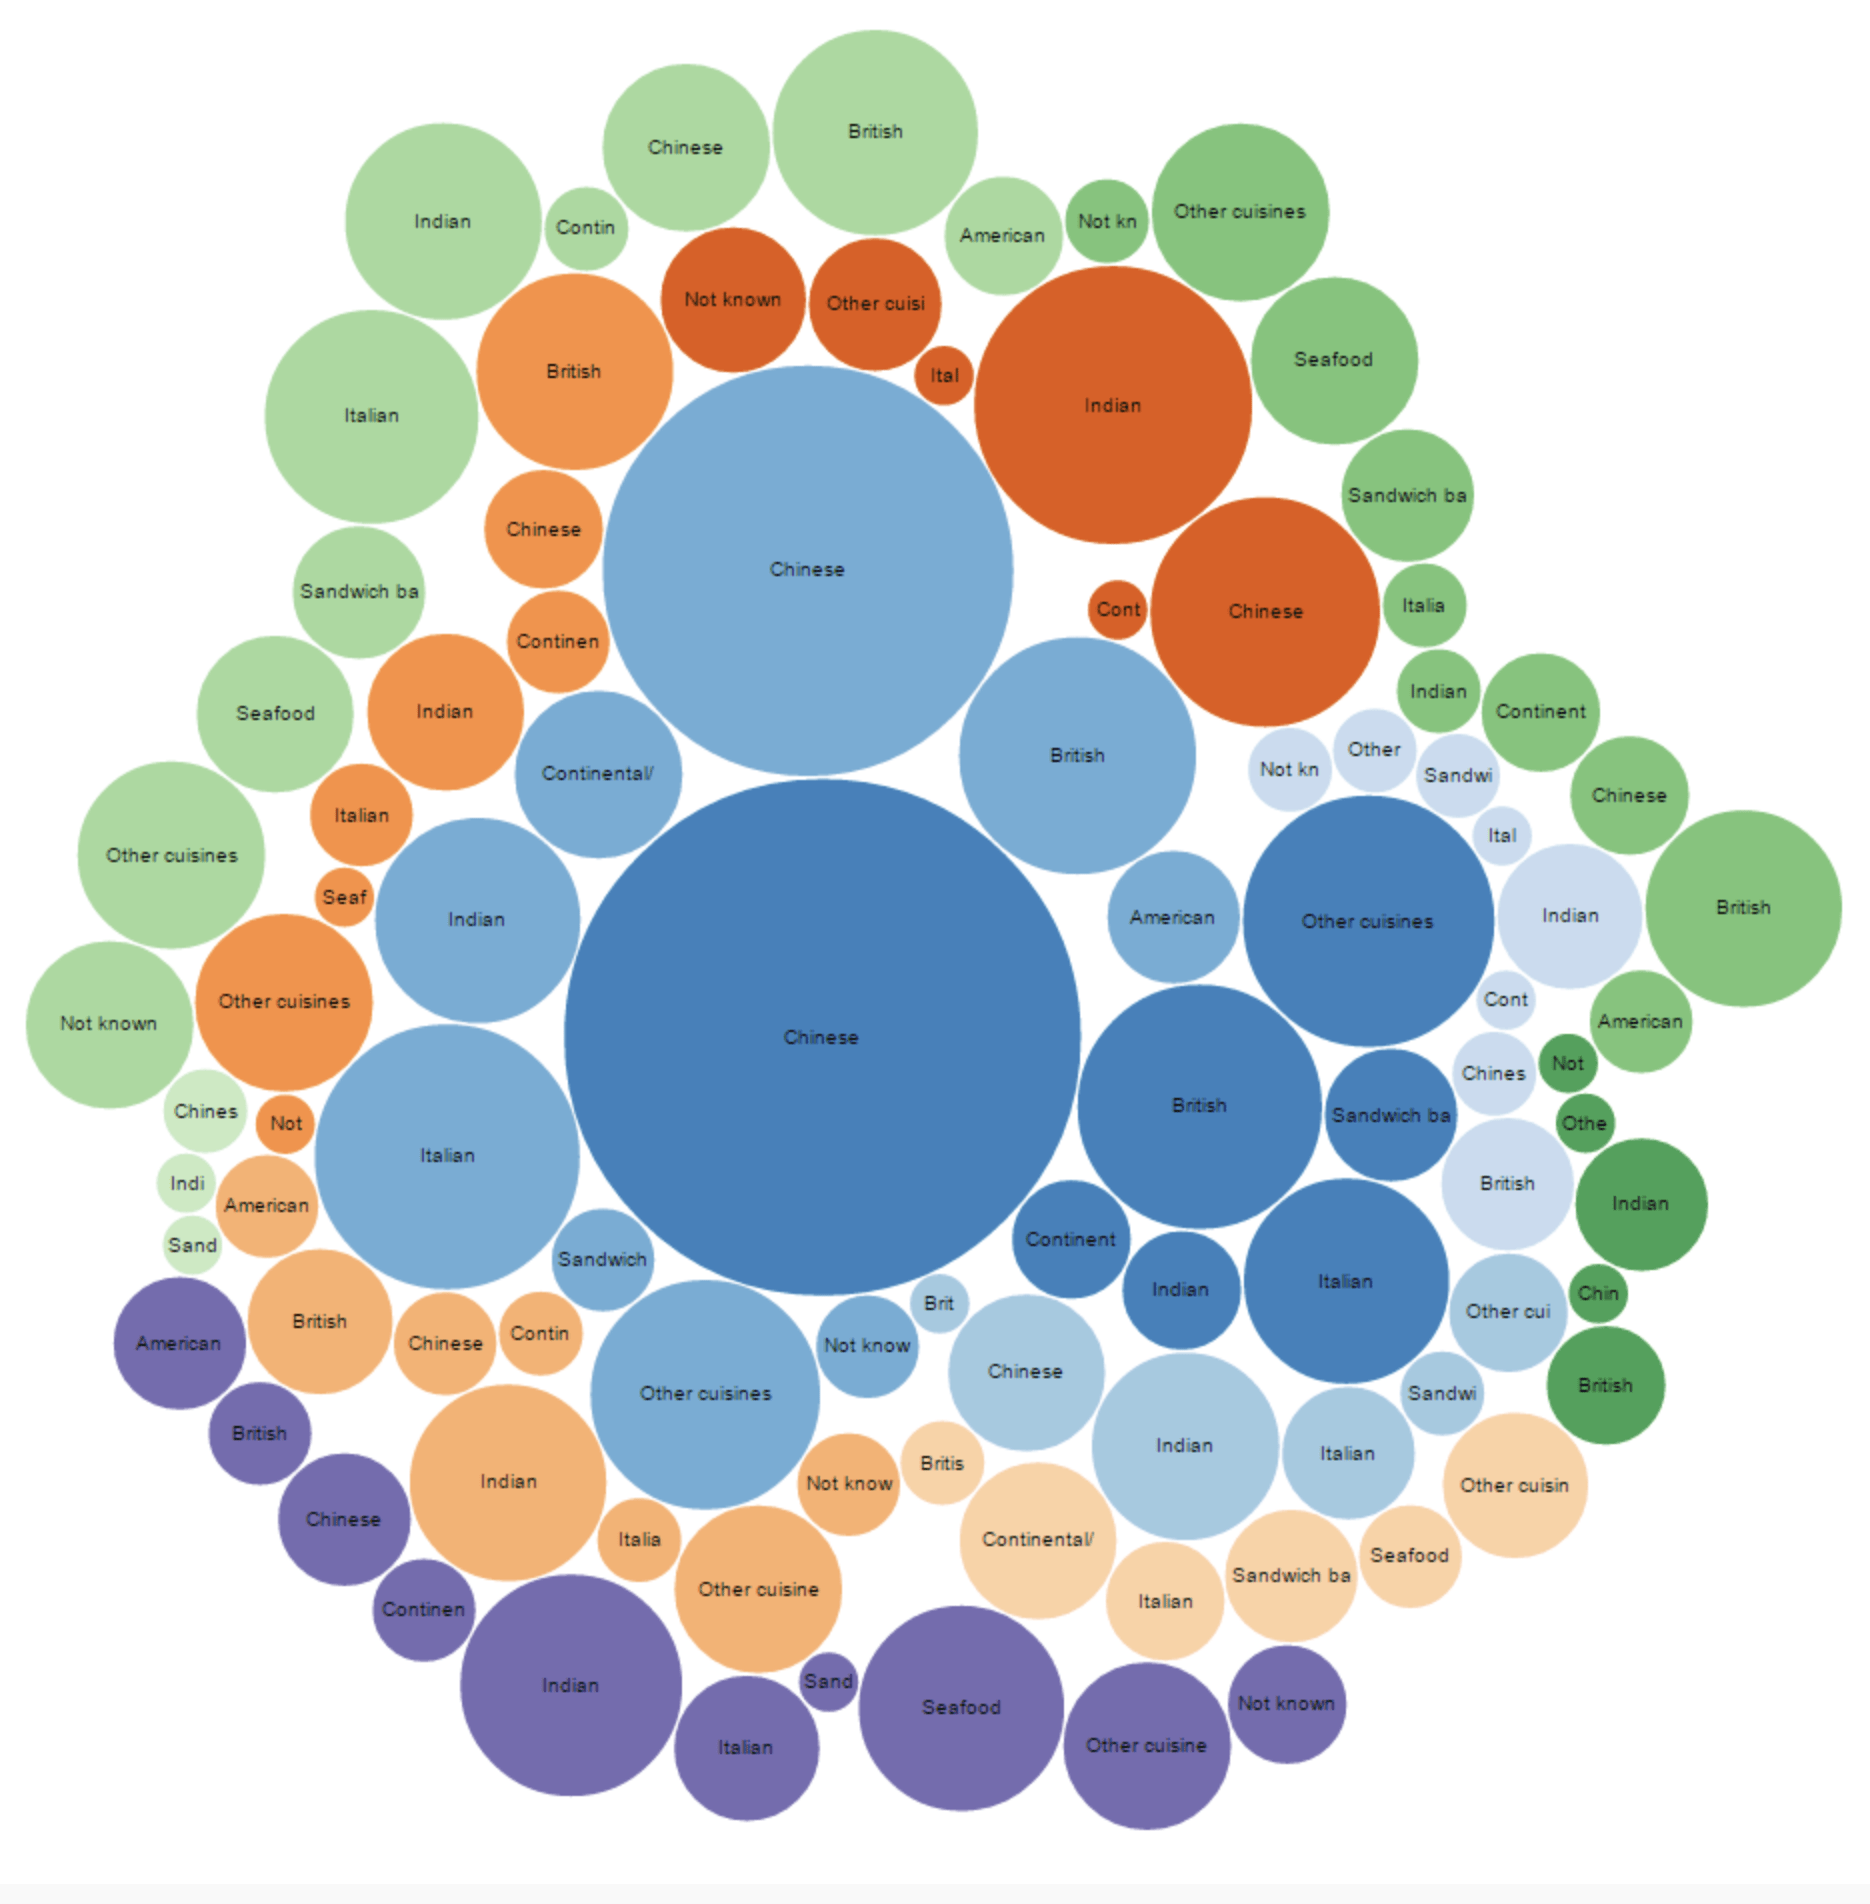
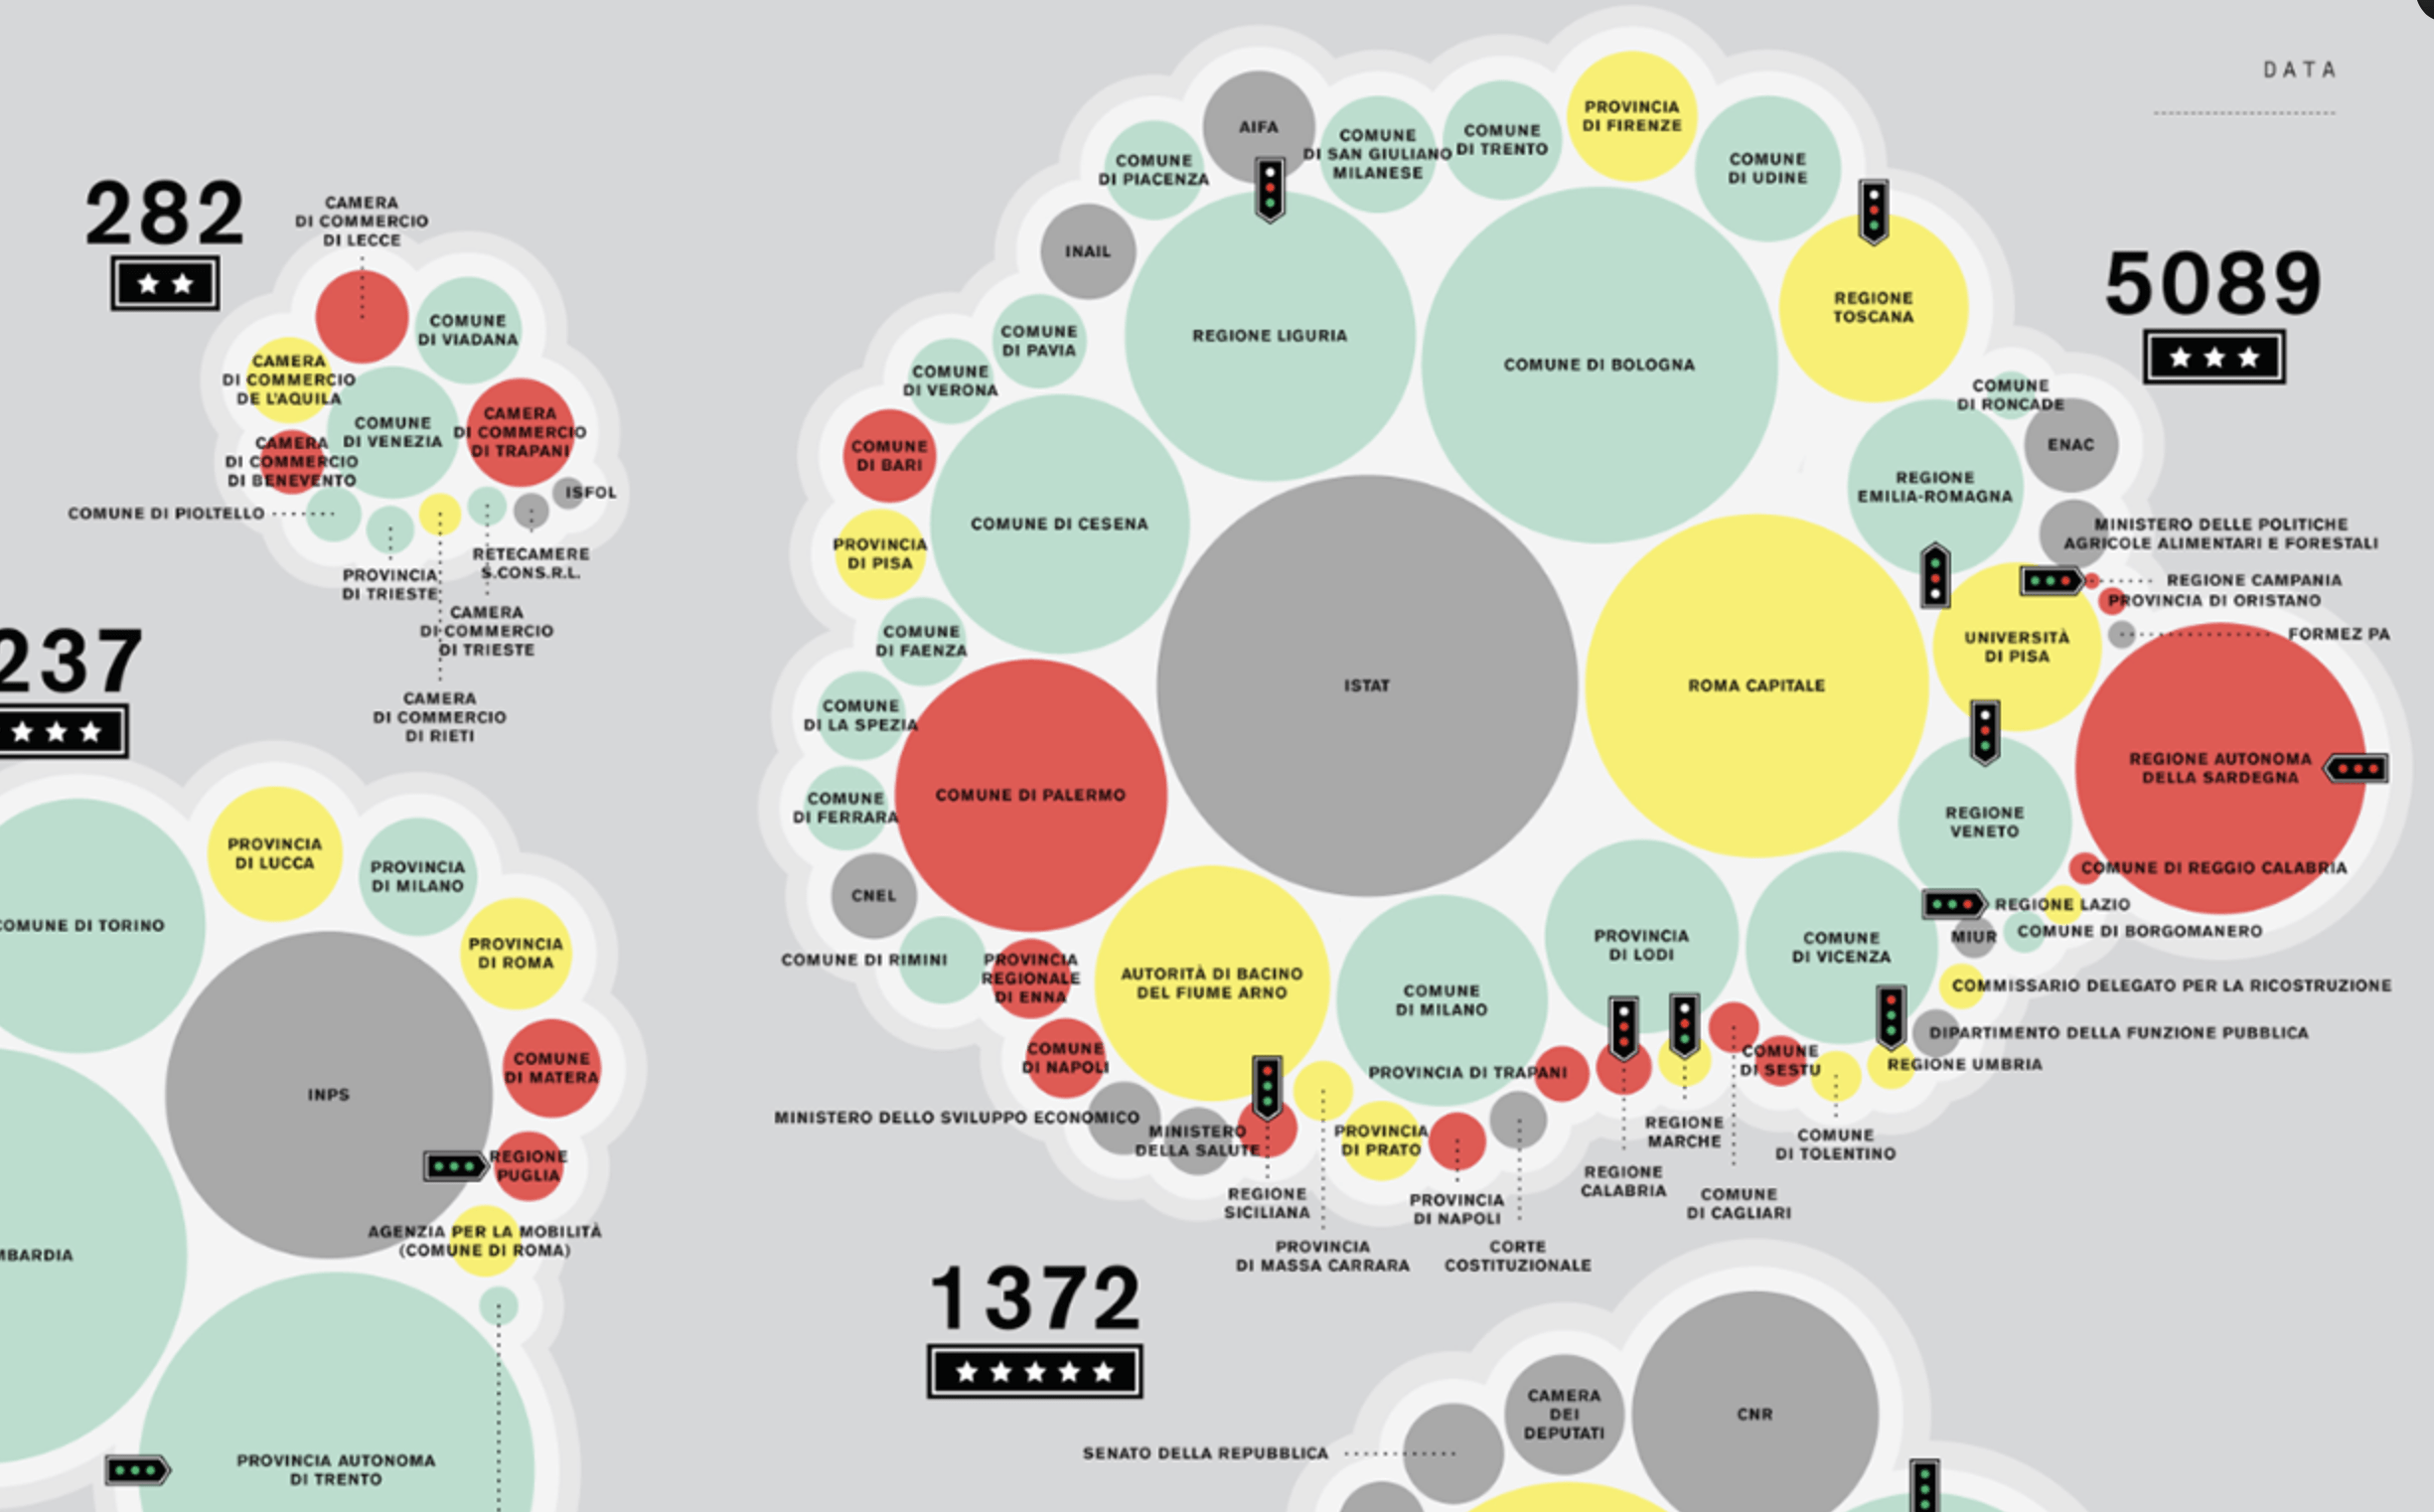
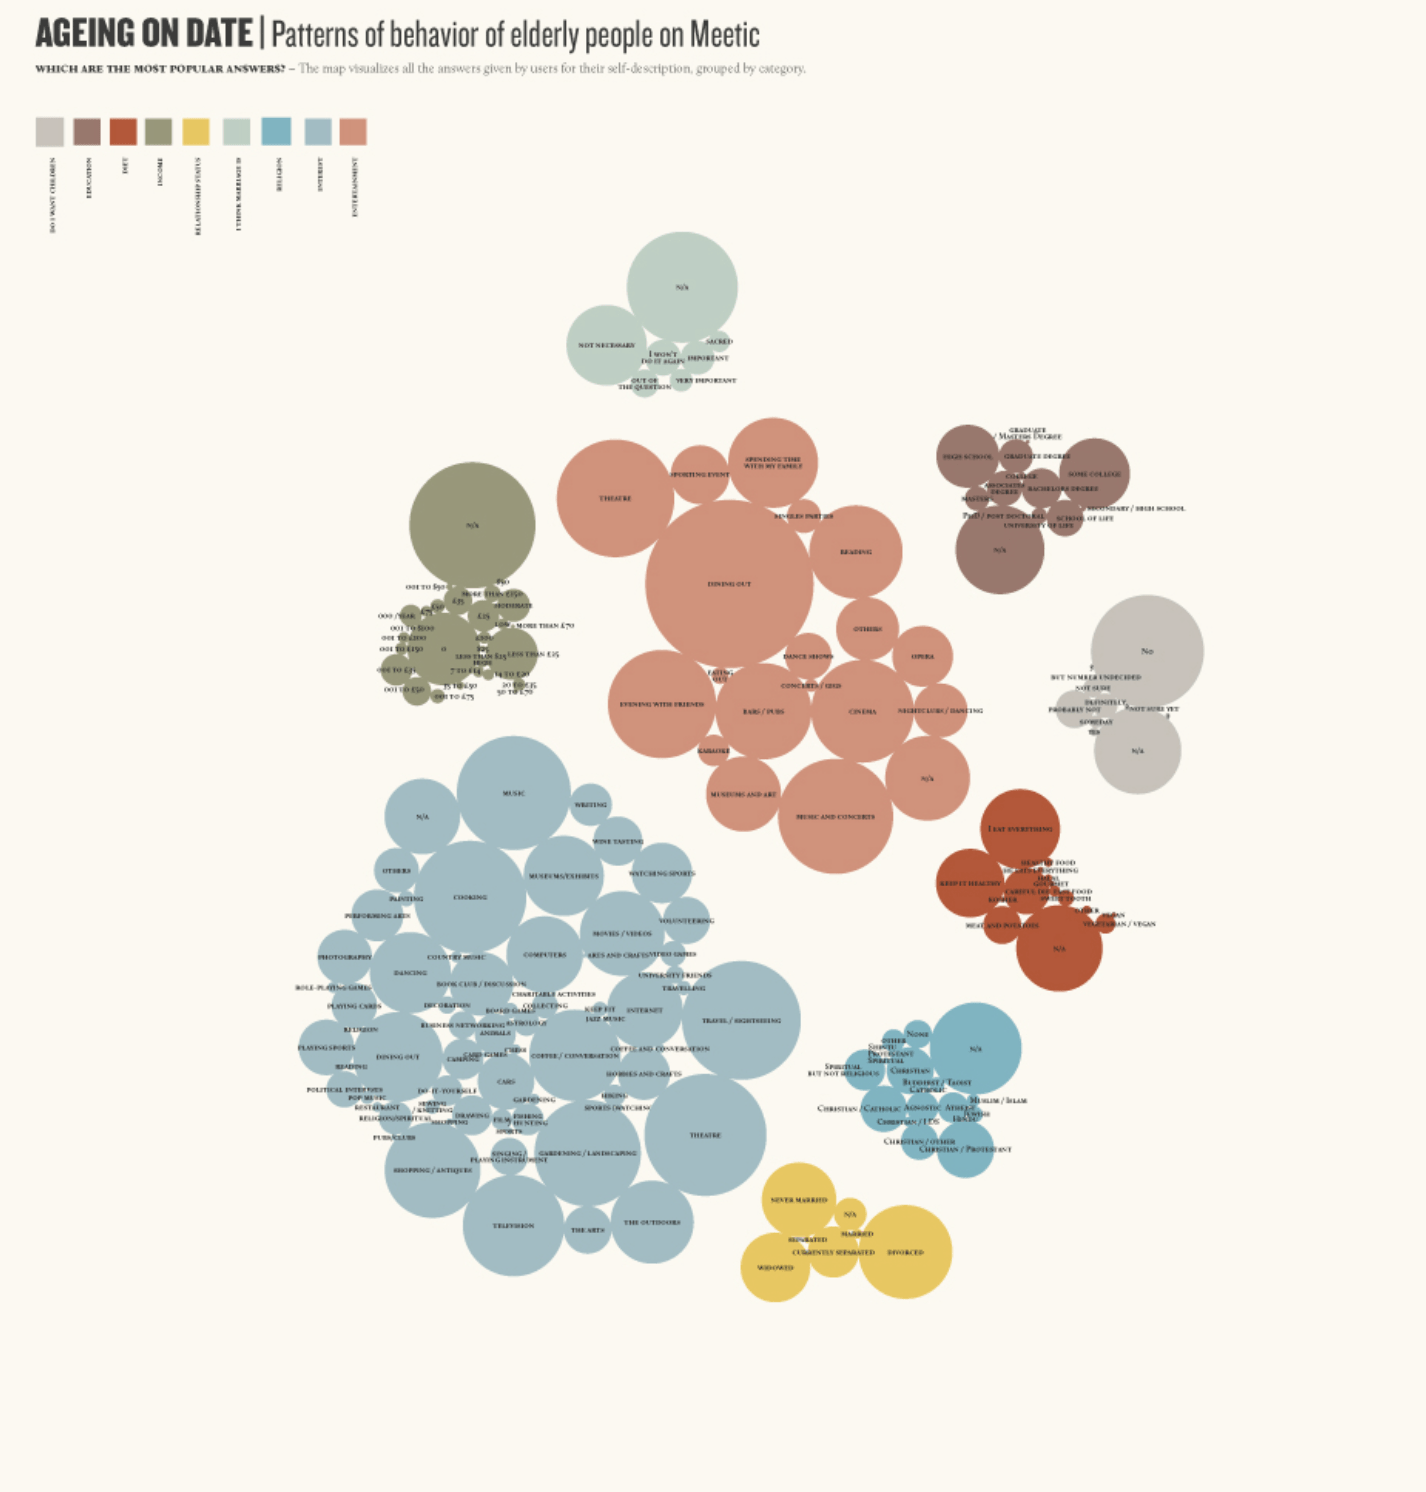
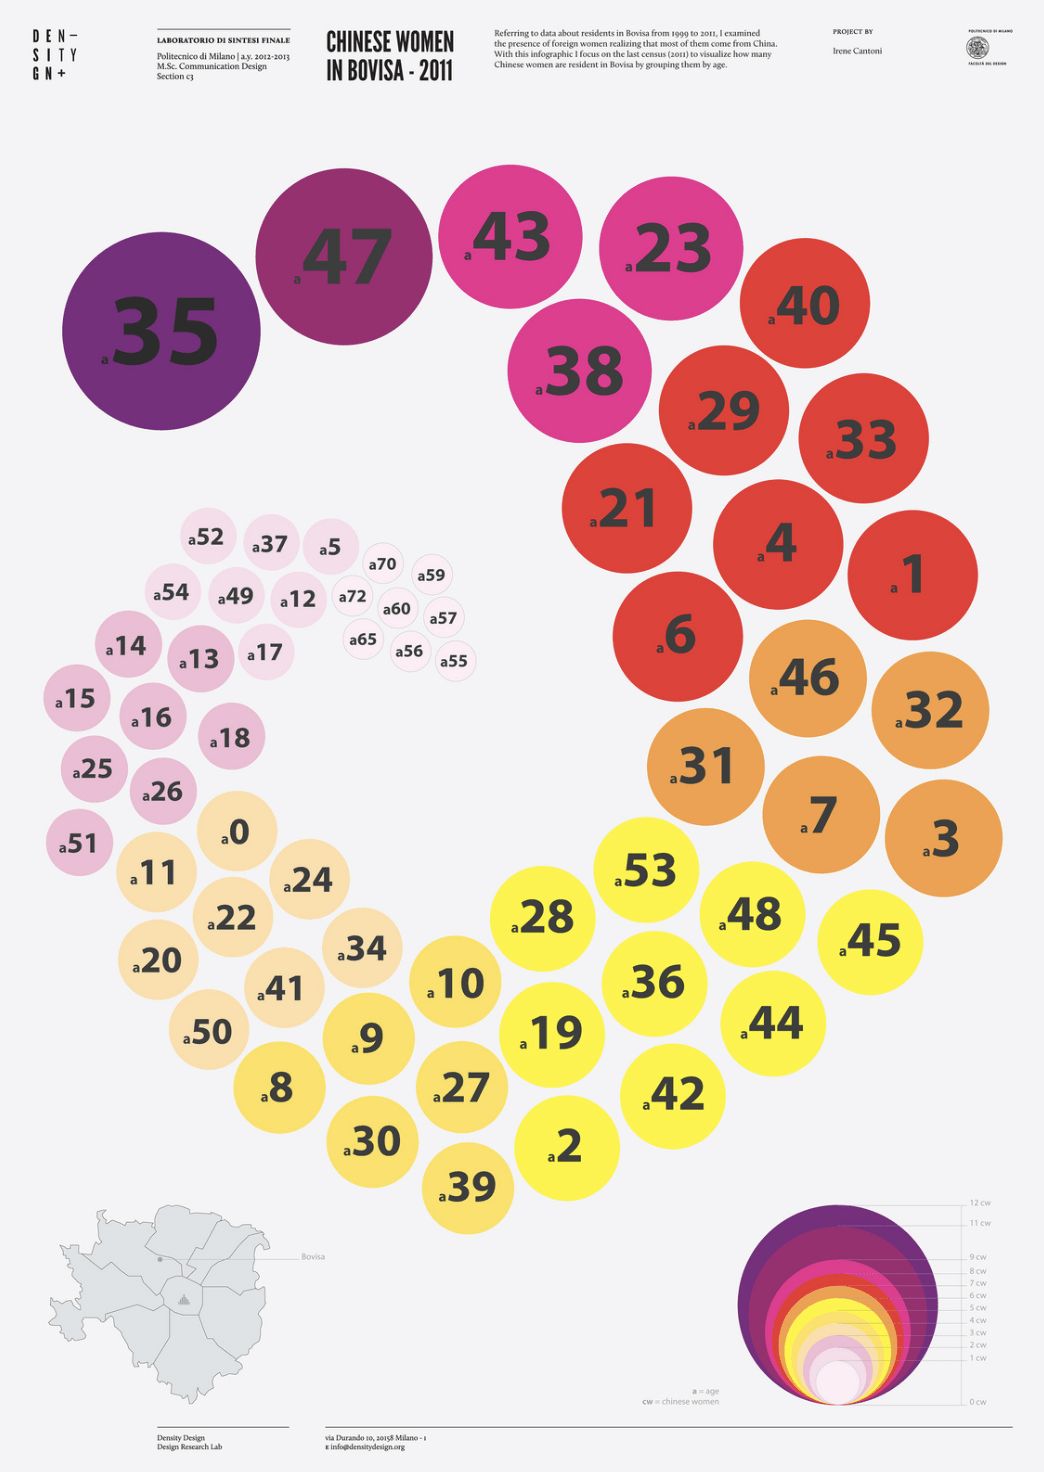
Clustered Force Layout
Also called: Grouped Bubble Chart, Clustered Bubble Chart
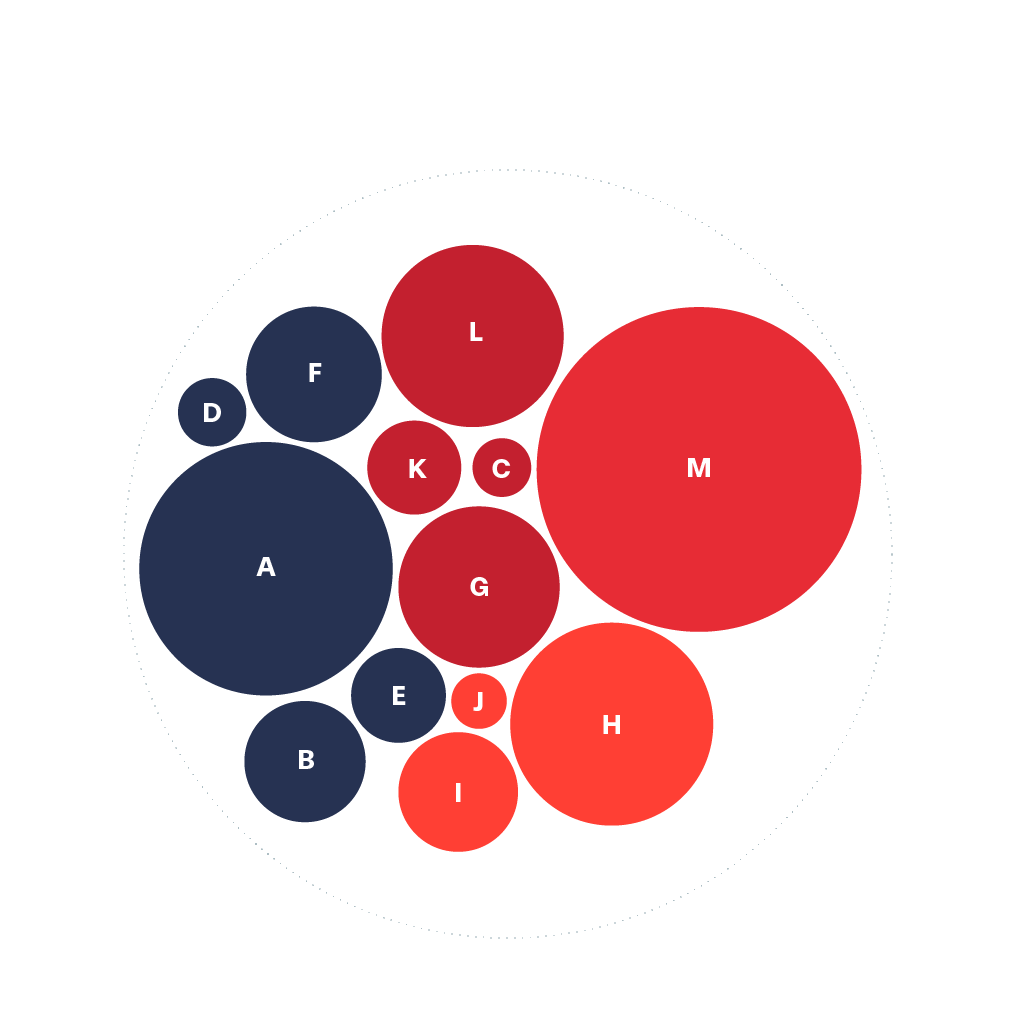
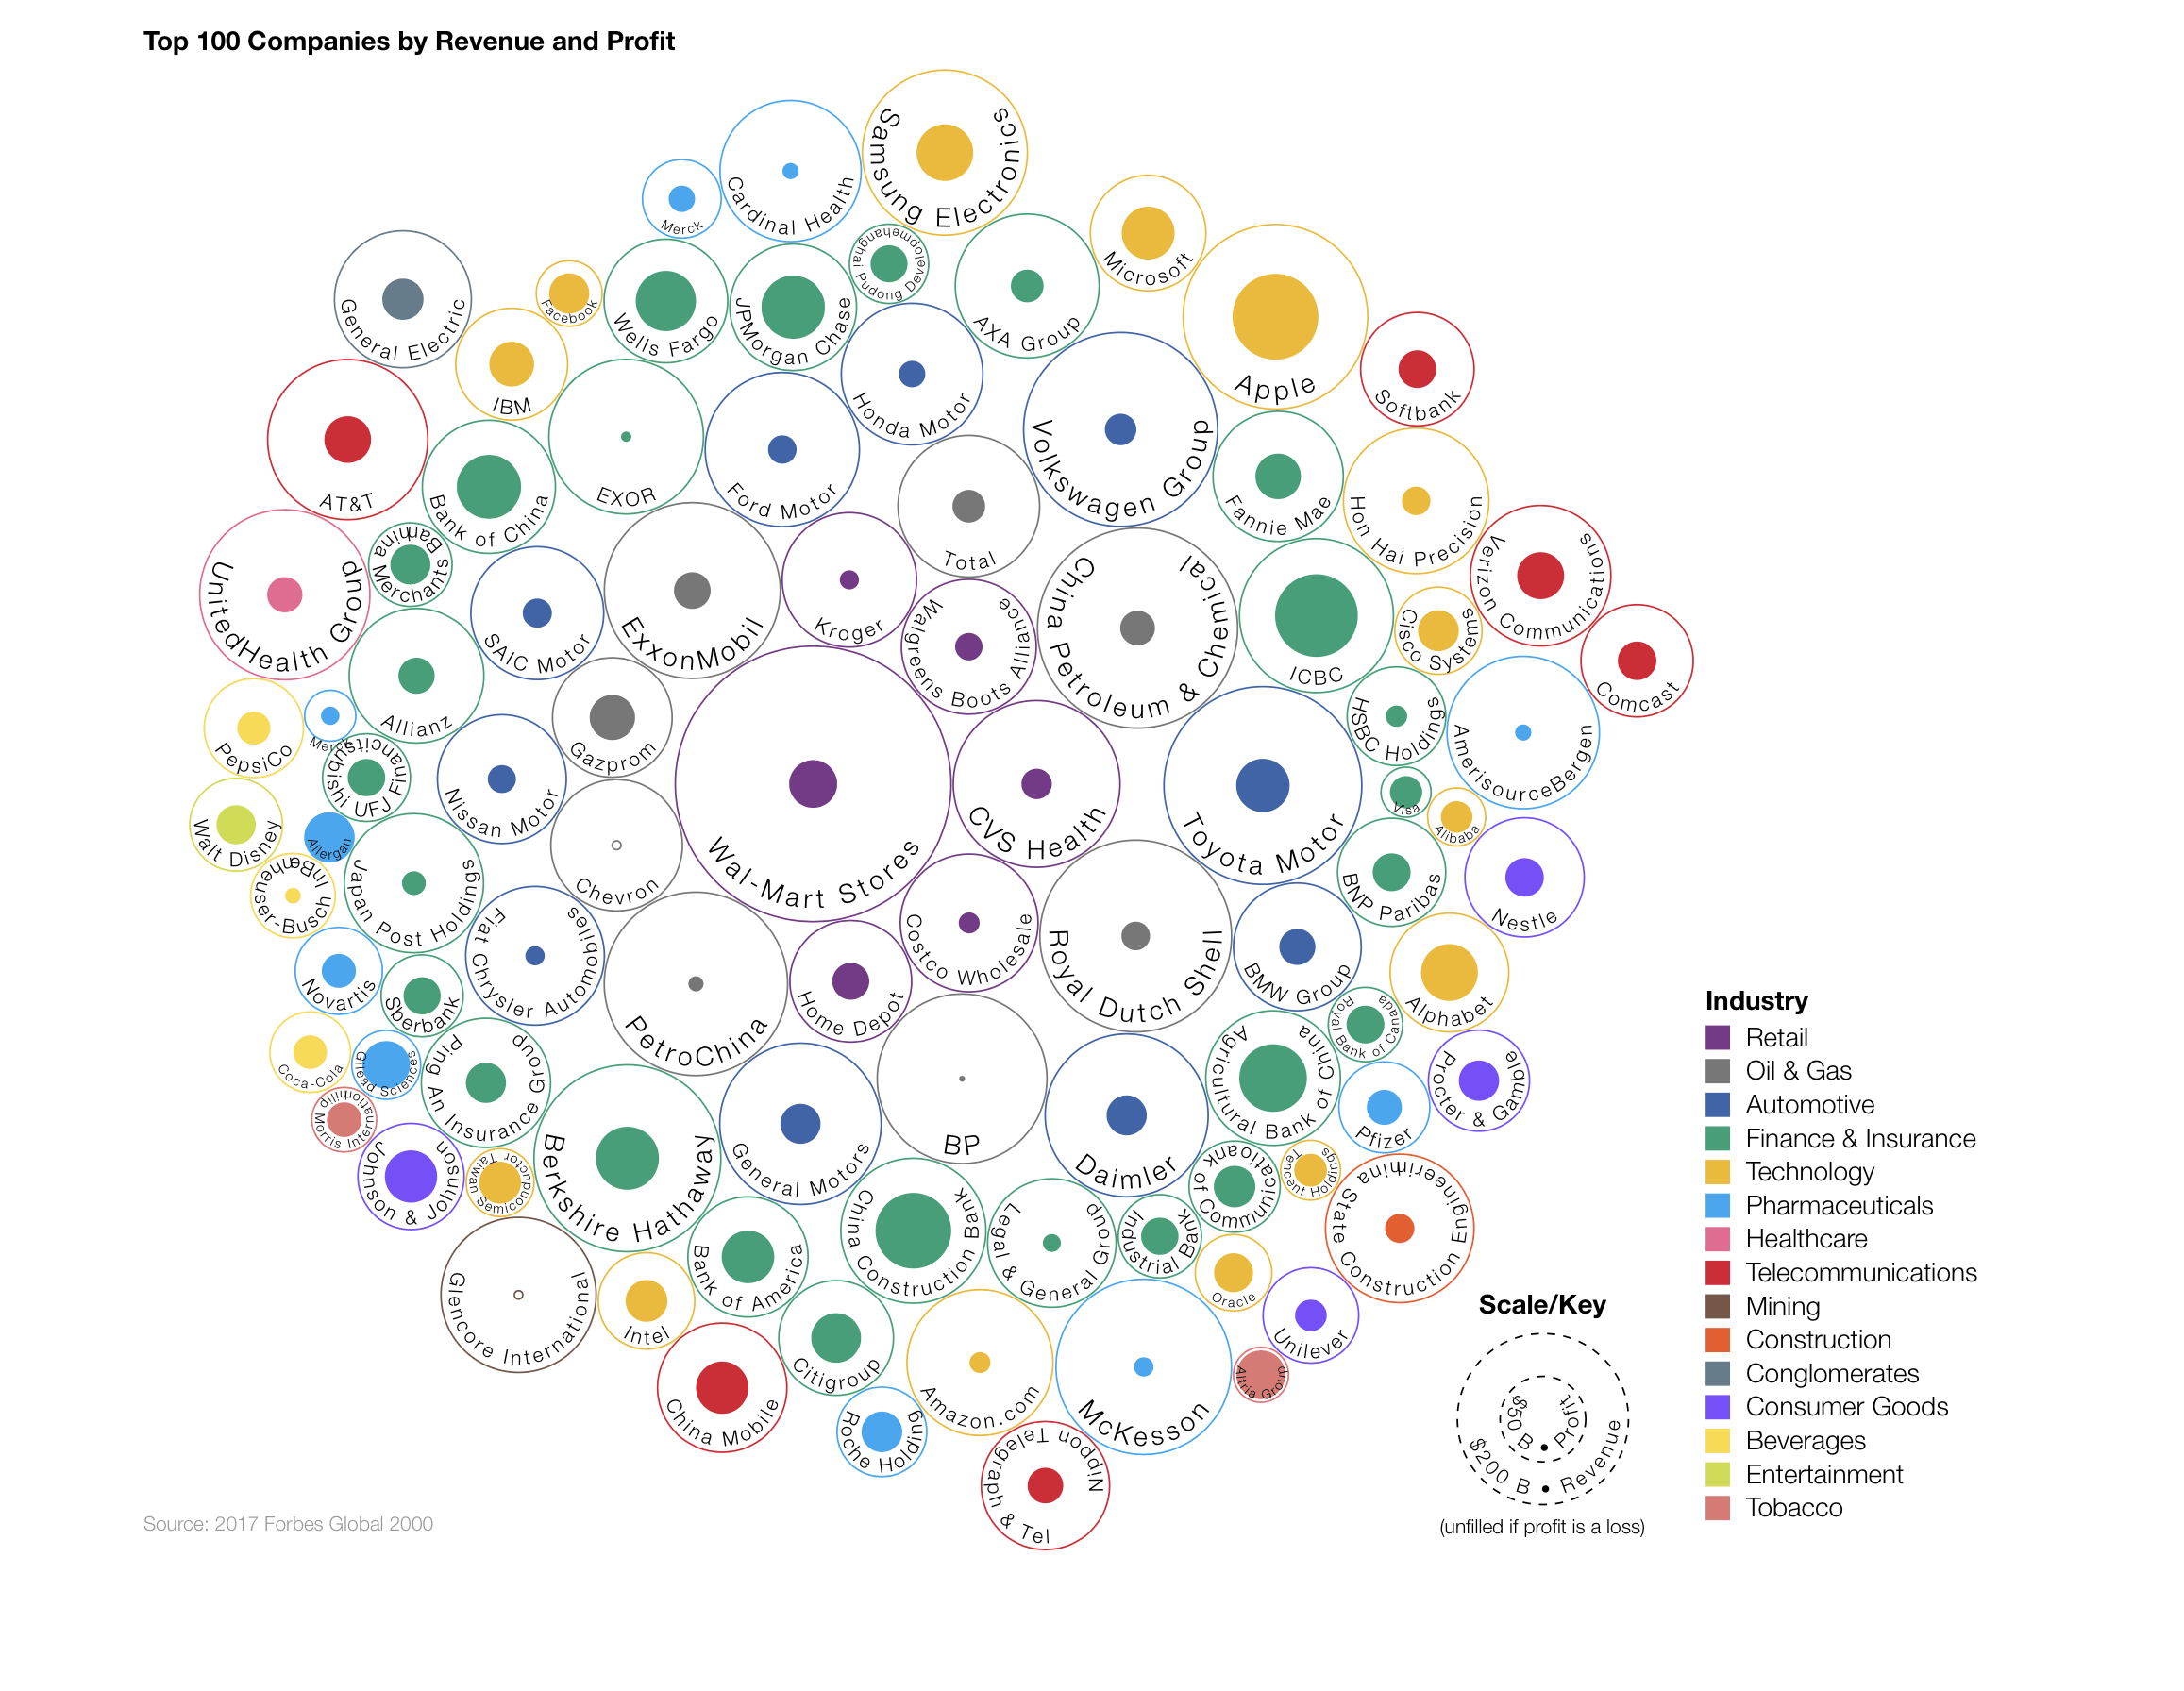
Nested circles allow to represent hierarchies and compare values. This visualization is particularly effective to show the proportion between elements through their areas and their position inside a hierarchical structure.