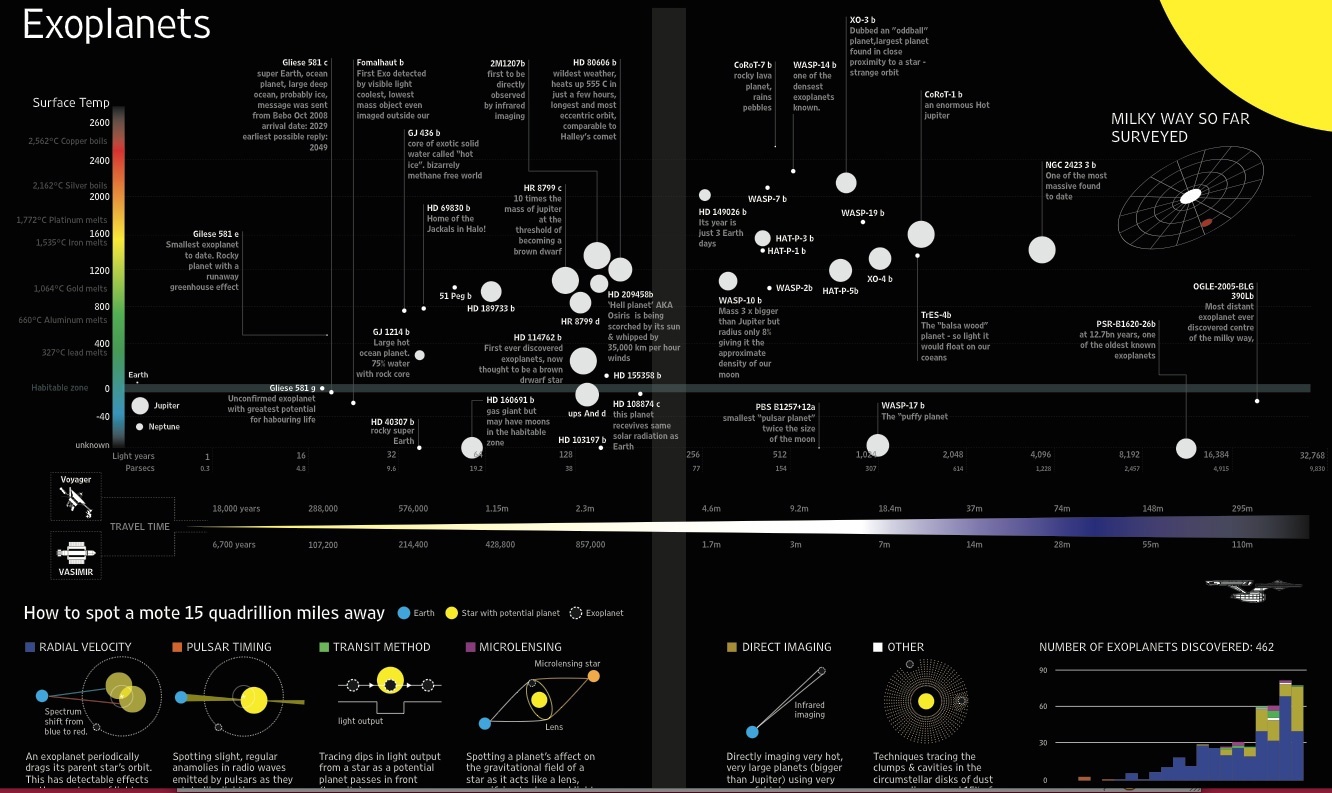
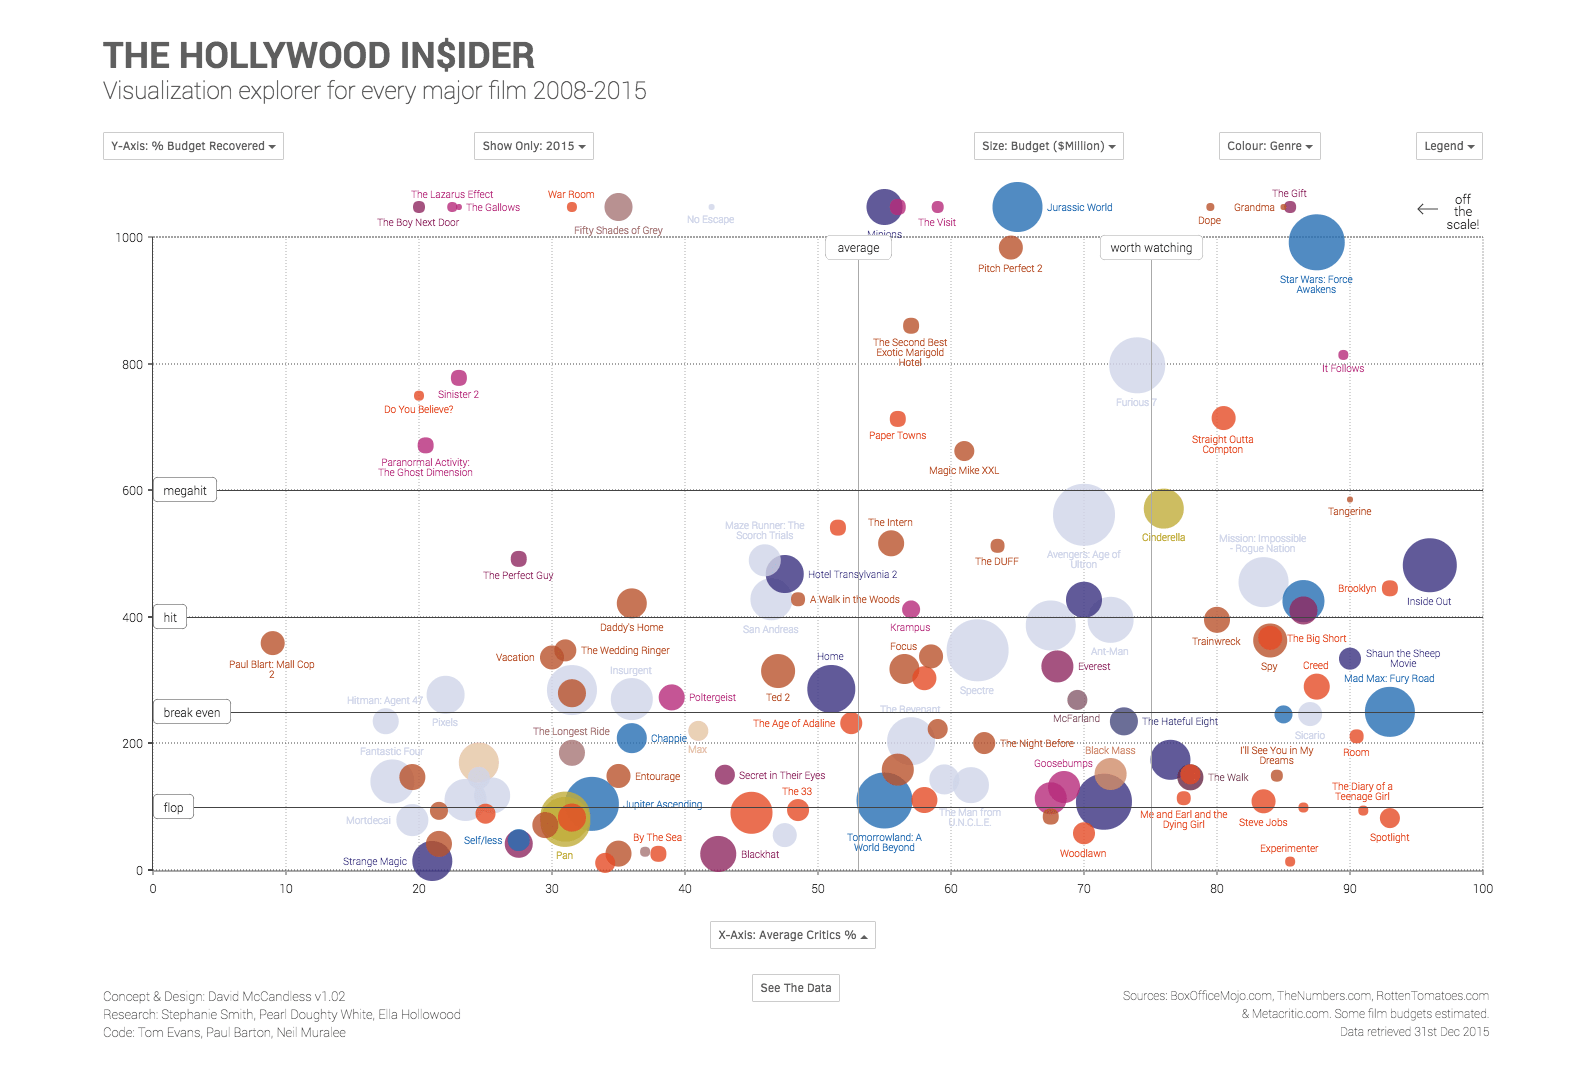
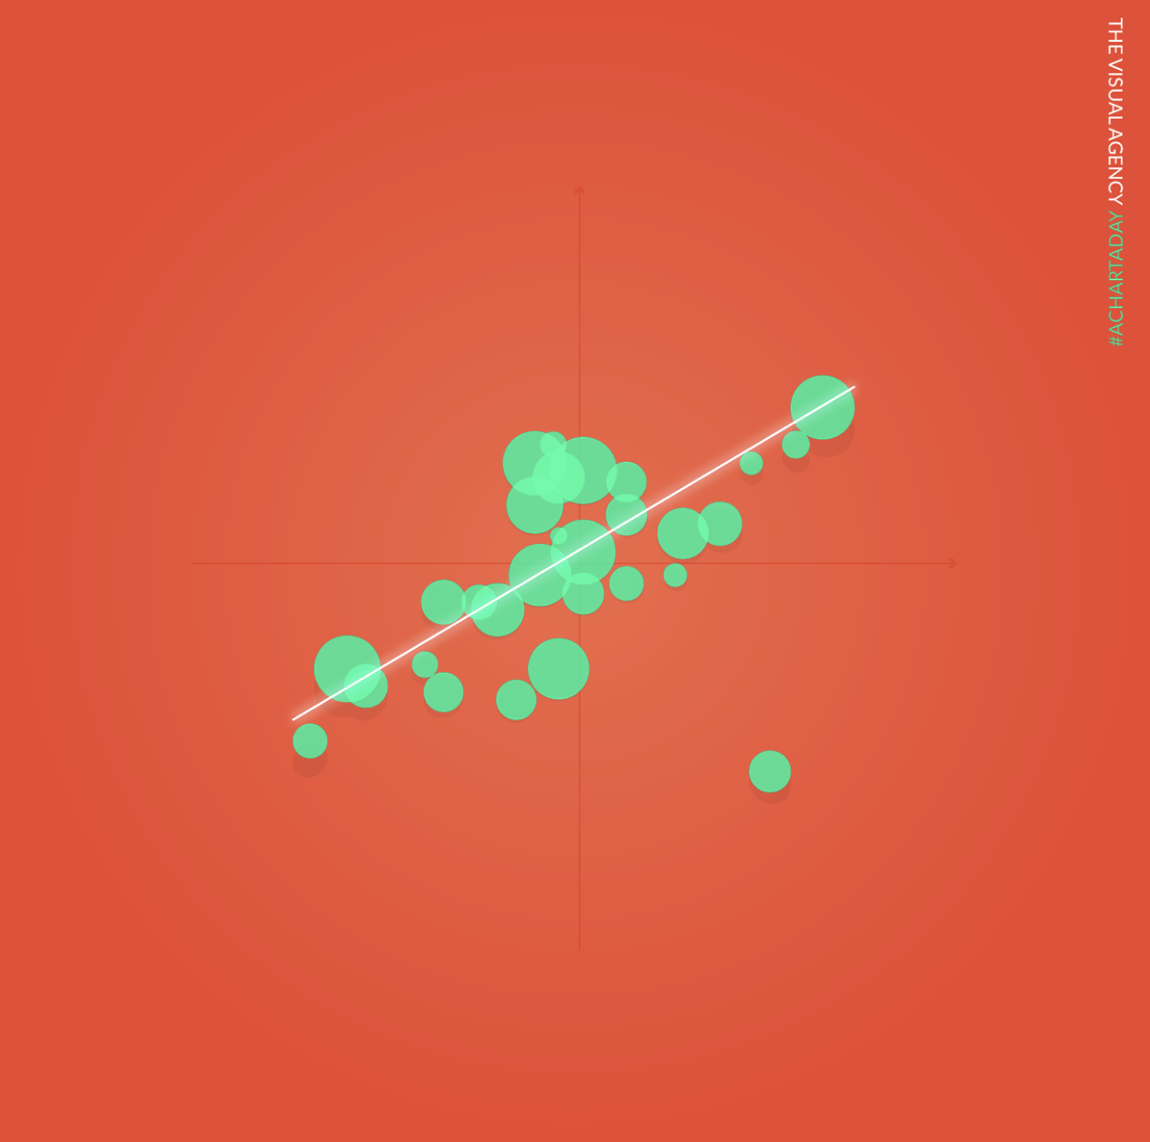
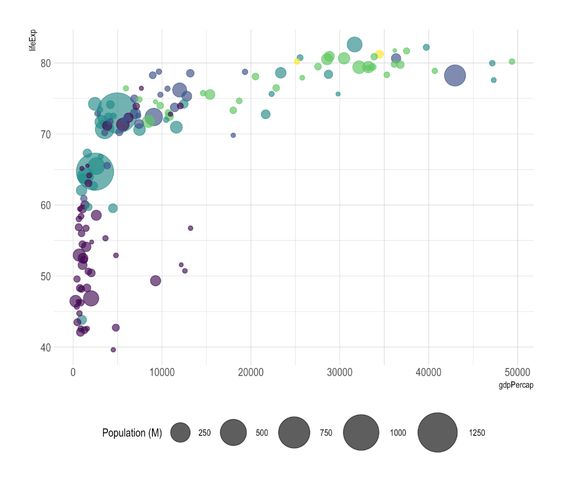
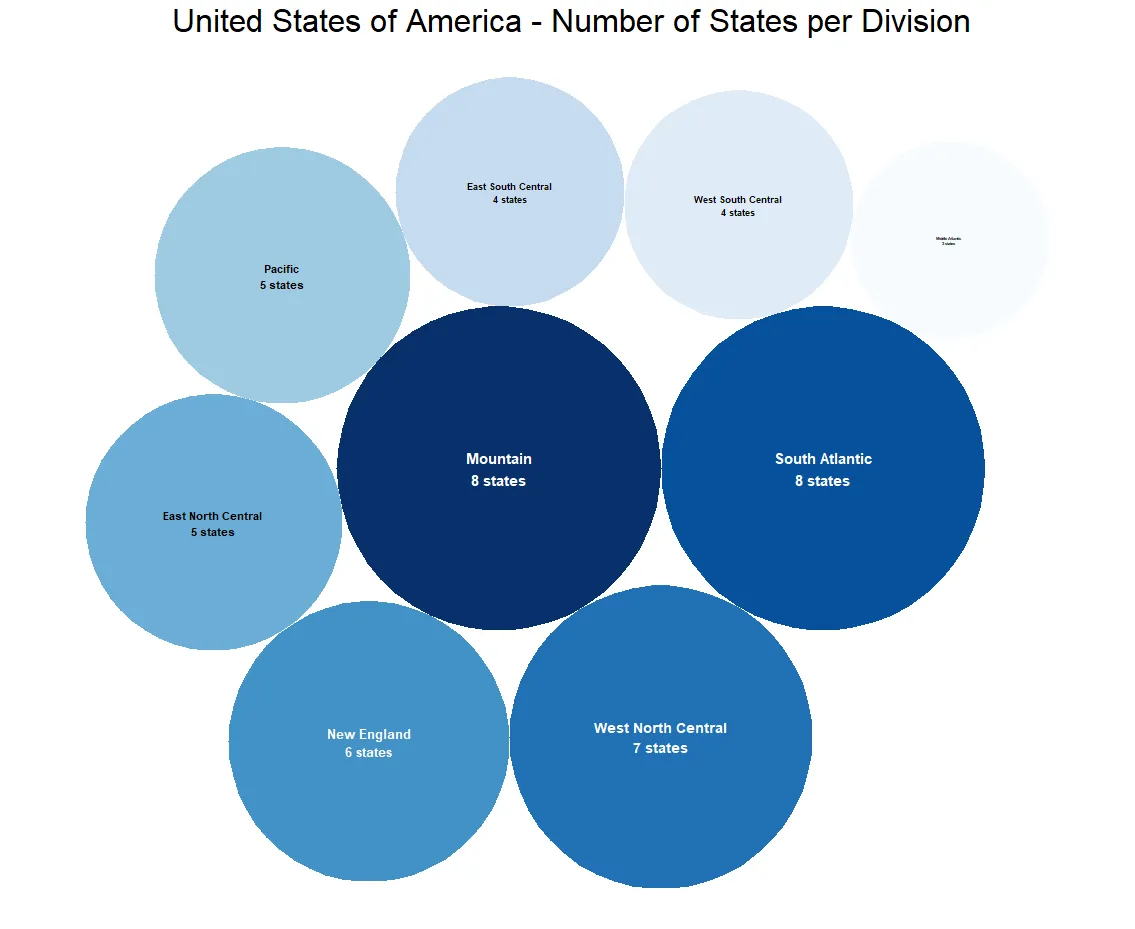
Bubble Chart
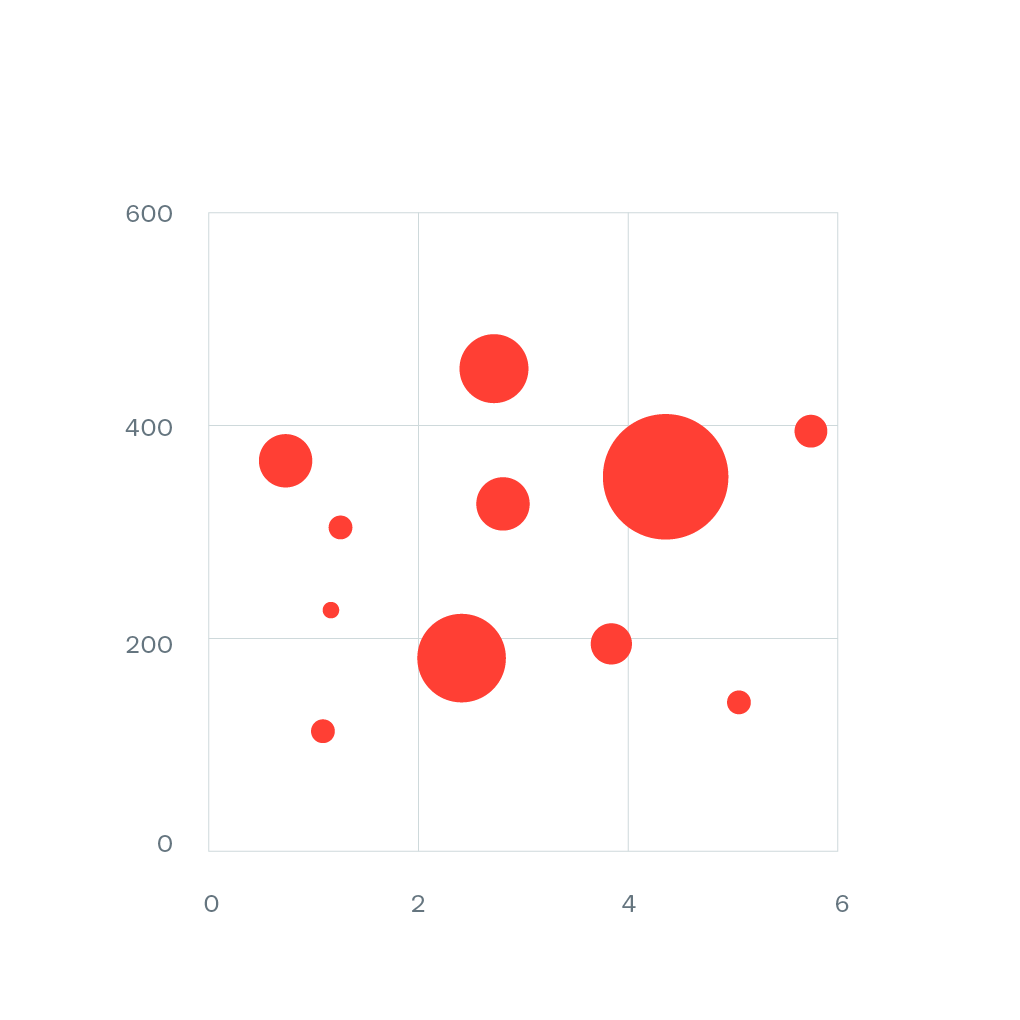
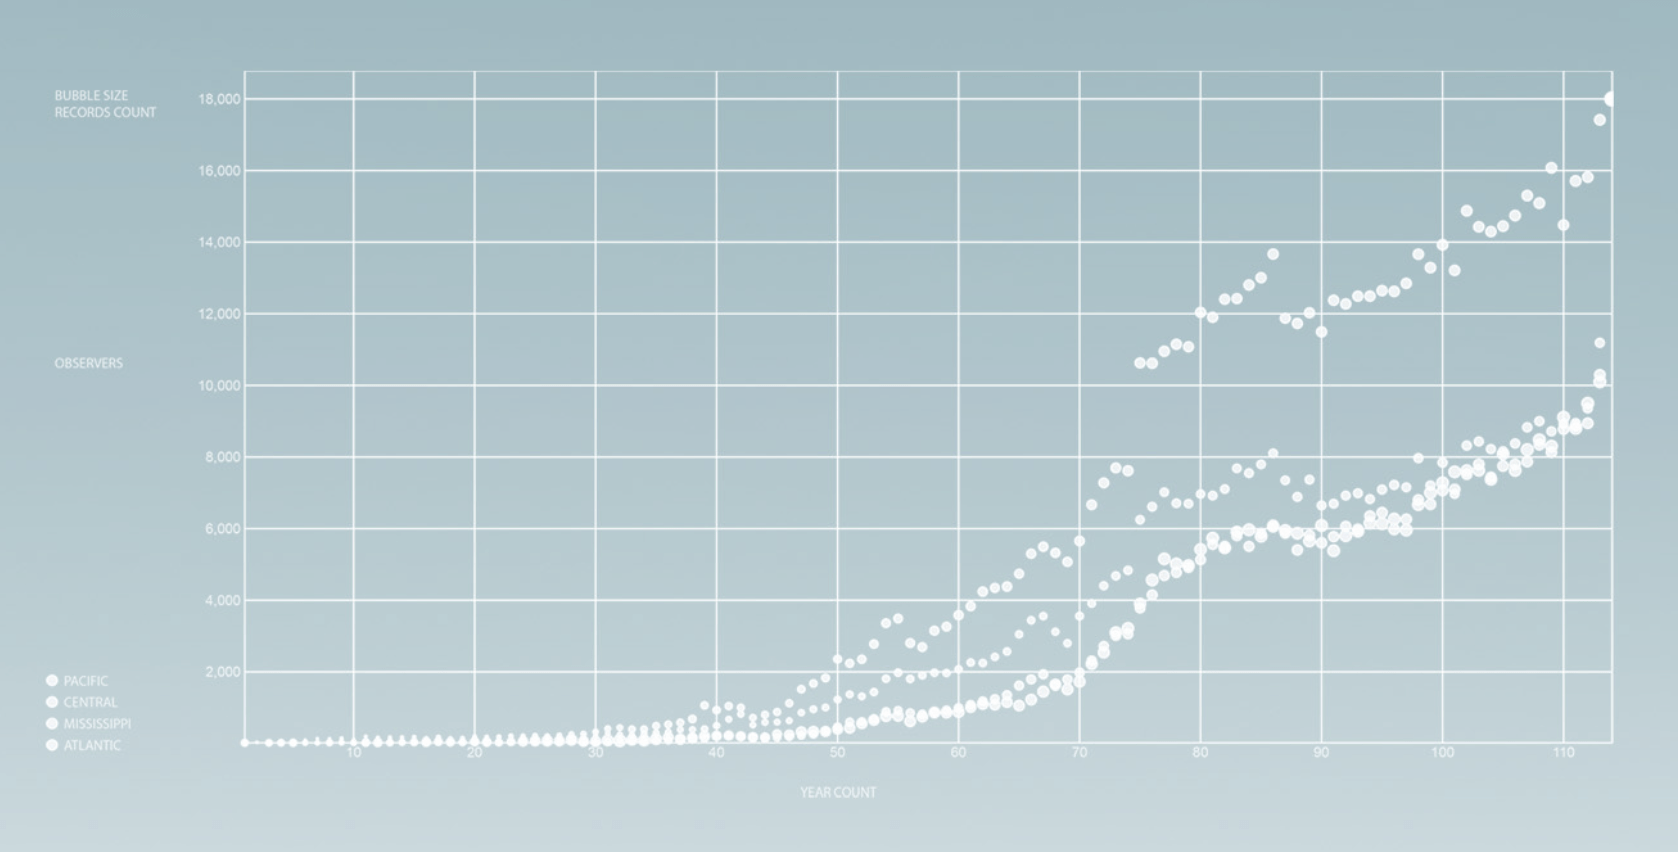
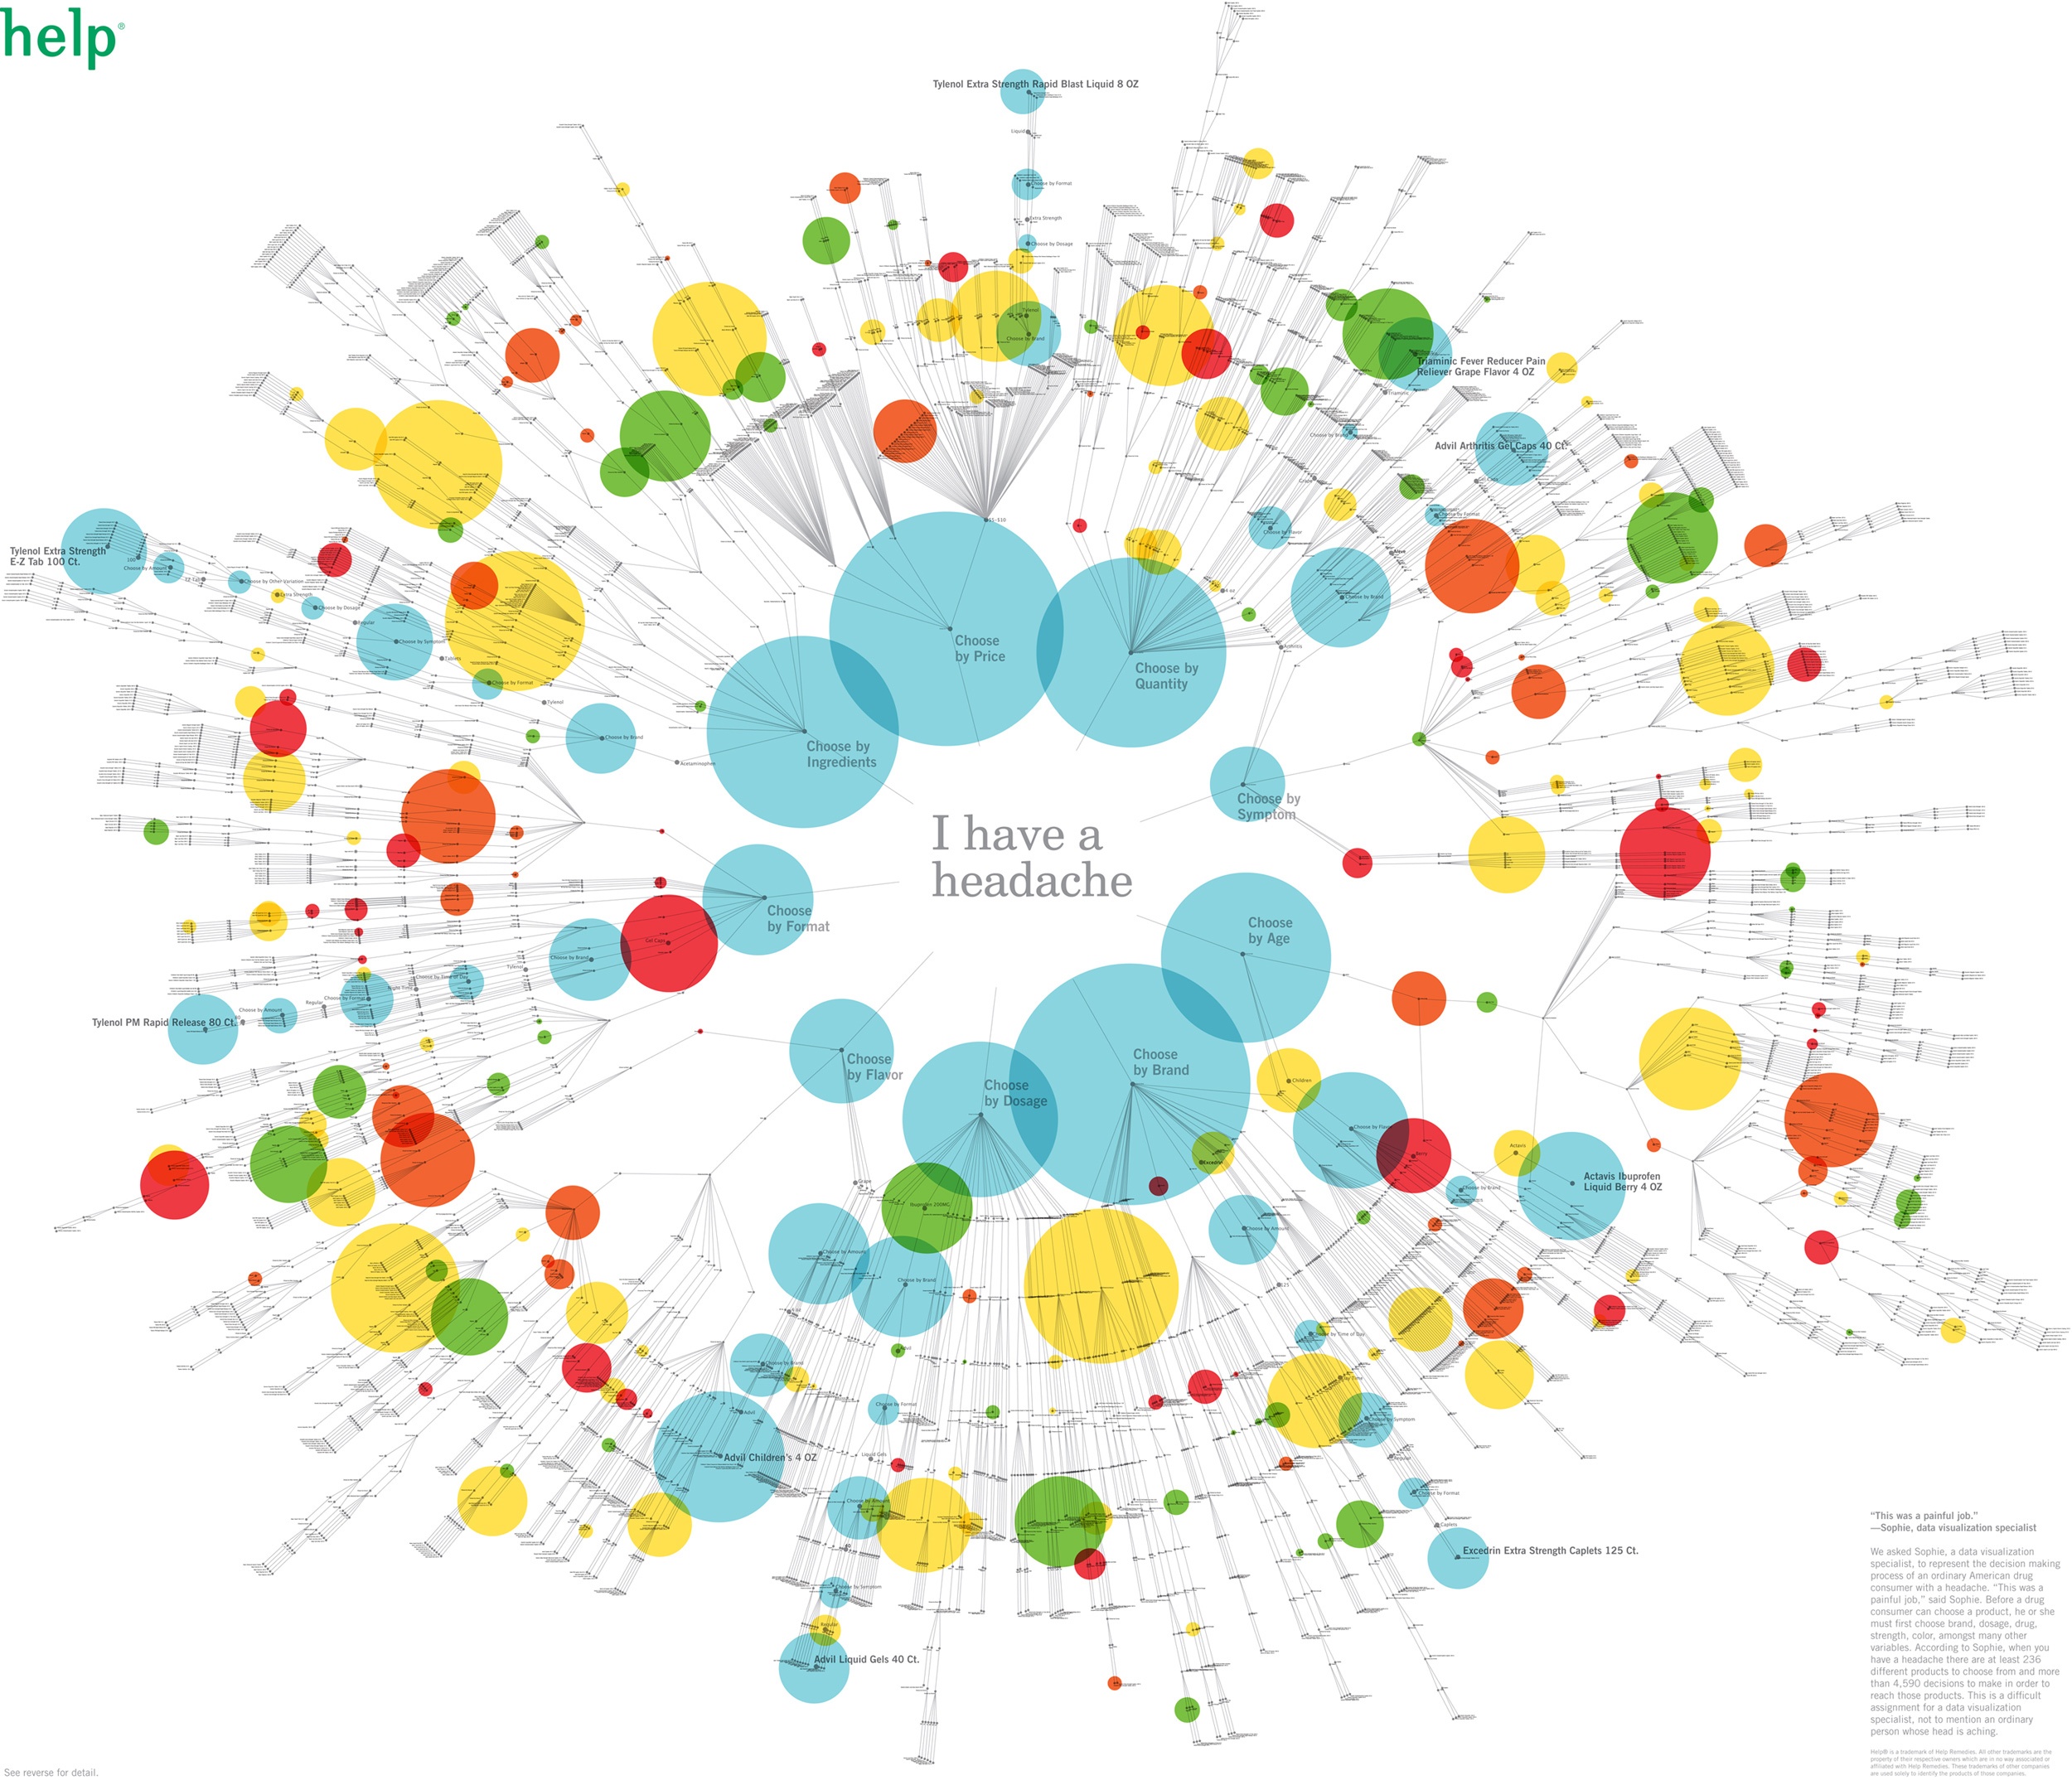
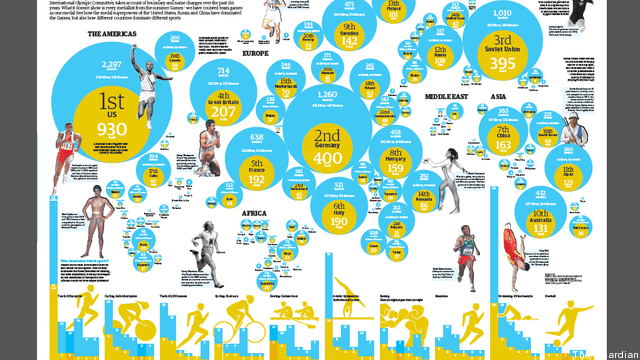
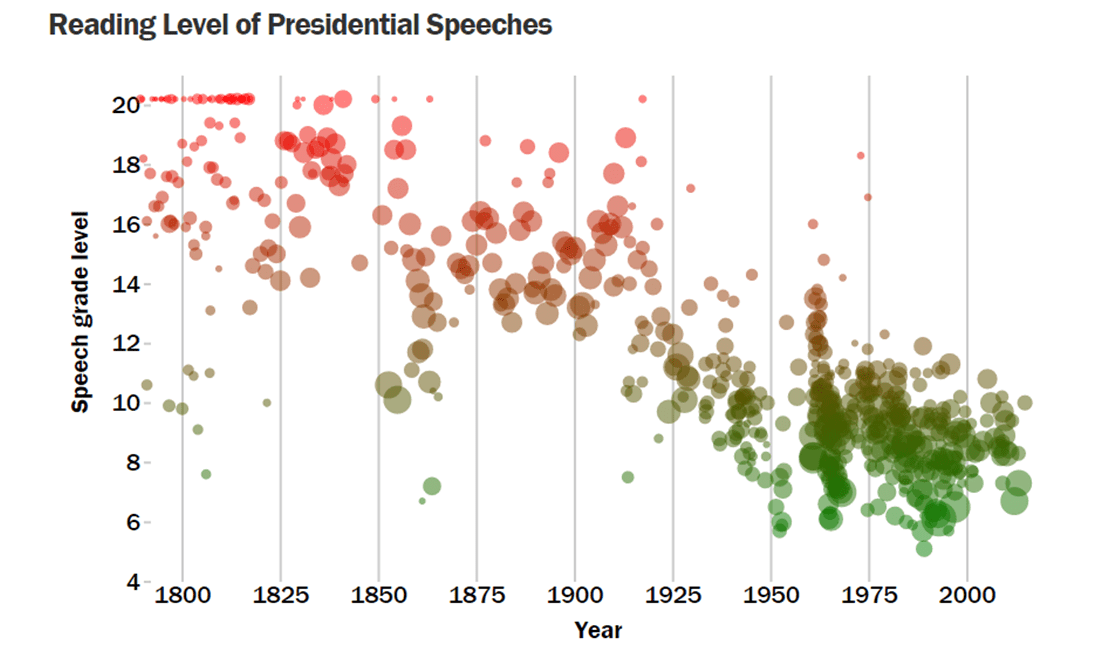
A bubble chart is a type of chart that displays three dimensions of data. Each entity with its triplet (v1, v2, v3) of associated data is plotted as a disk that expresses two of the vi values through the disk’s xy location and the third through its size. Bubble charts can facilitate the understanding of social, economical, medical, and other scientific relationships. Bubble charts can be considered a variation of the scatter plot, in which the data points are replaced with bubbles.