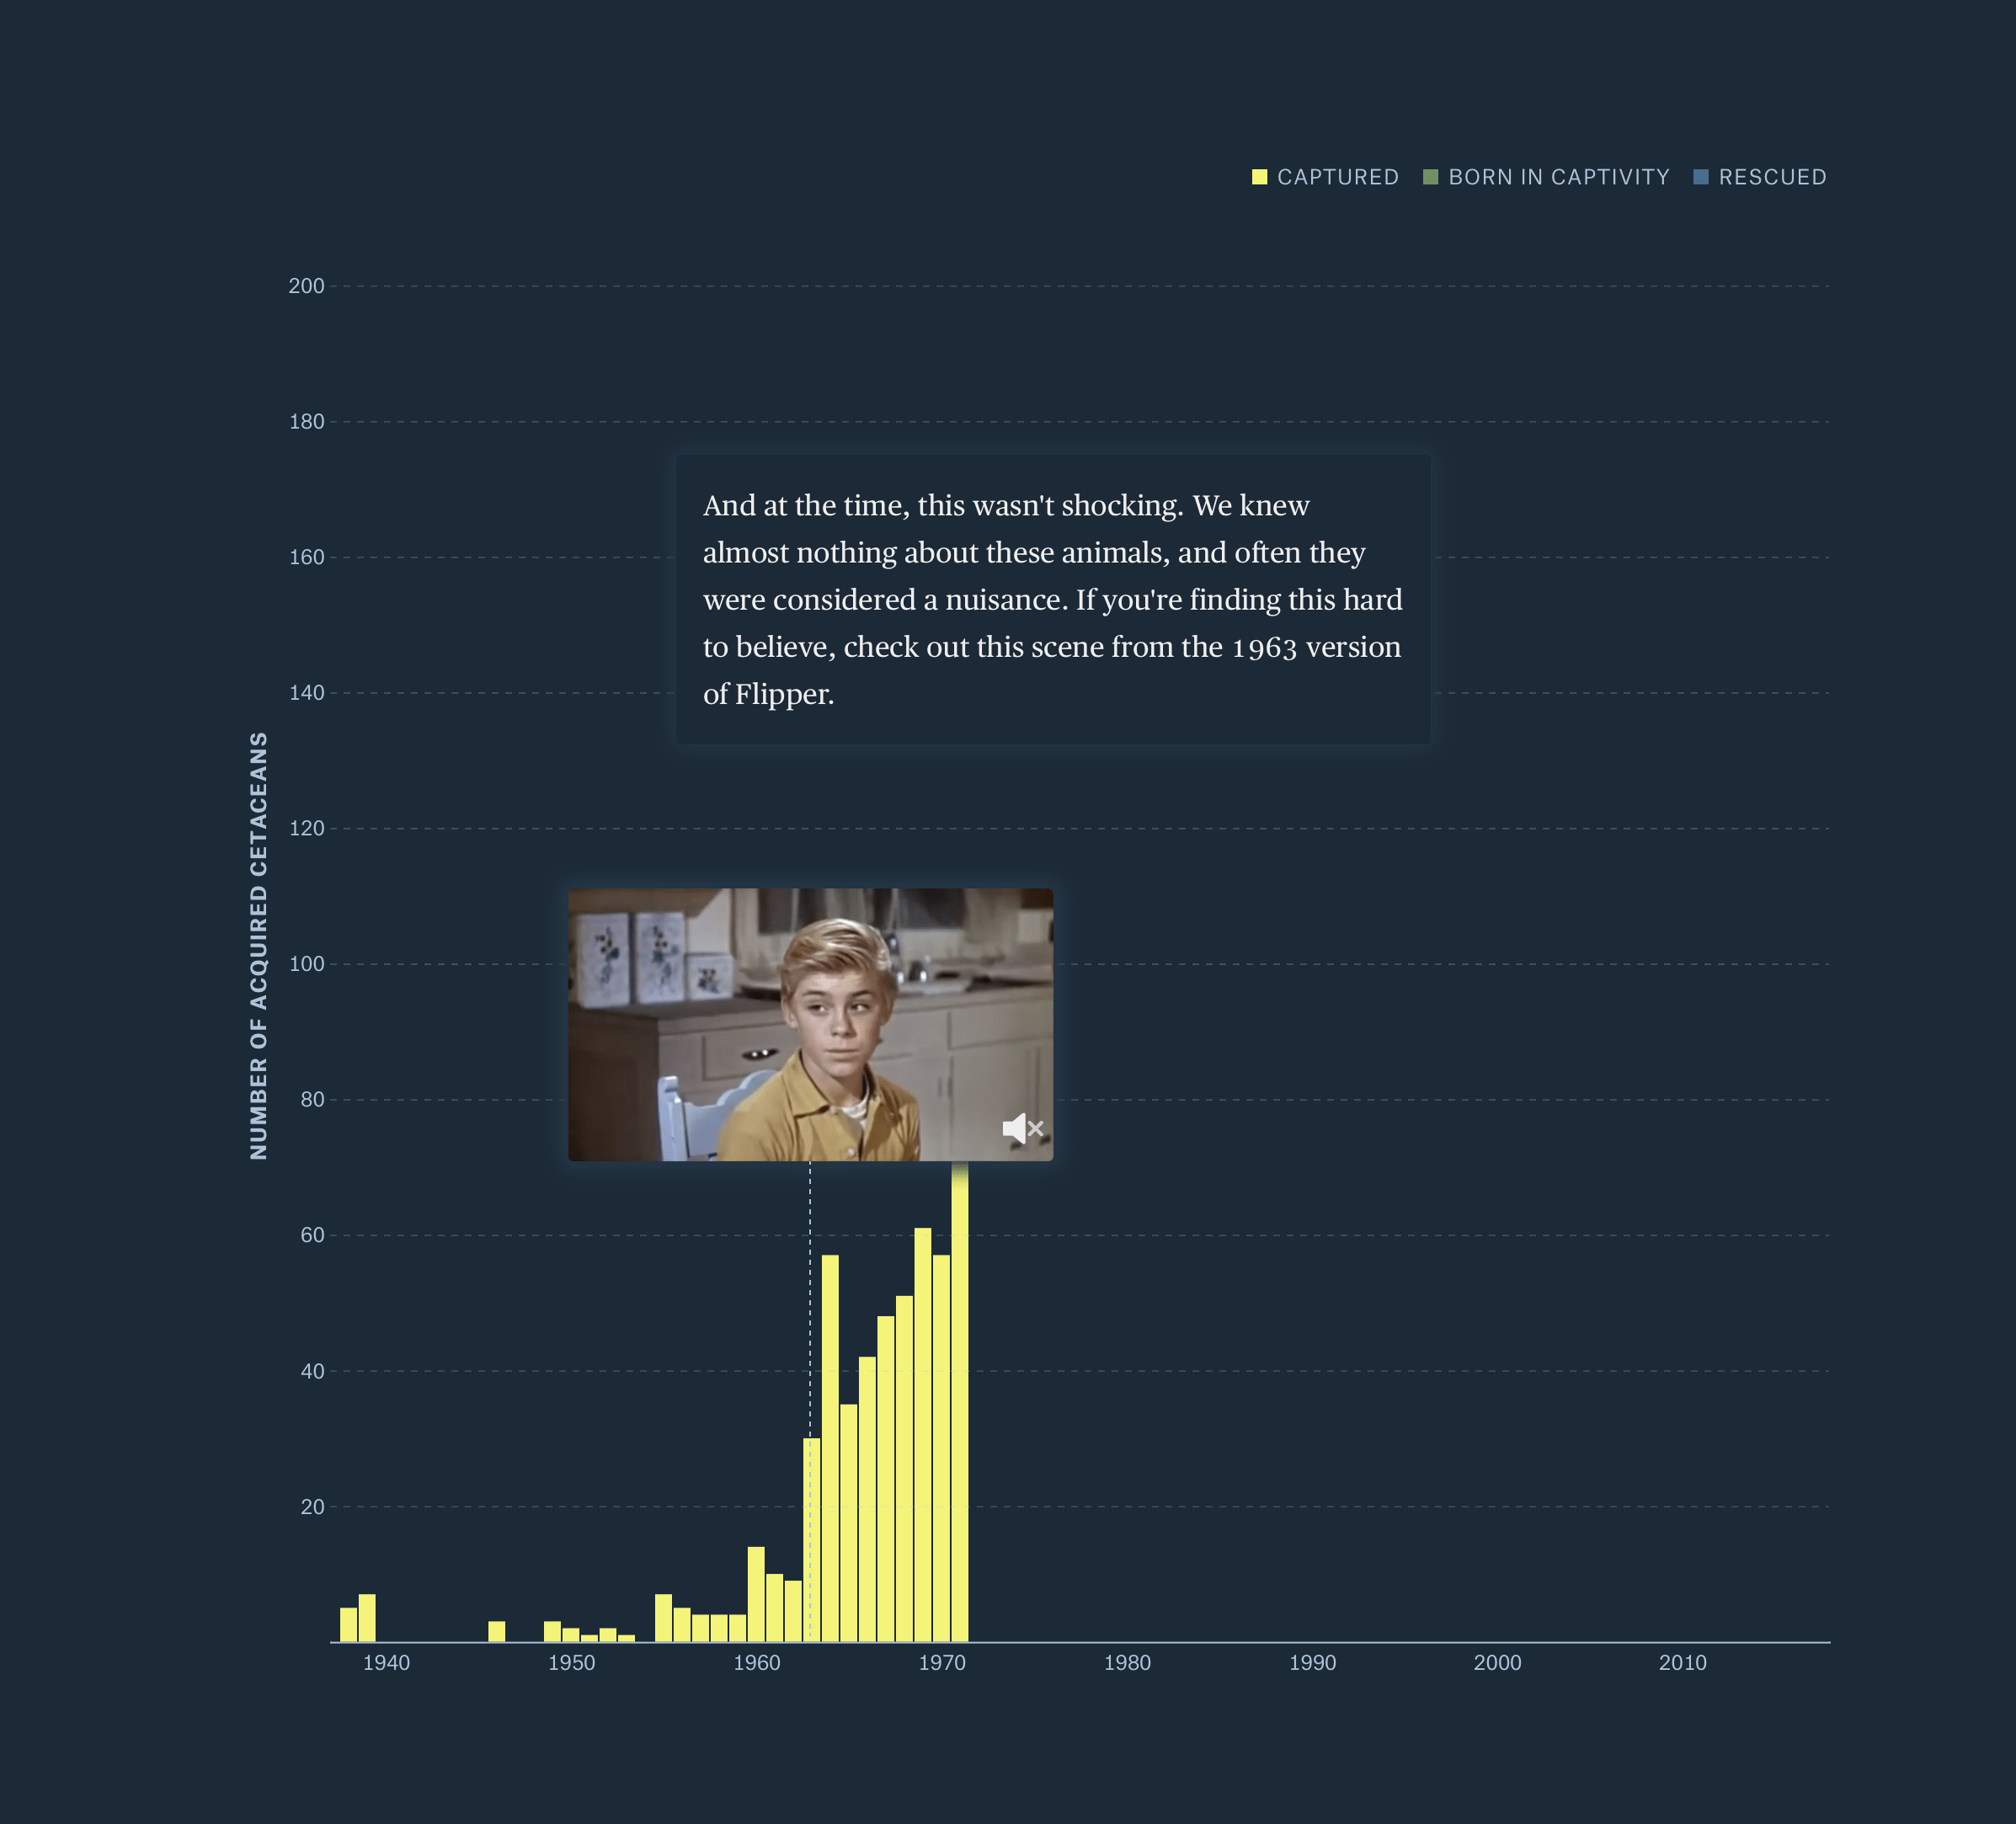
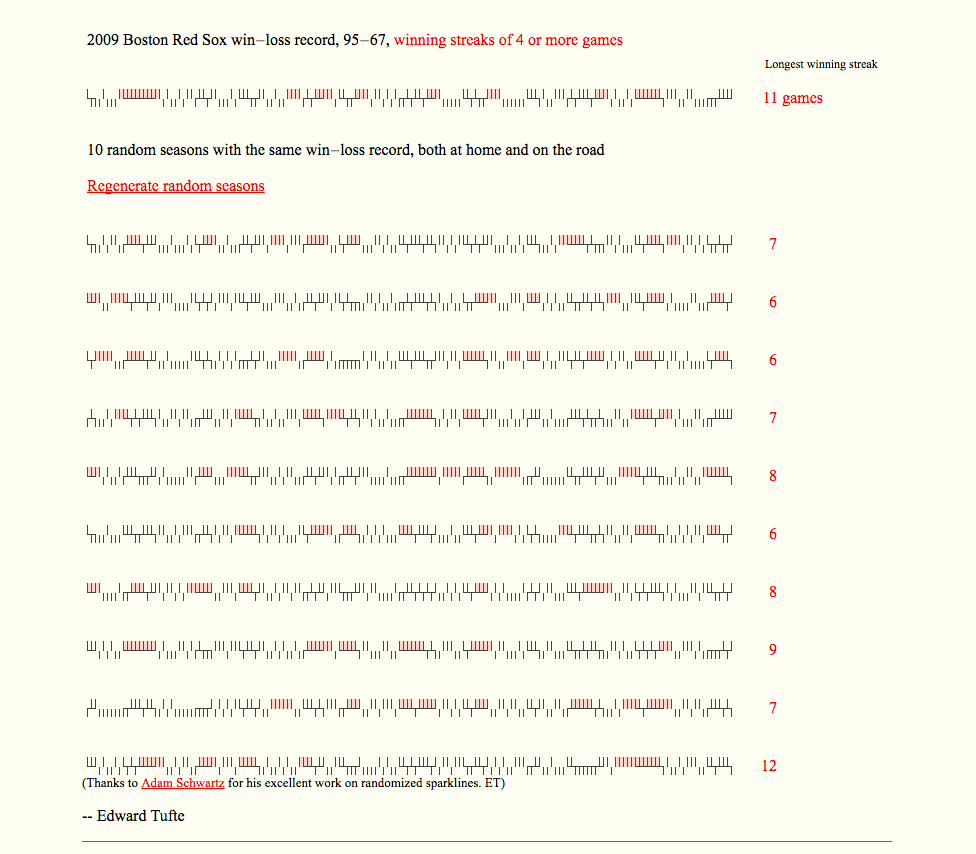
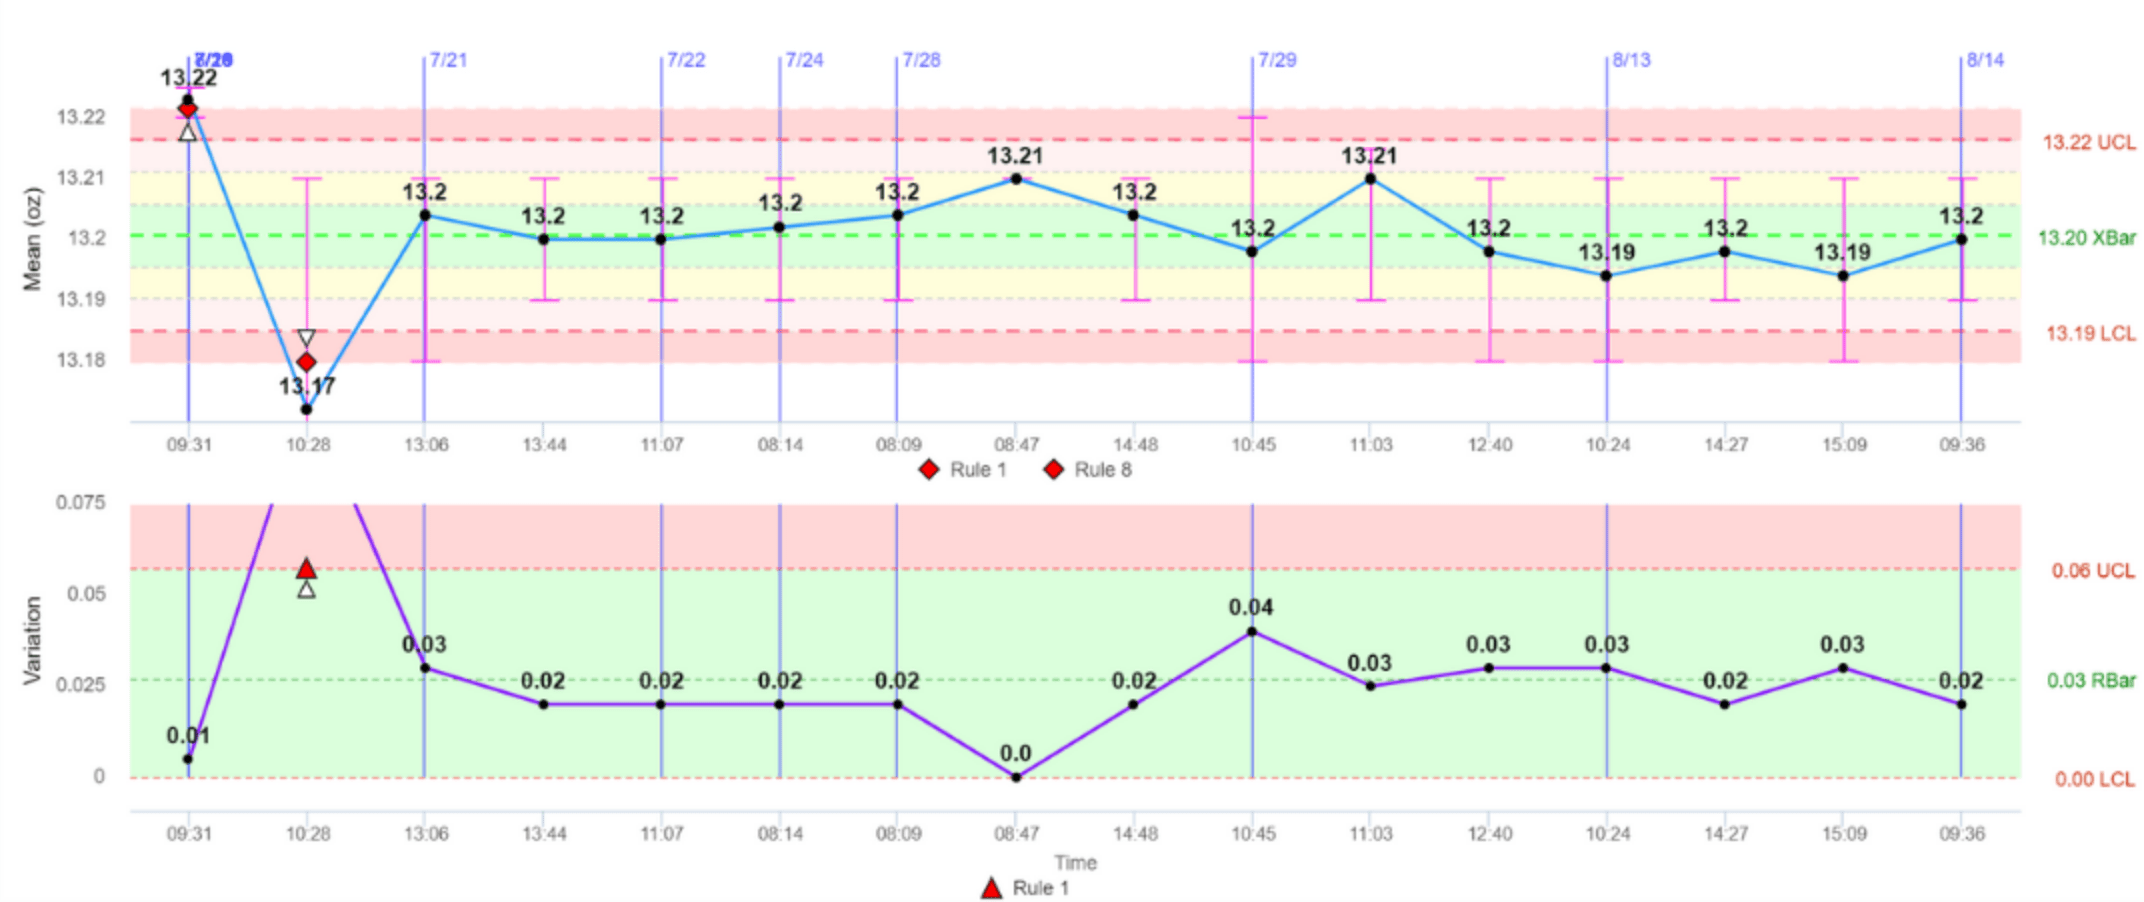
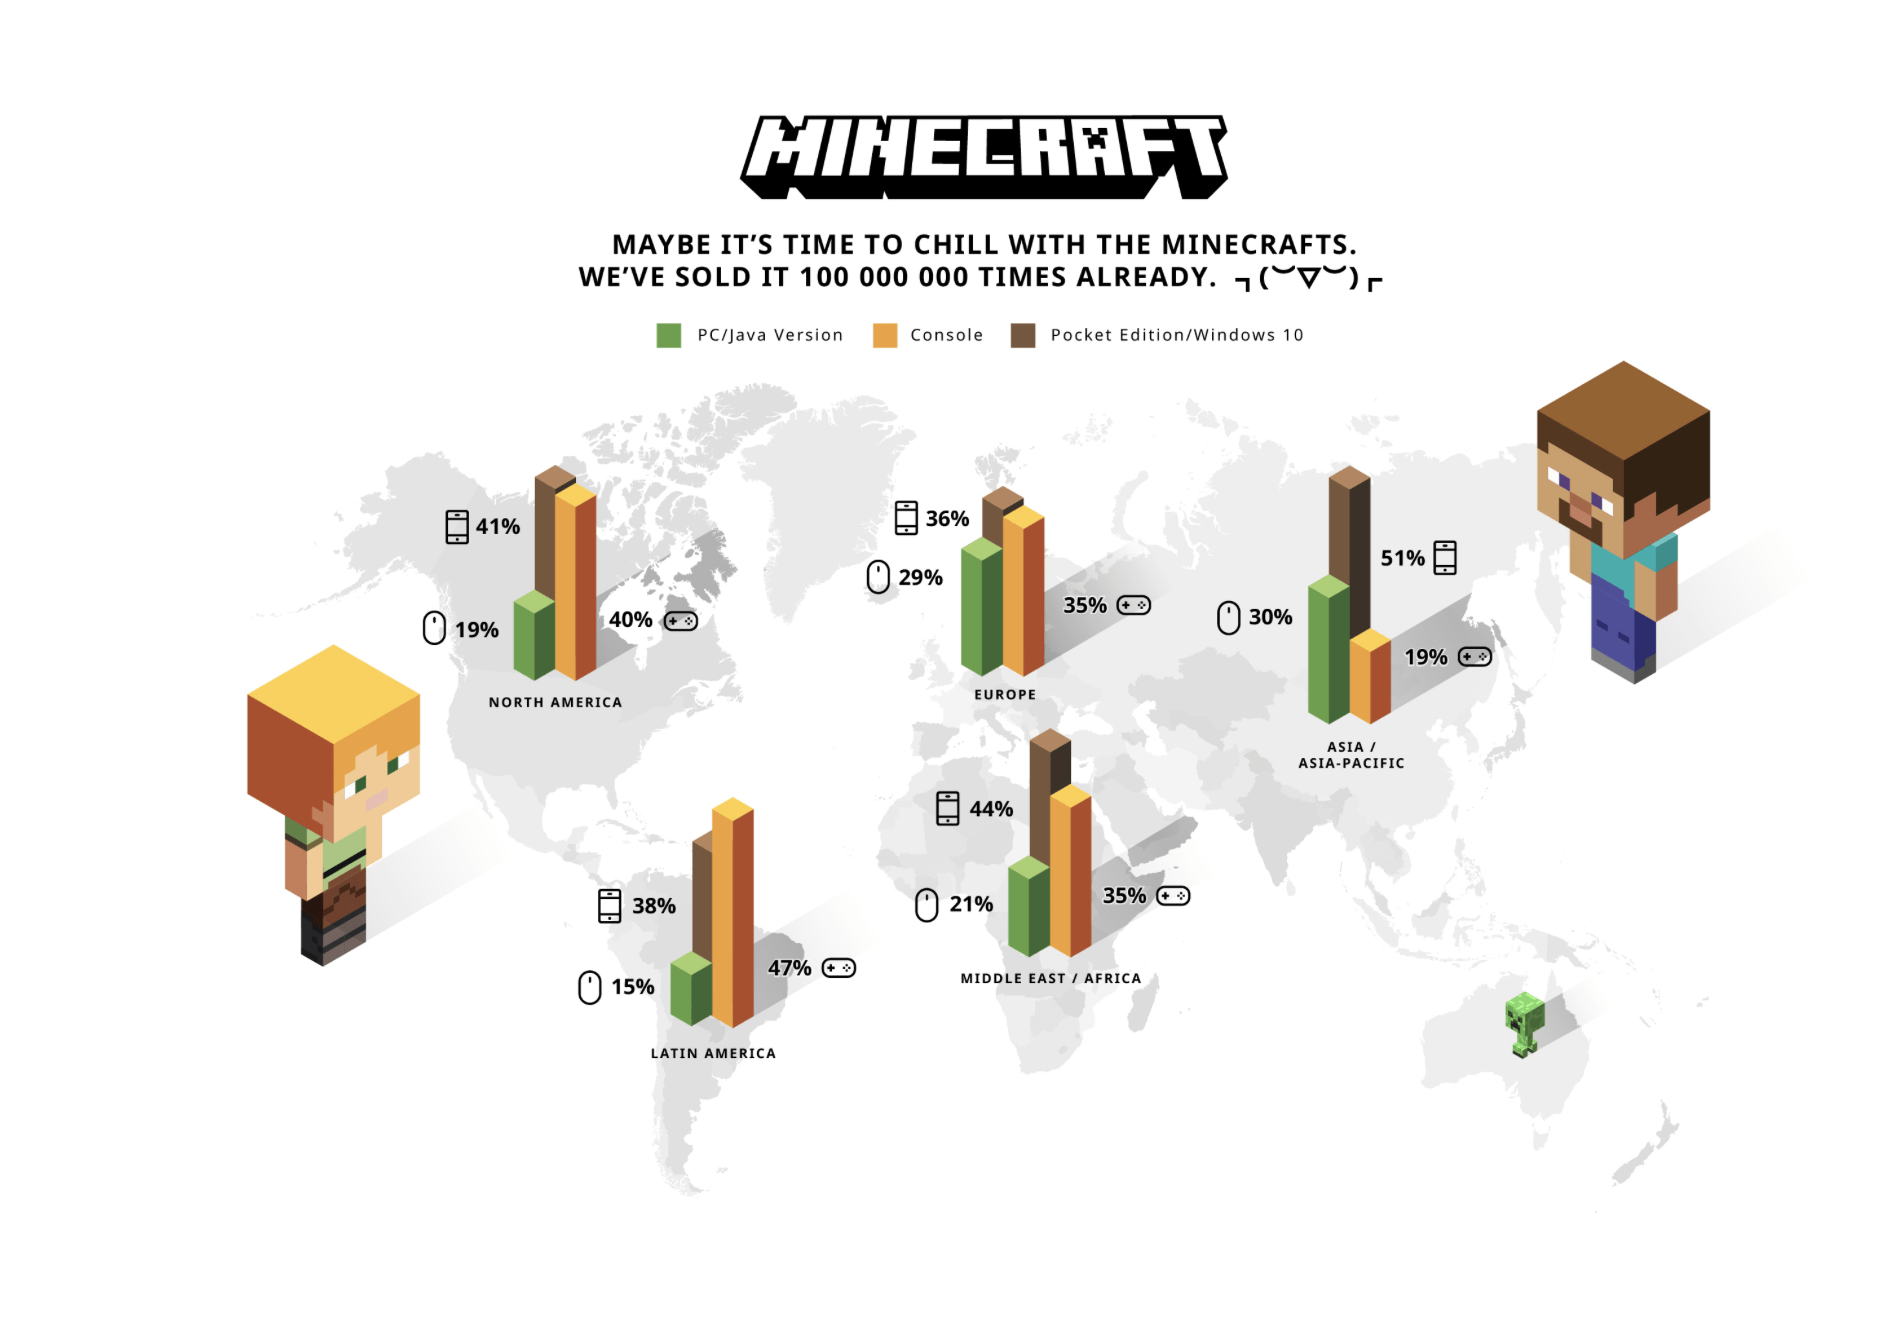
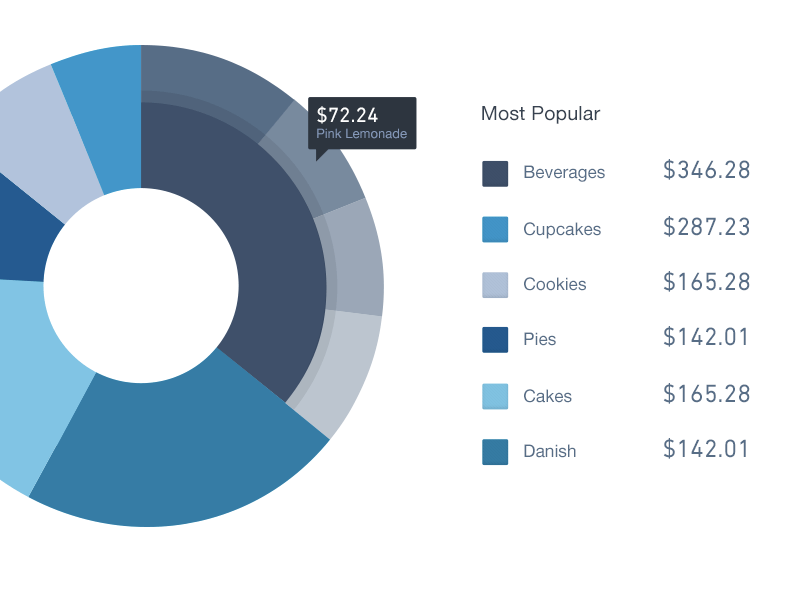
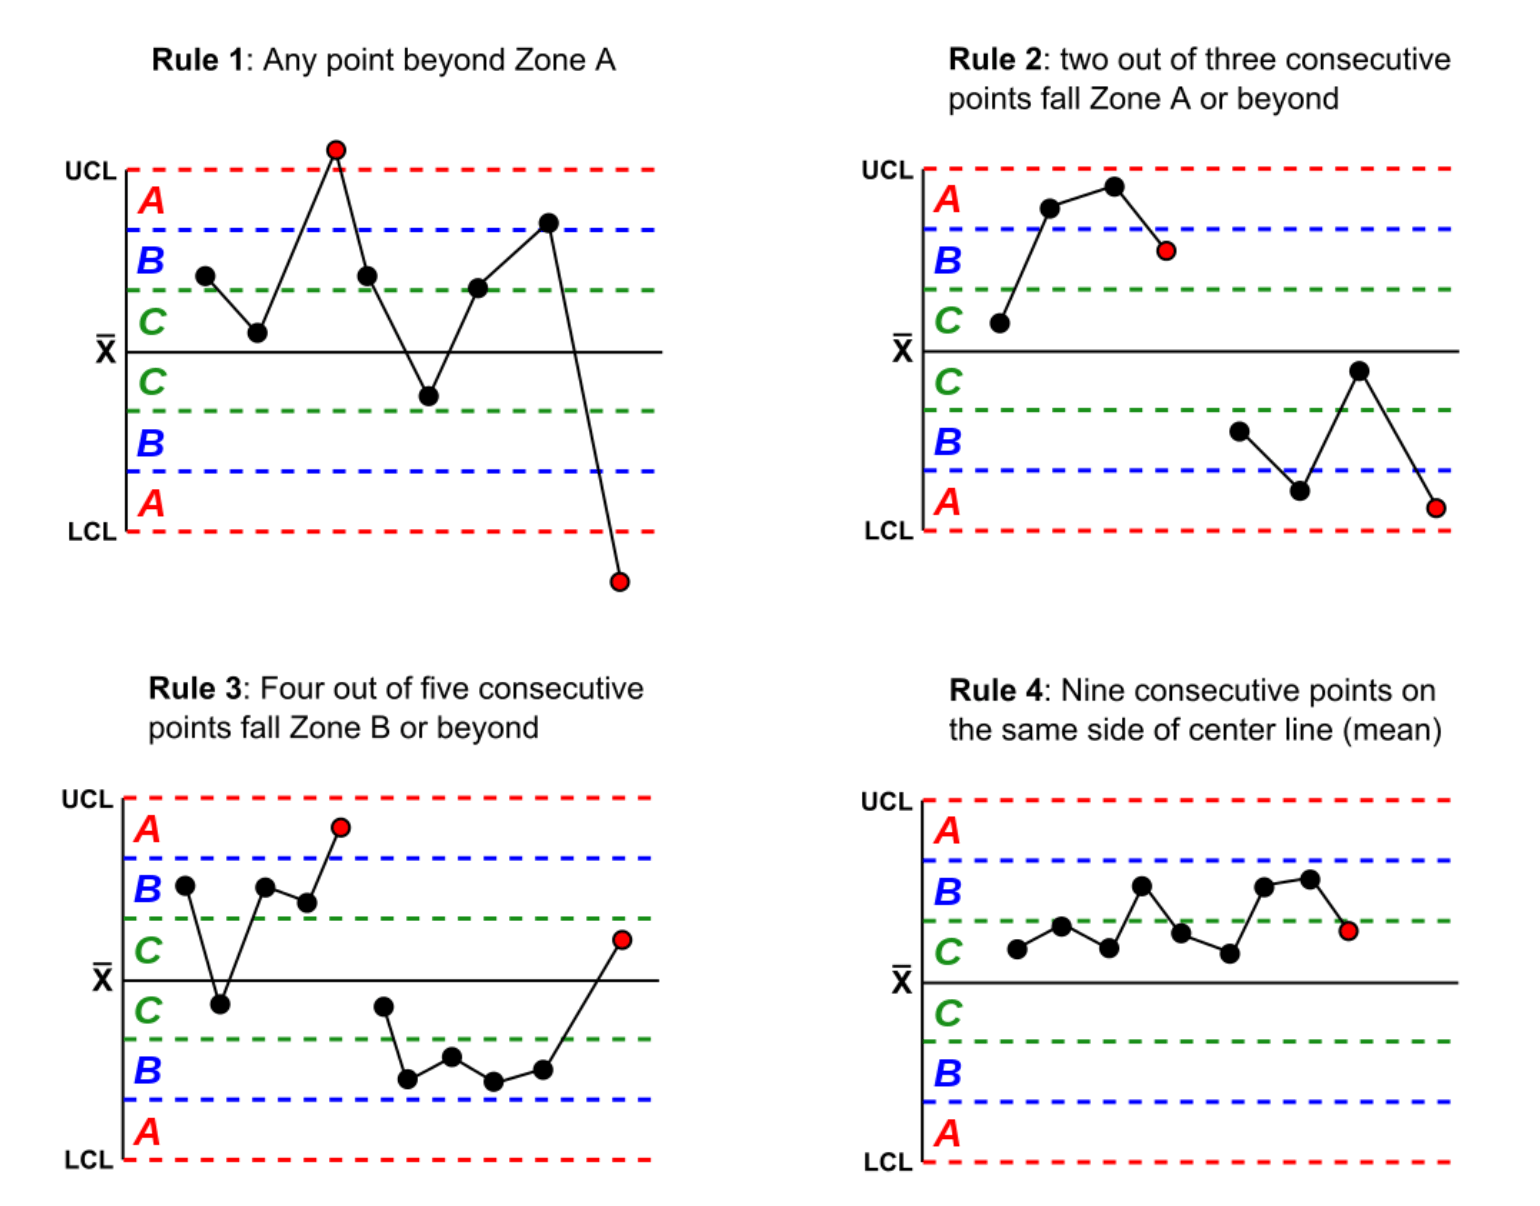
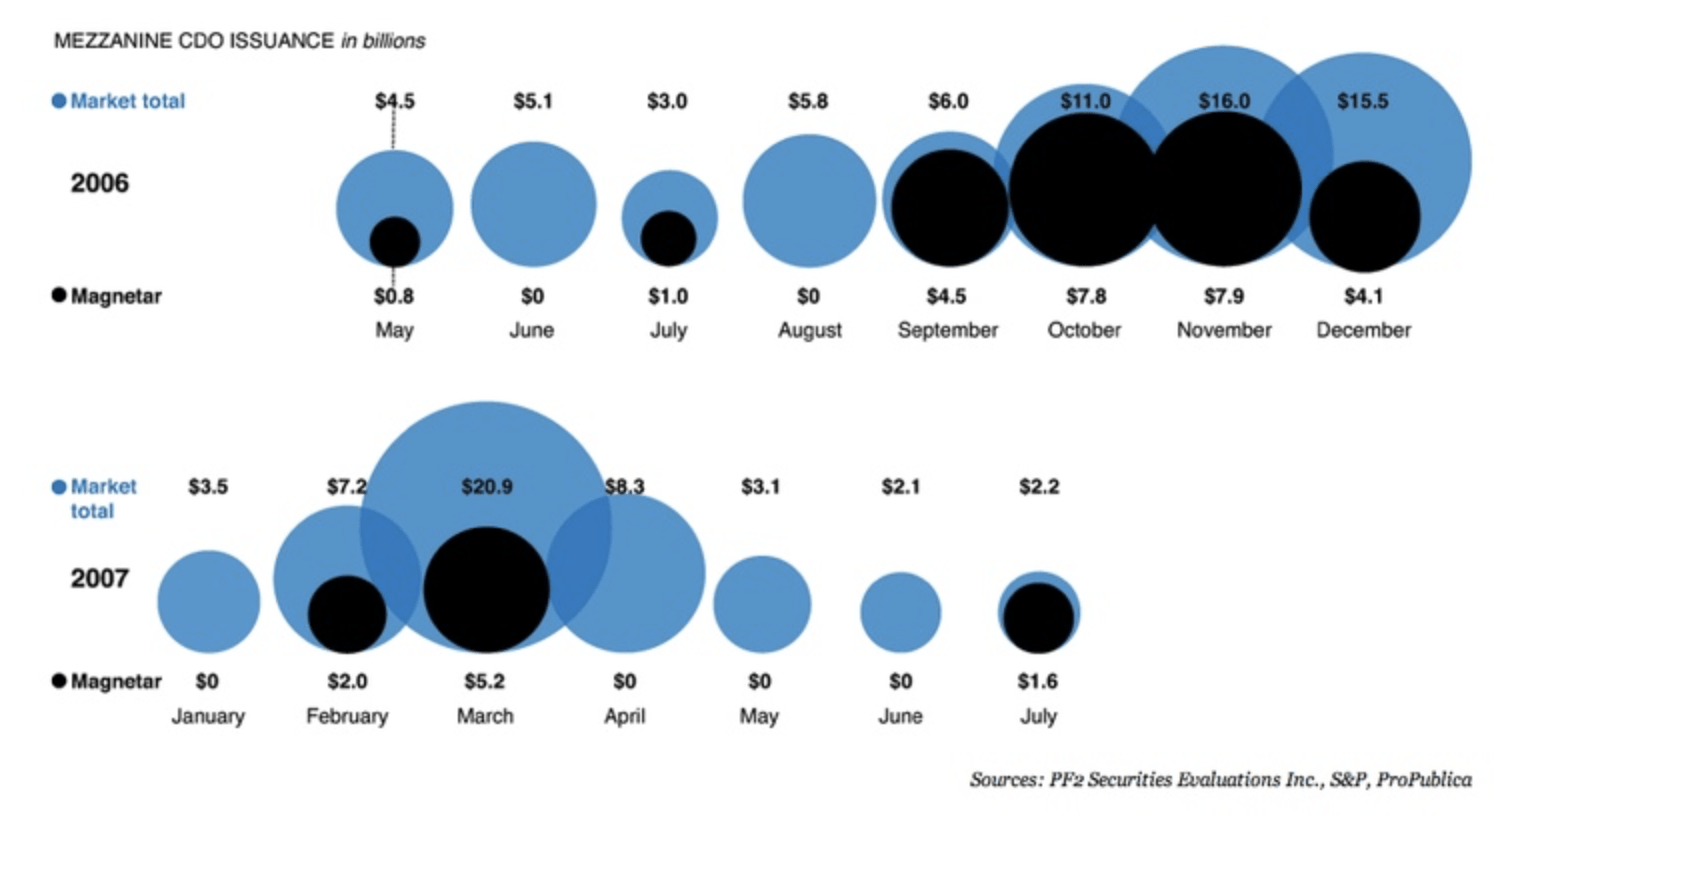
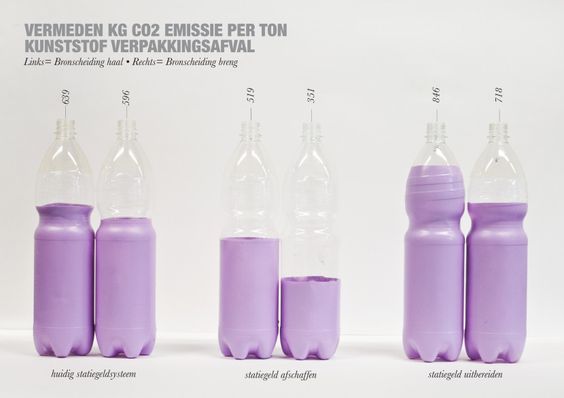
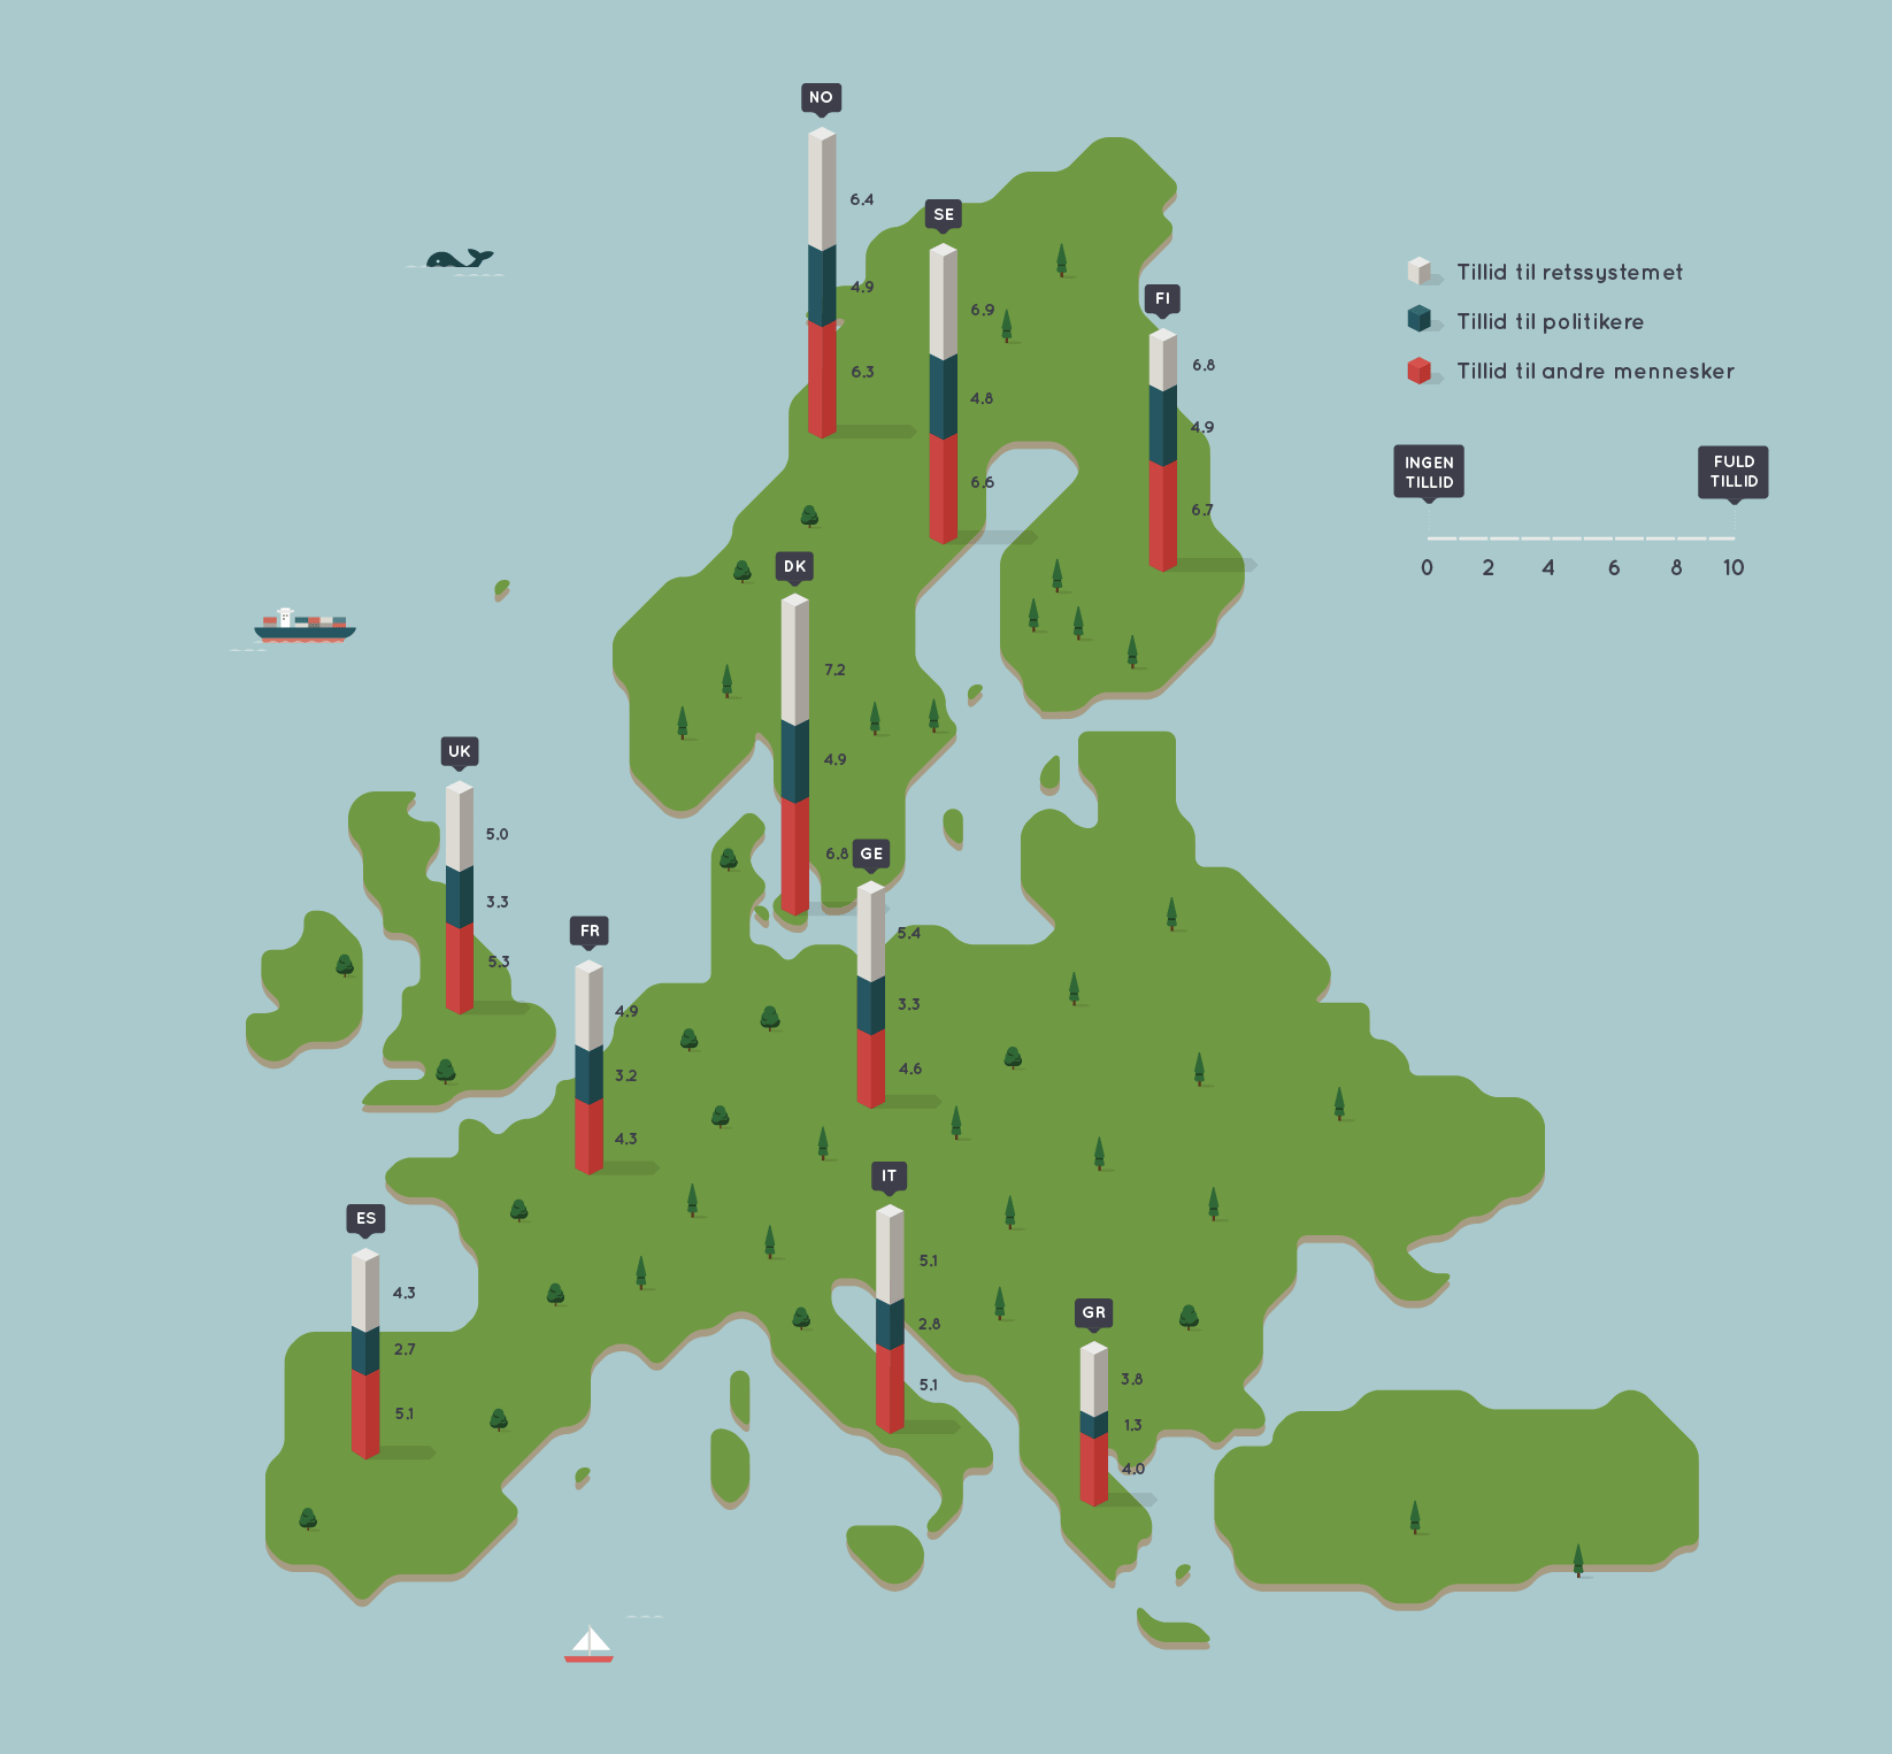
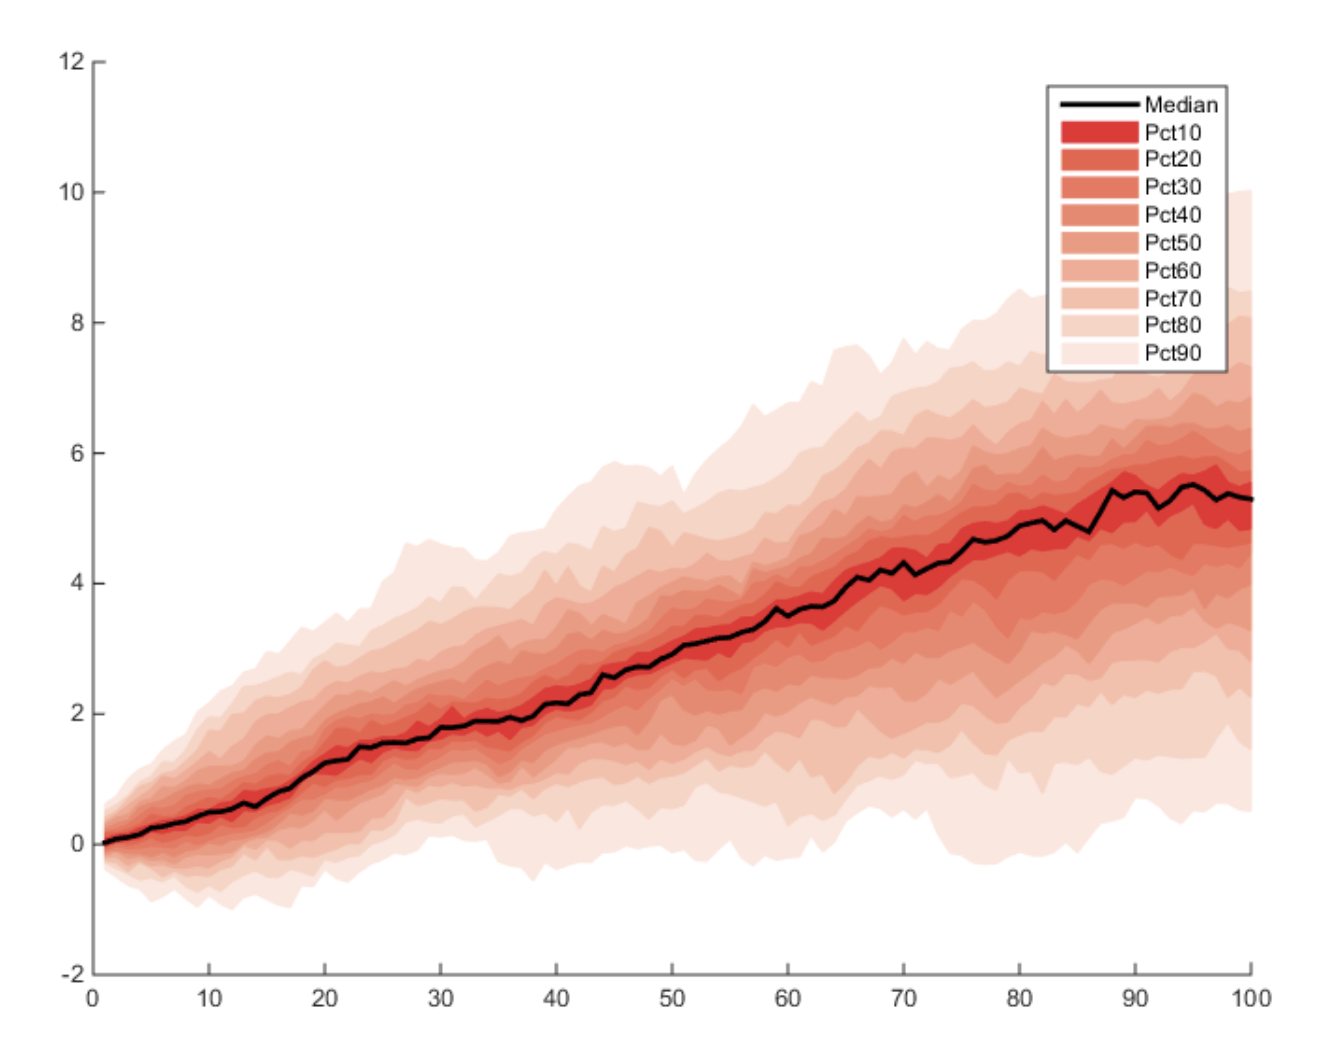
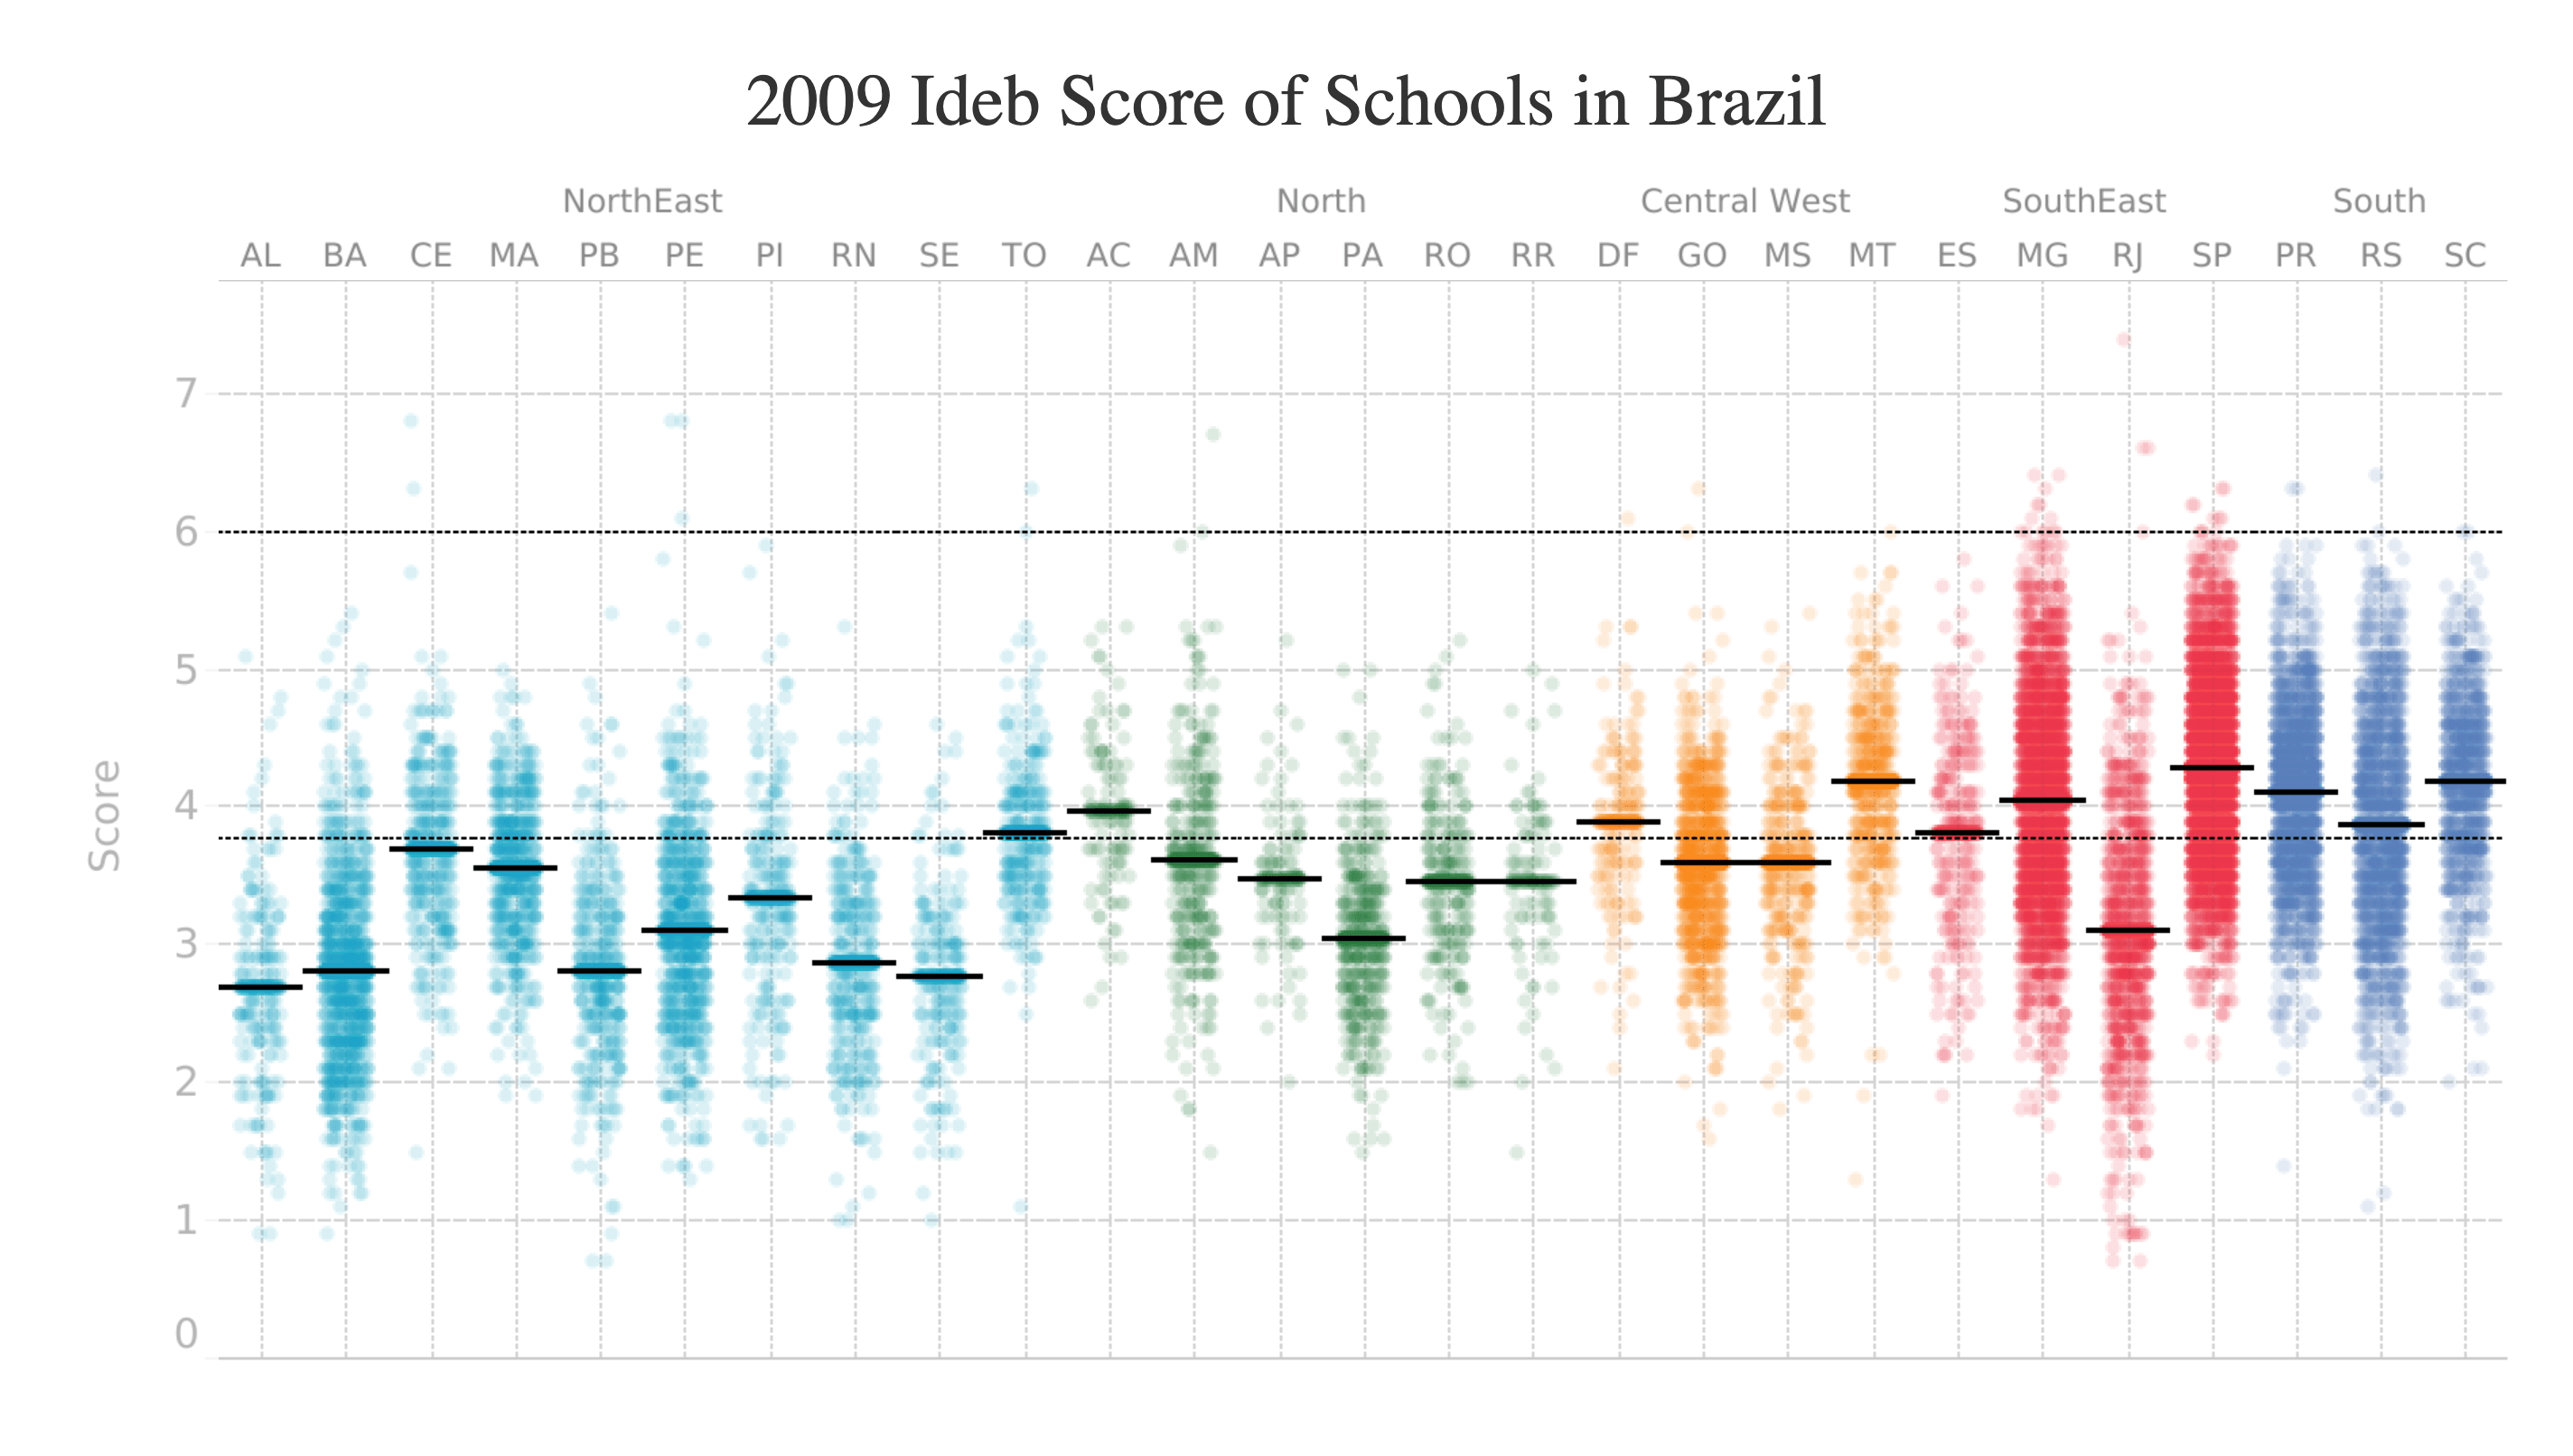
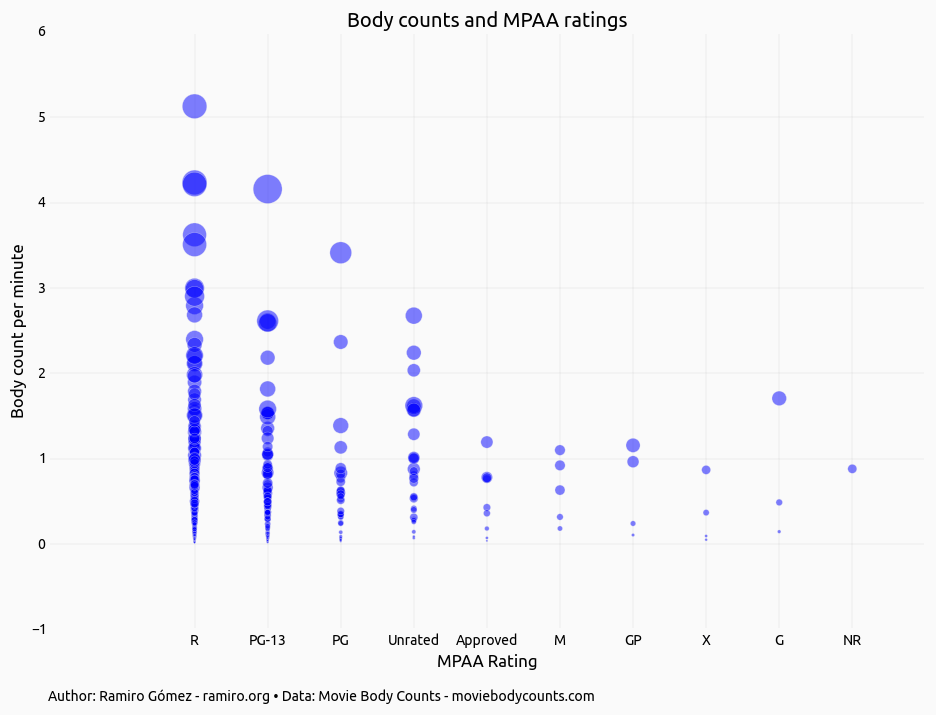
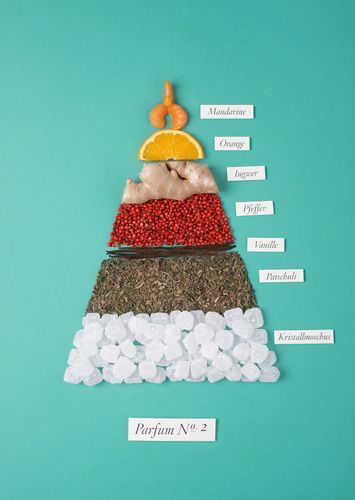
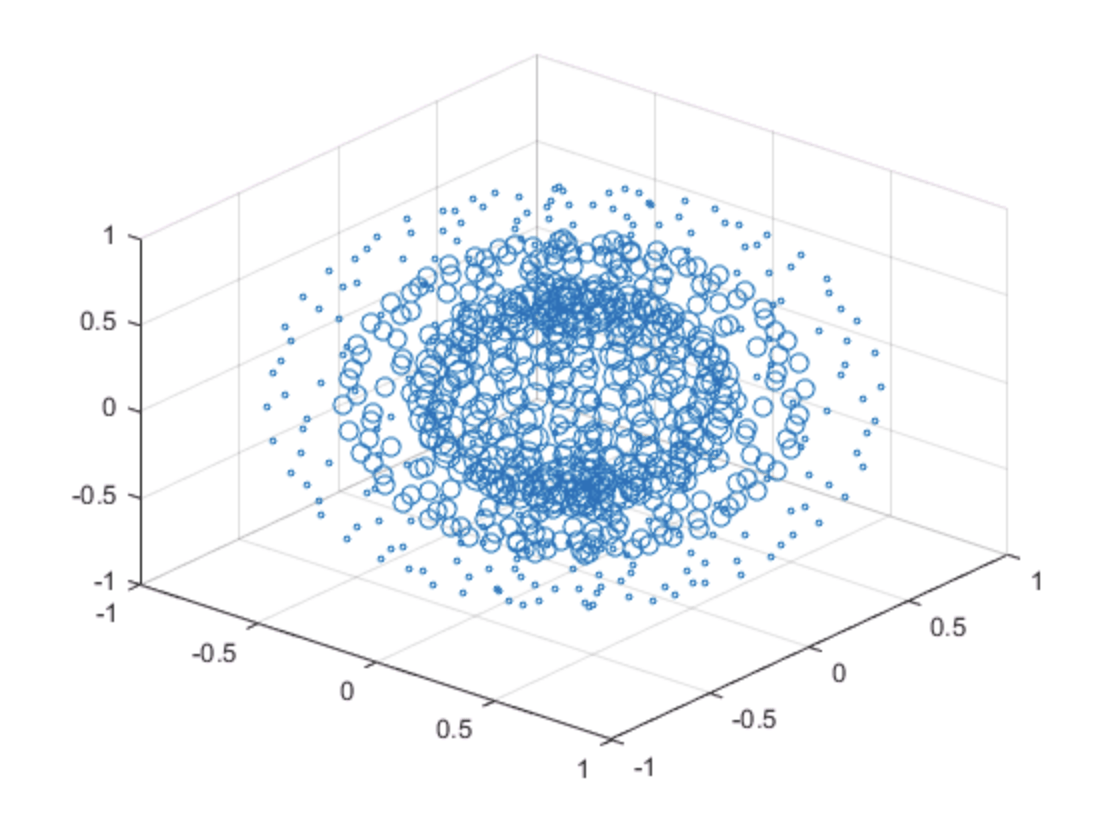
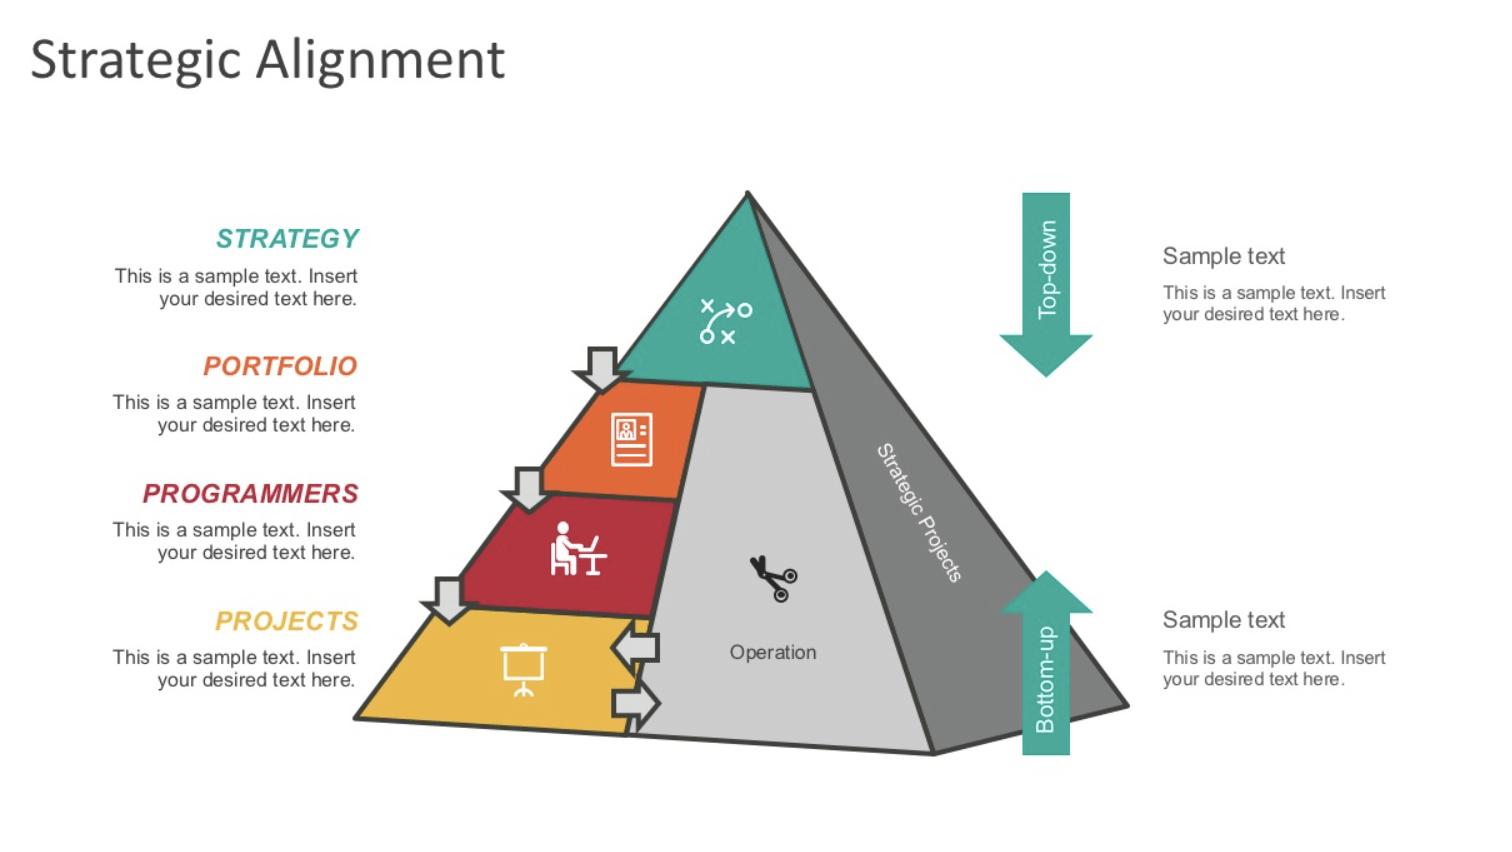
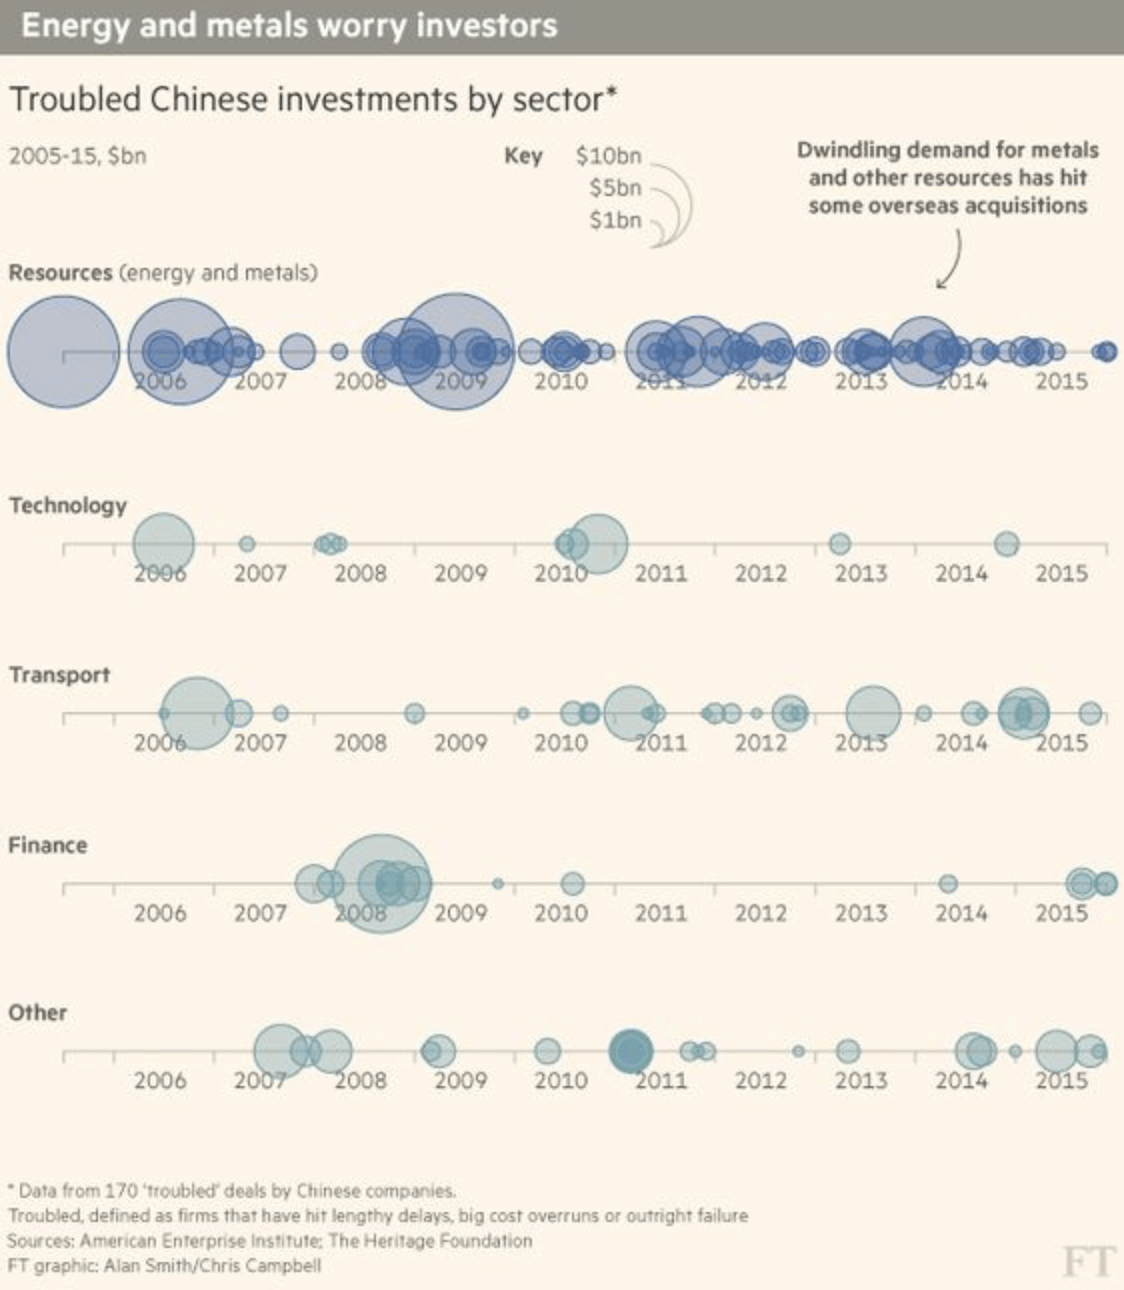
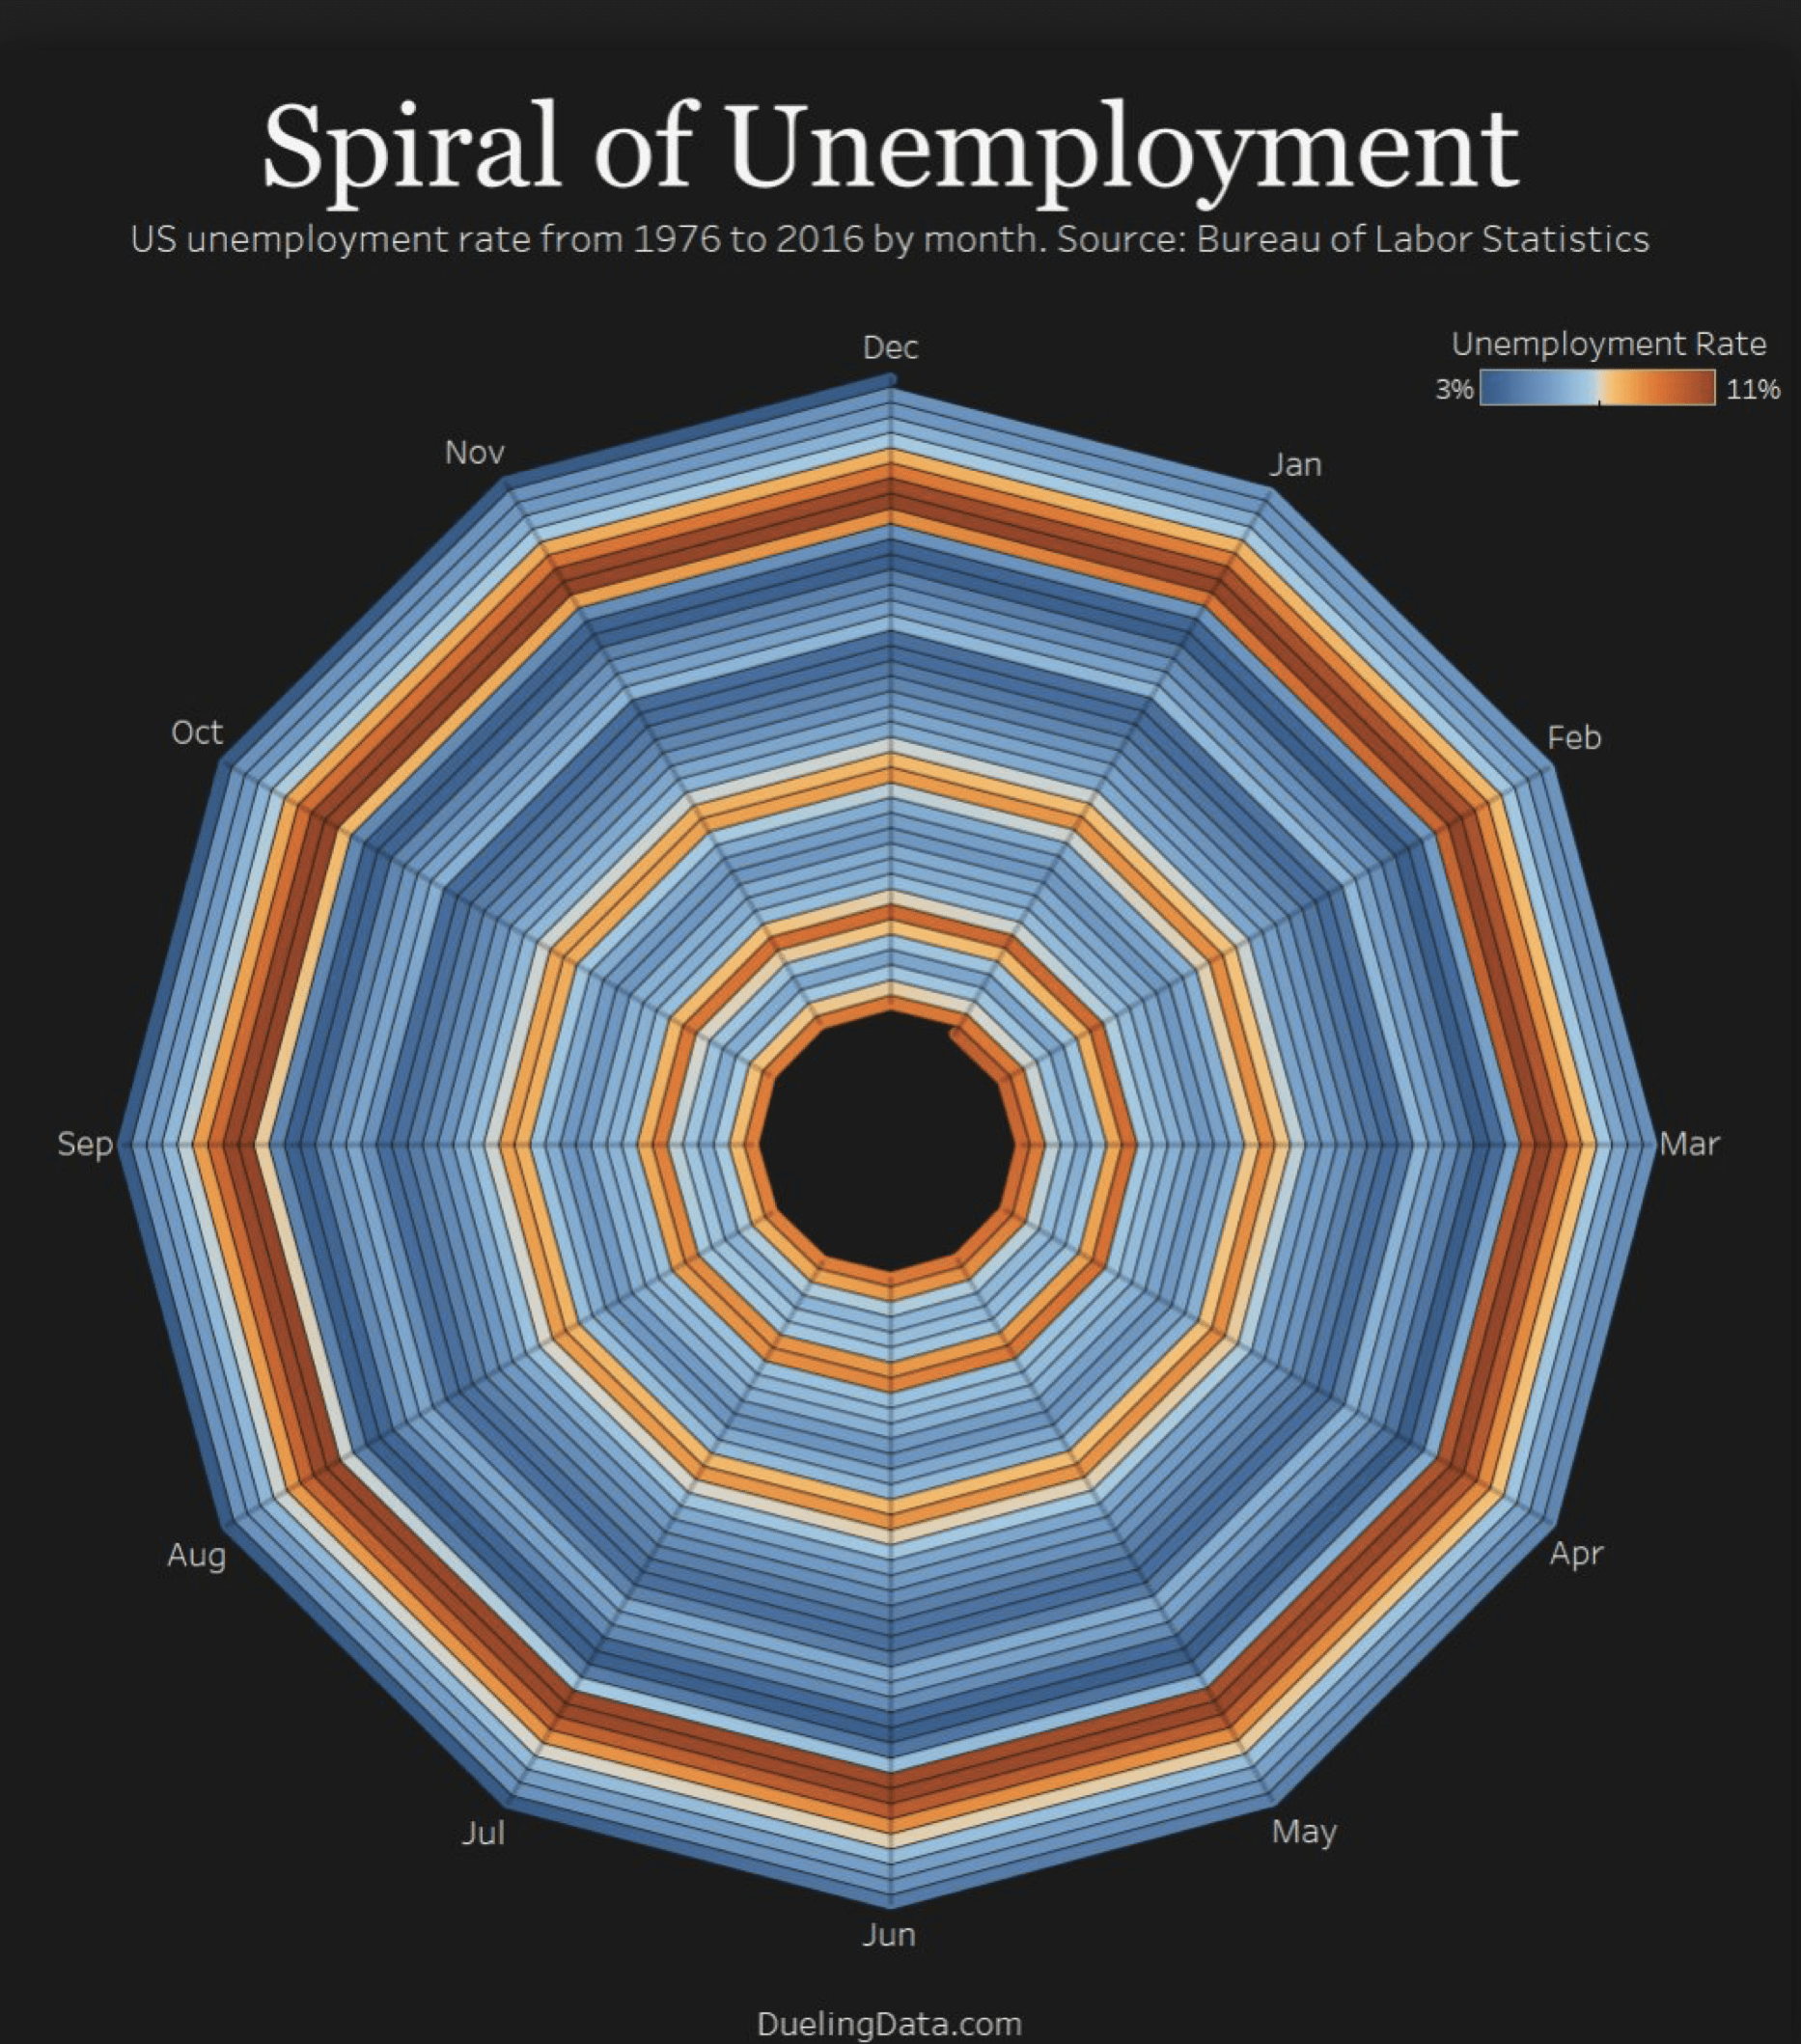
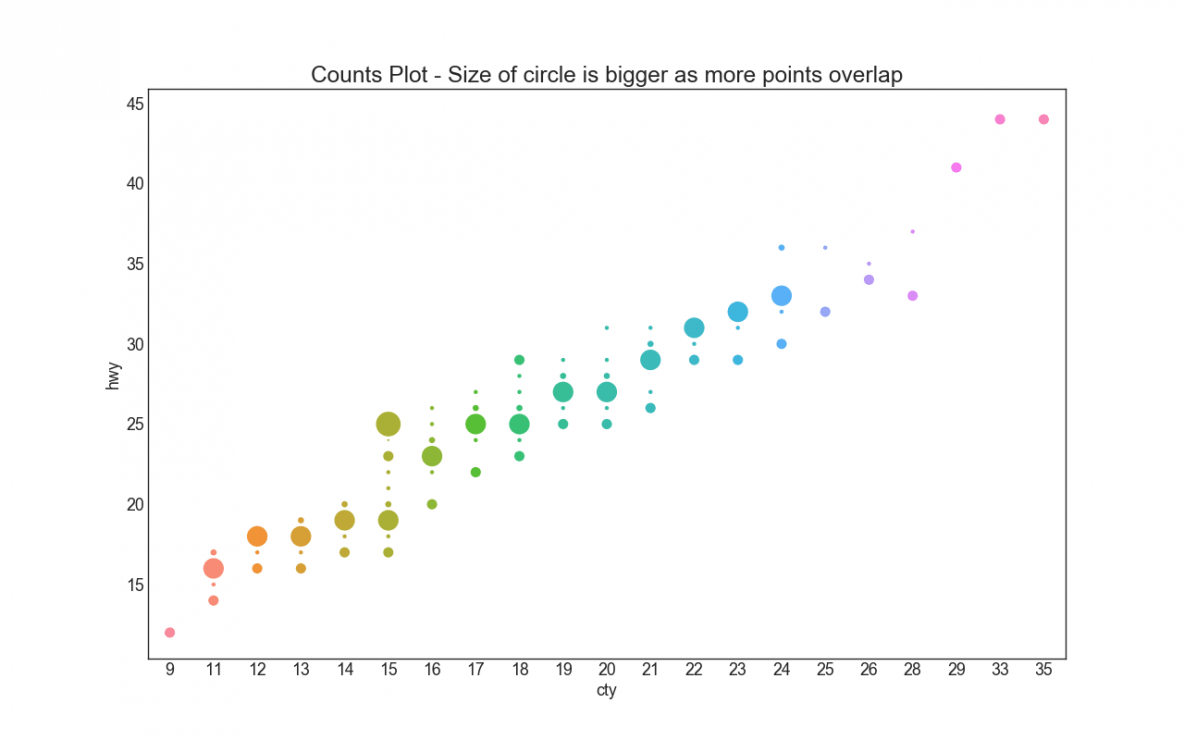
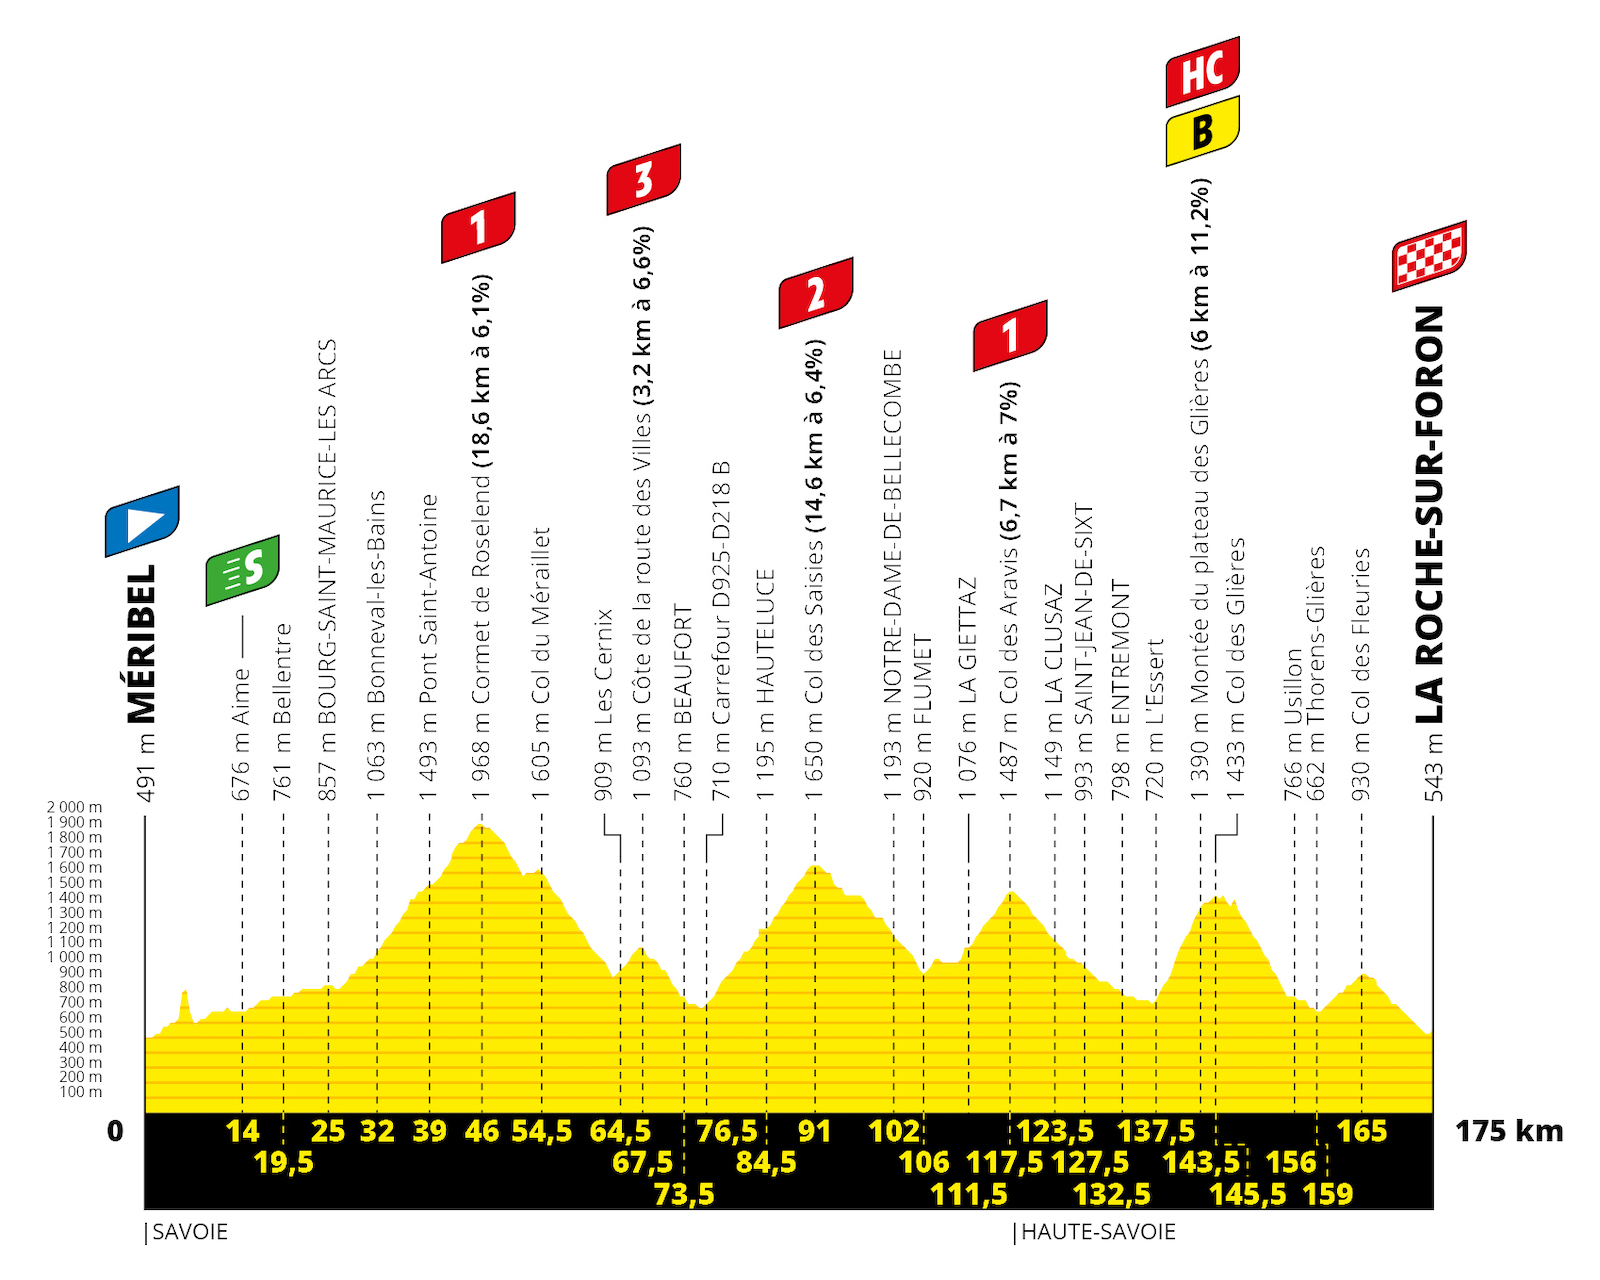
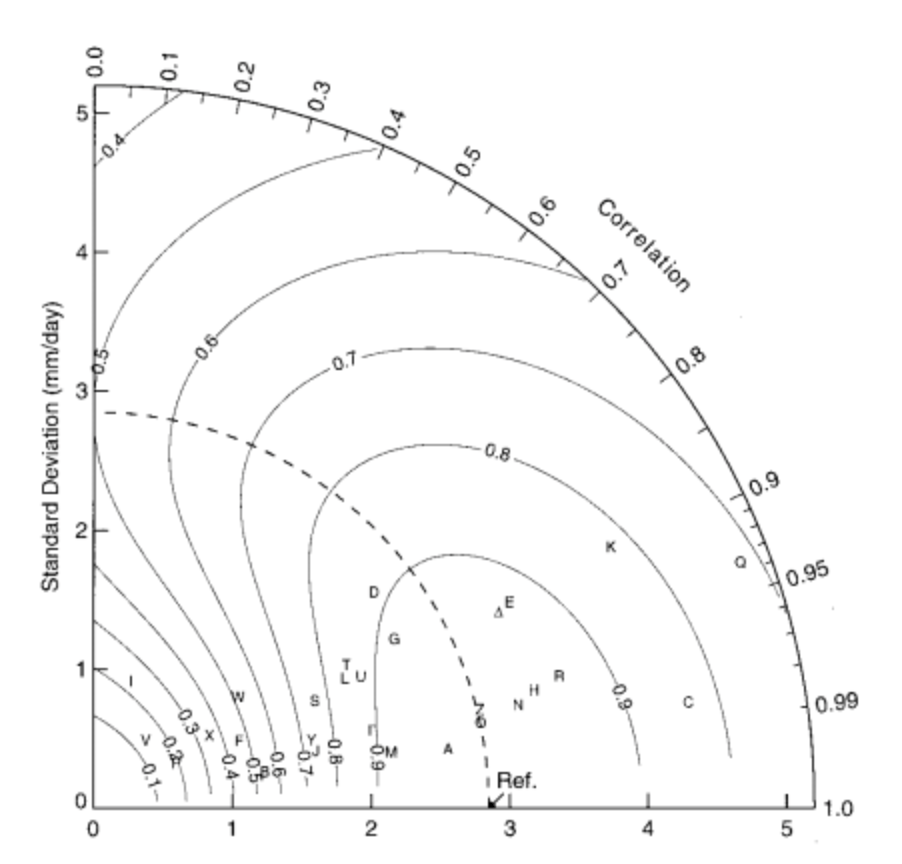
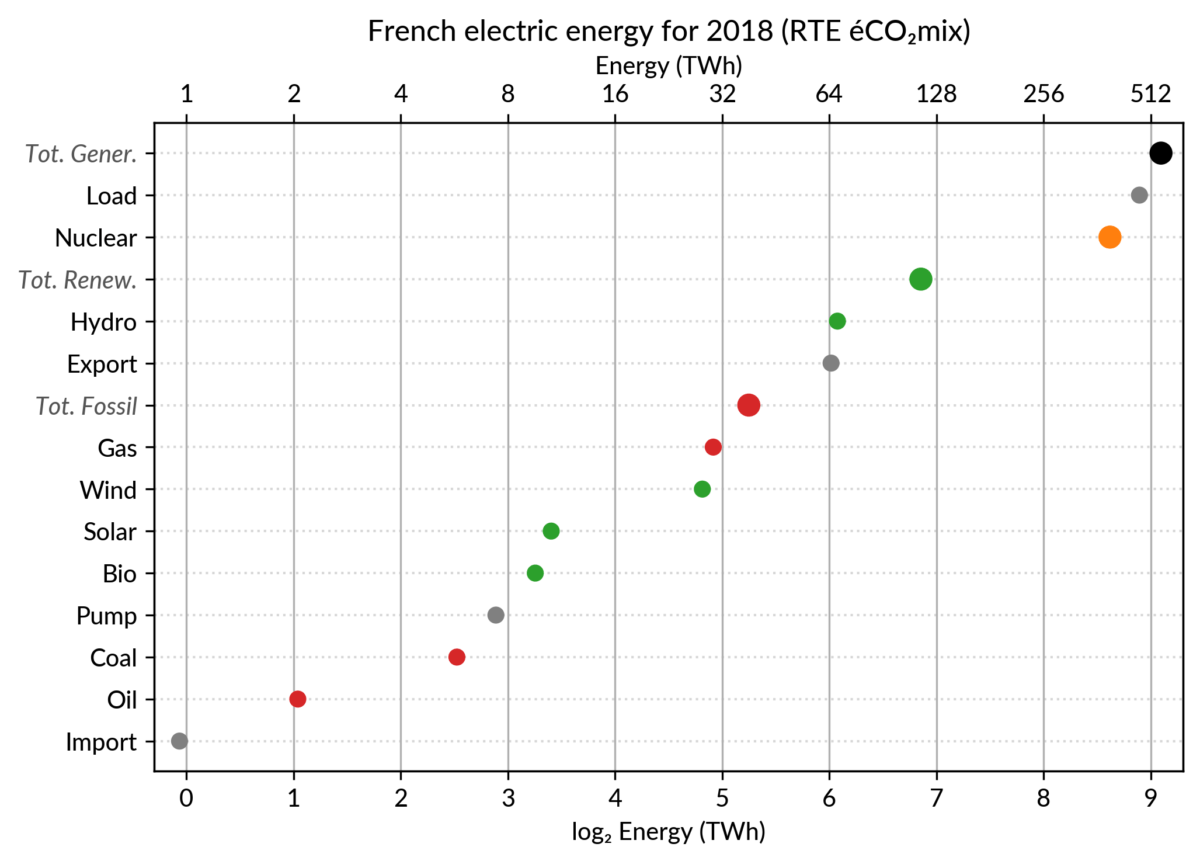
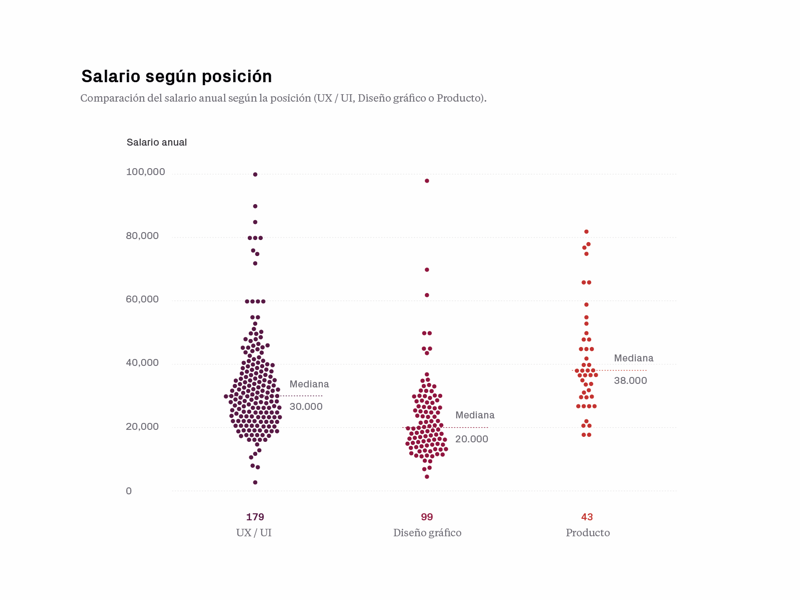
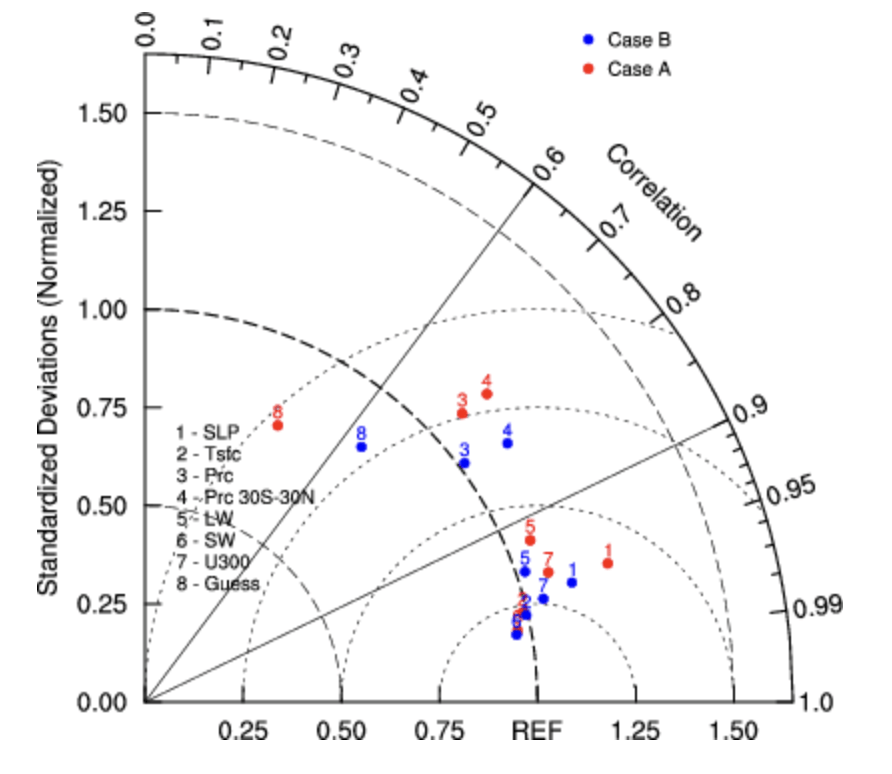
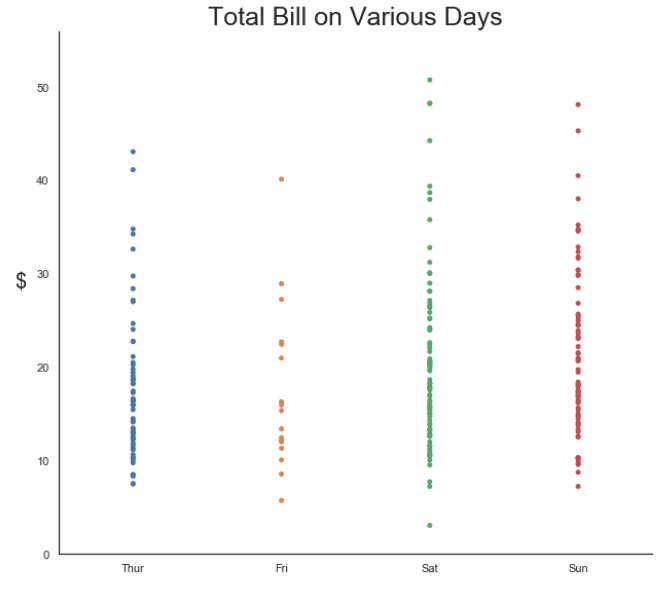
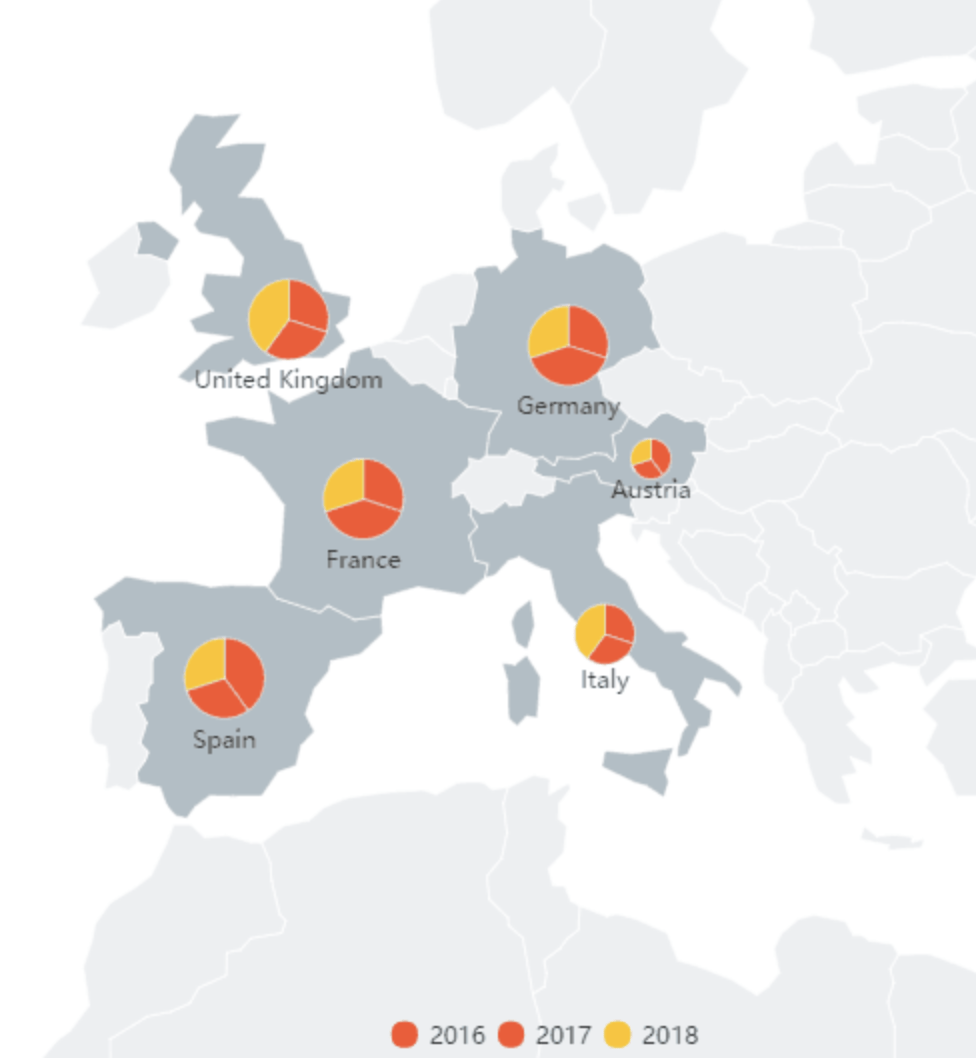
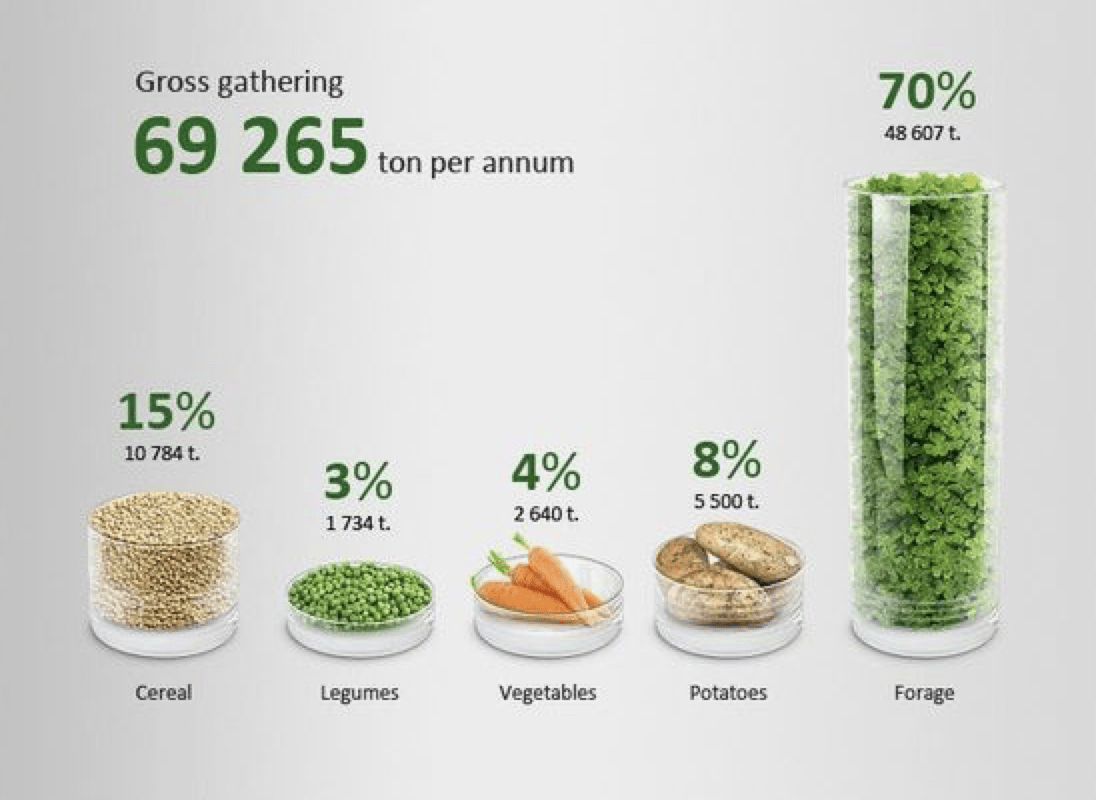
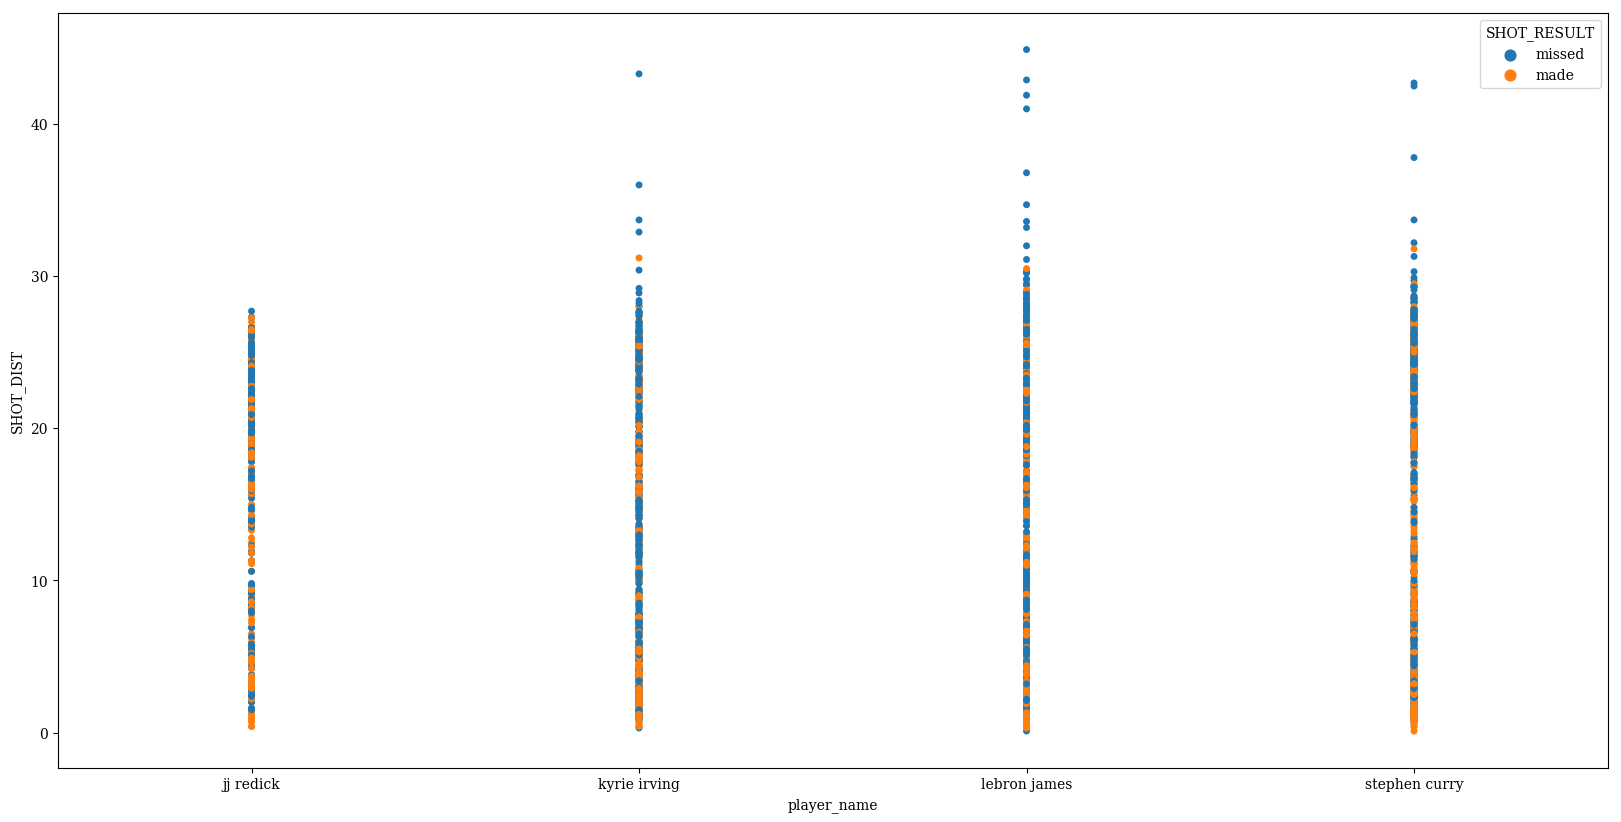
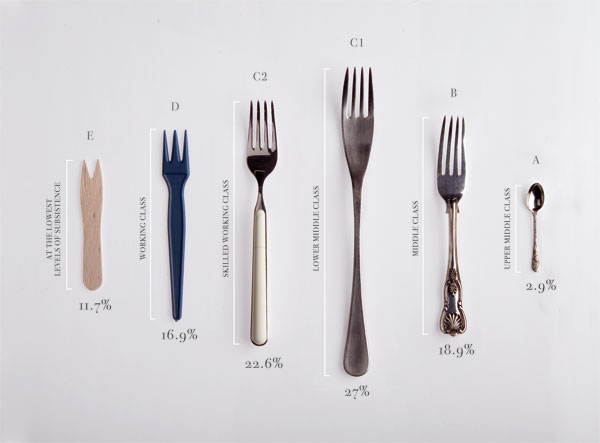
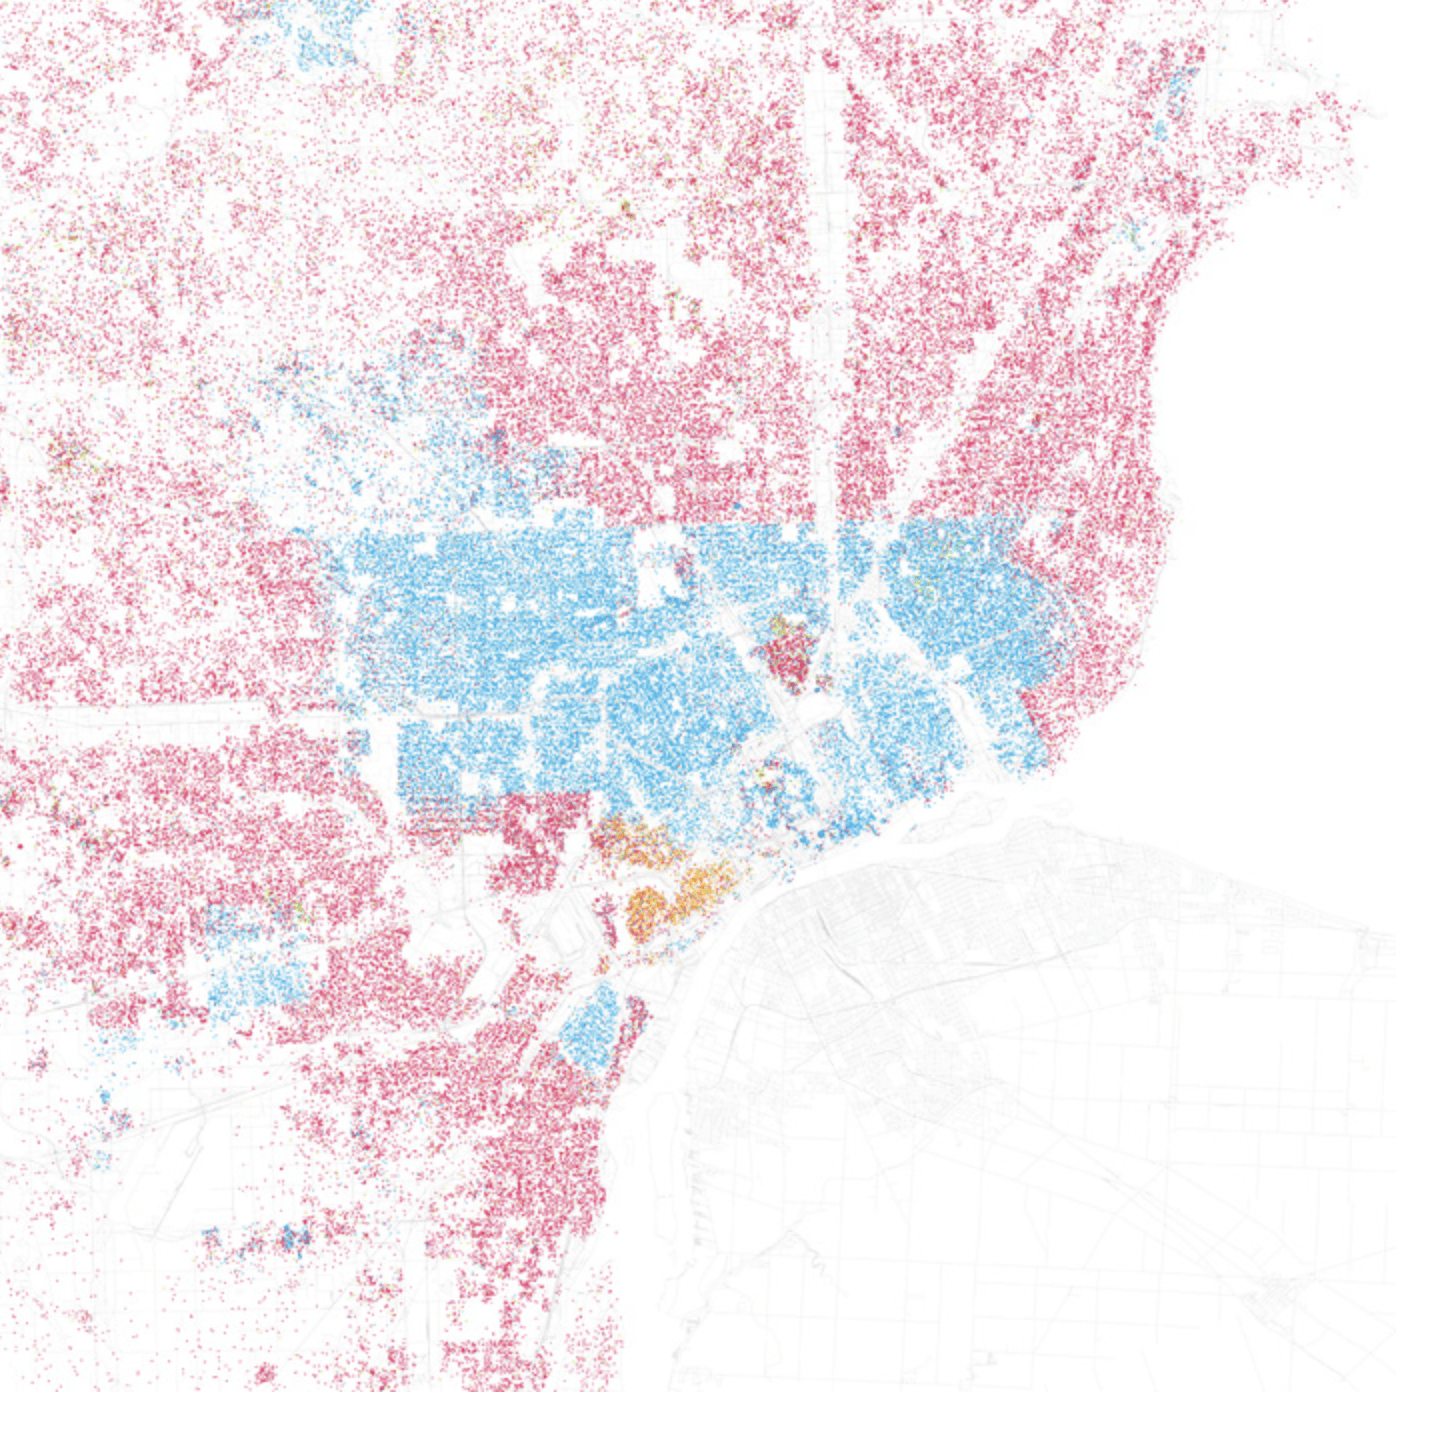
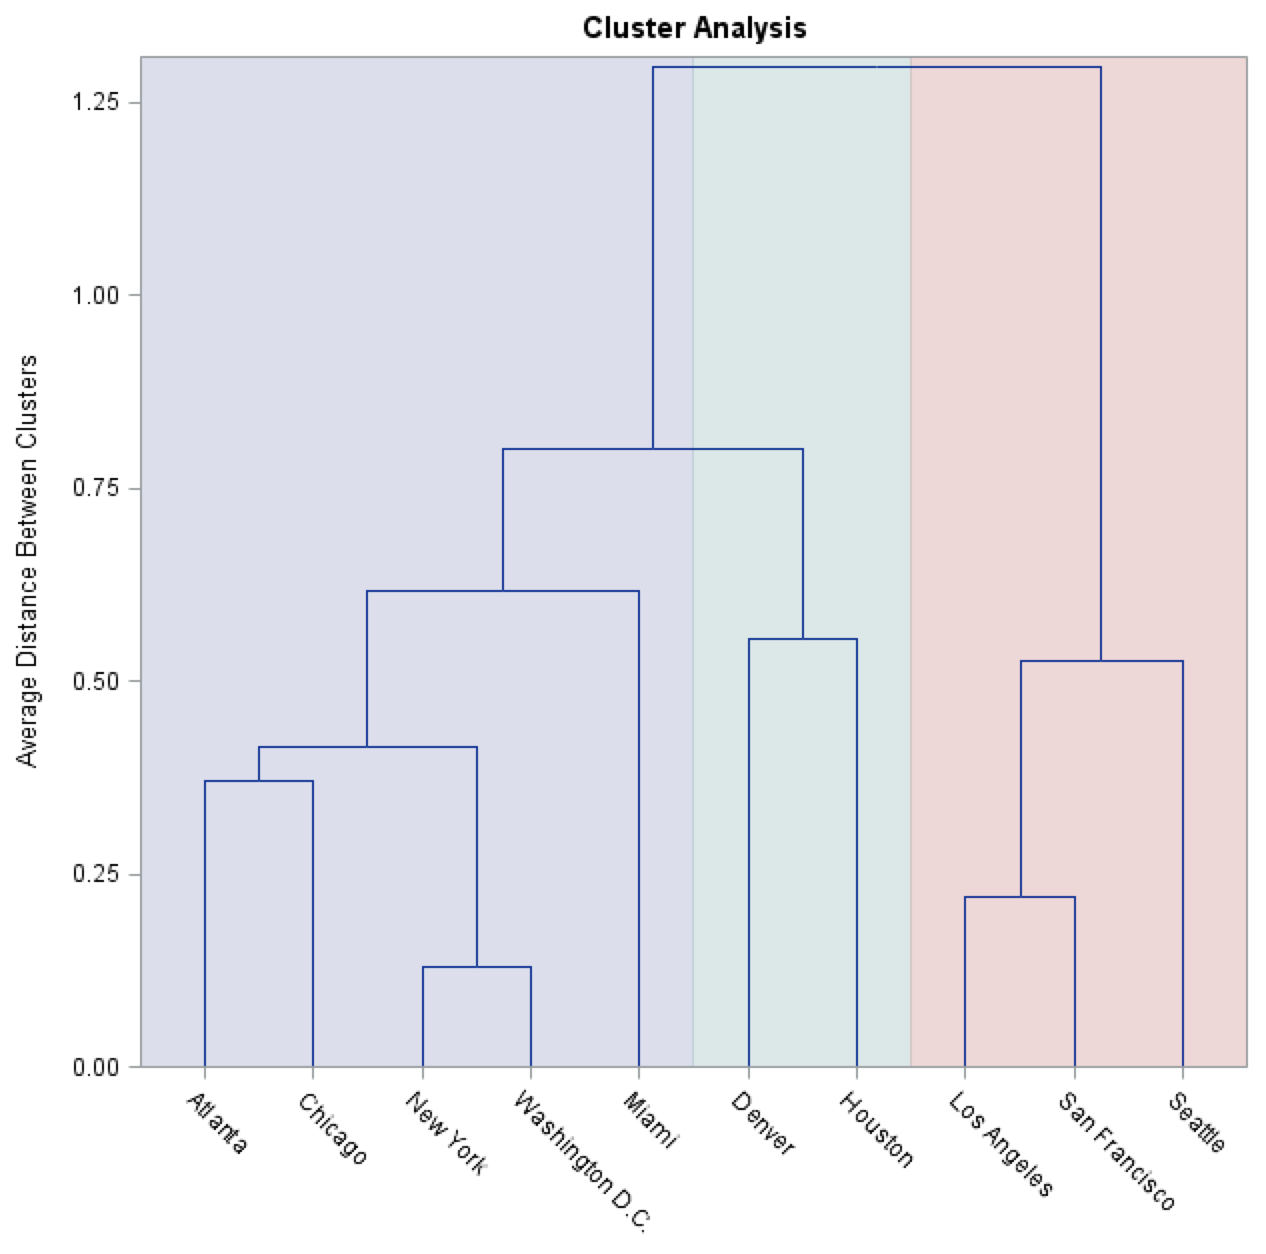
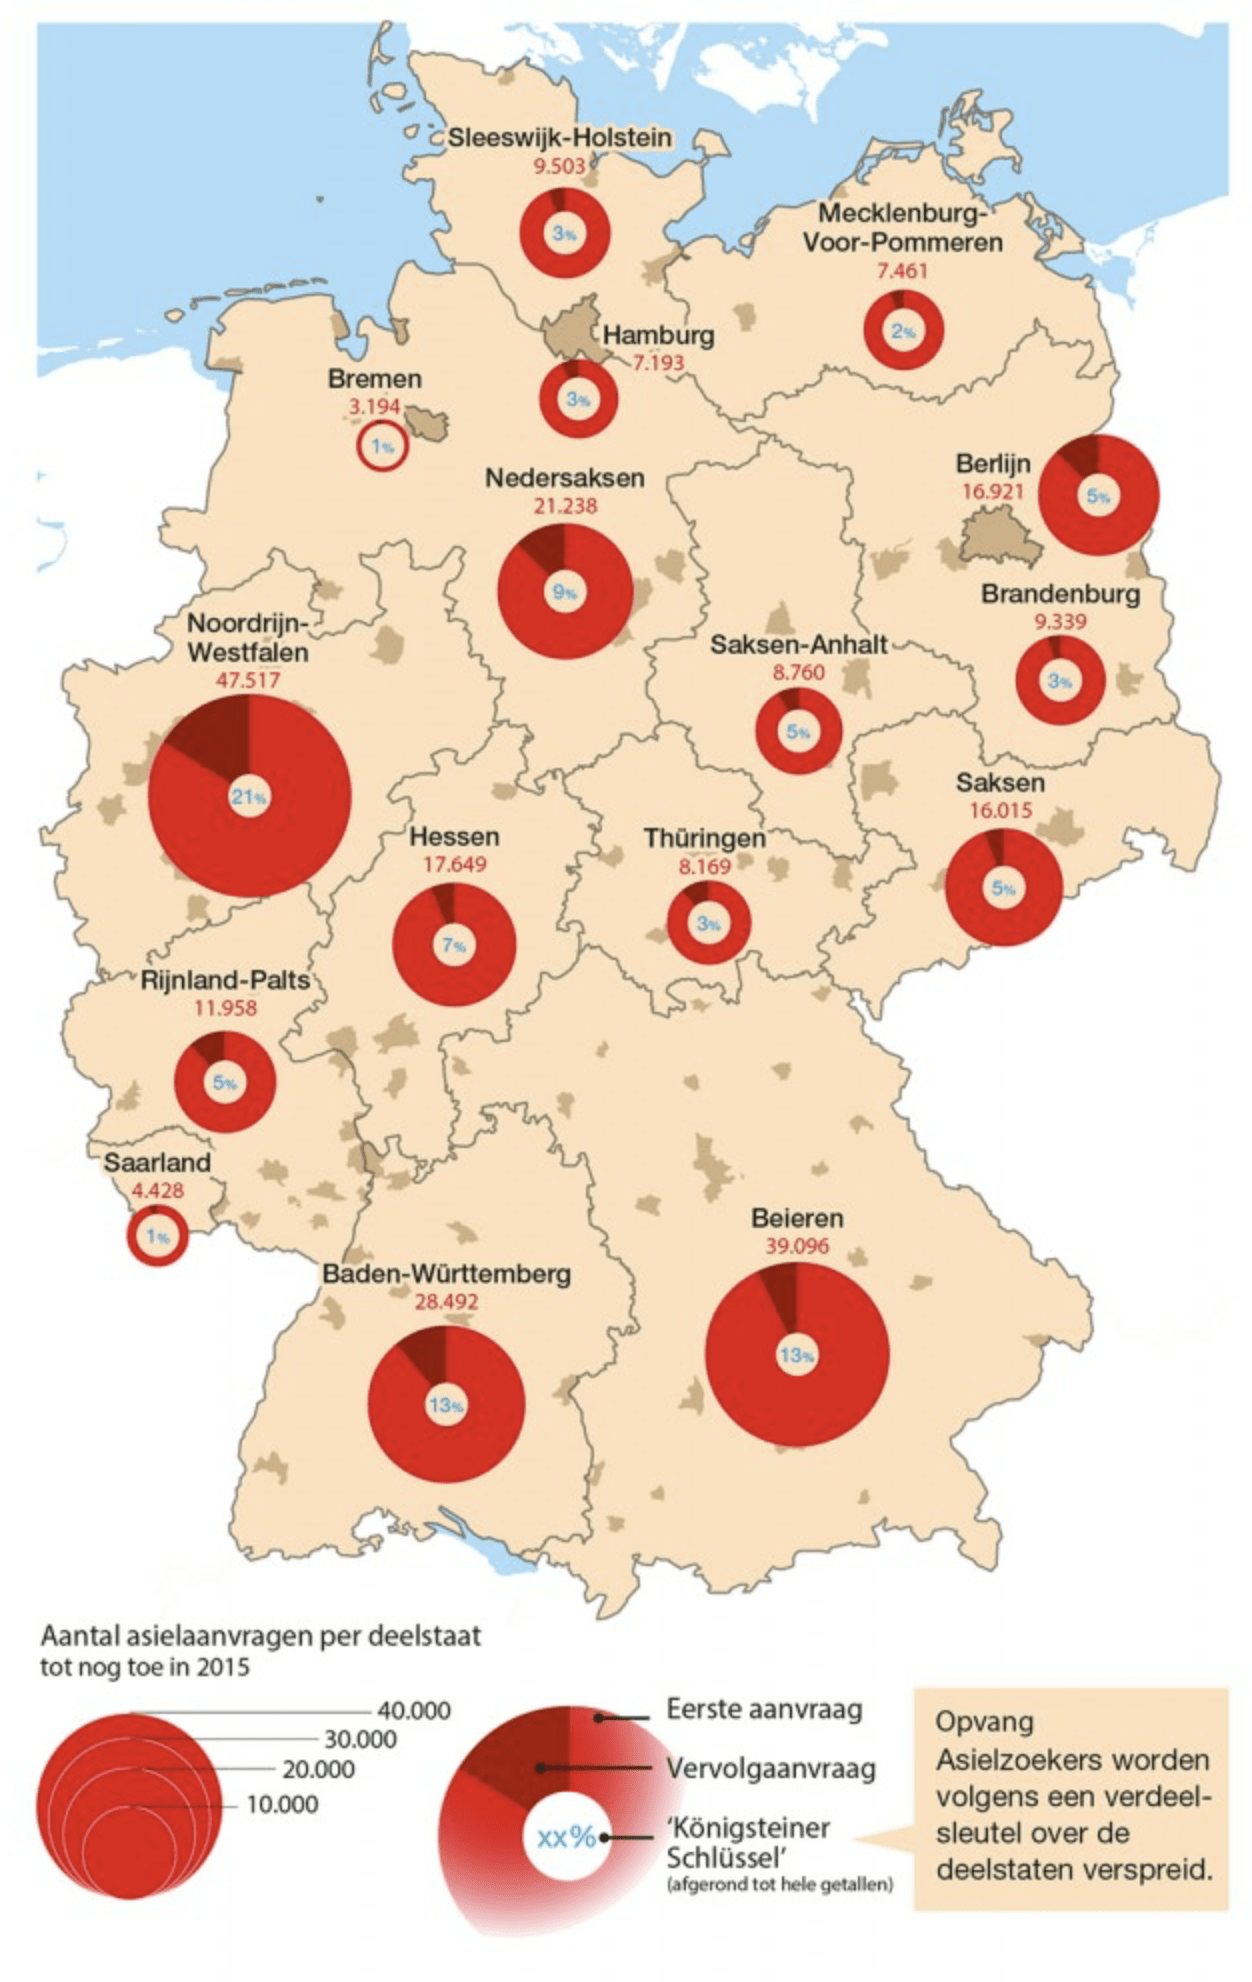
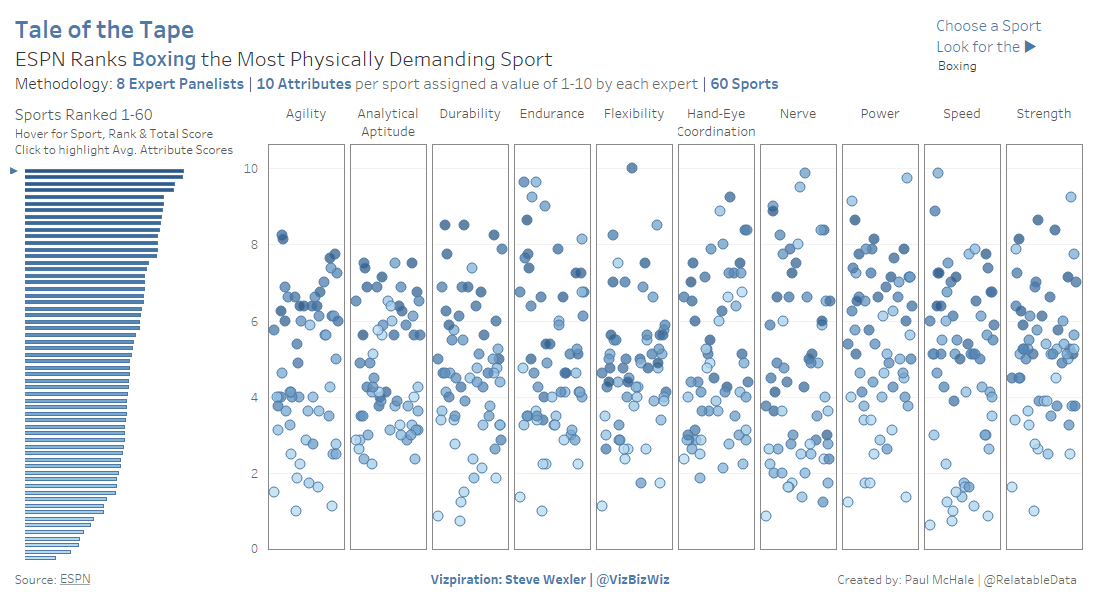
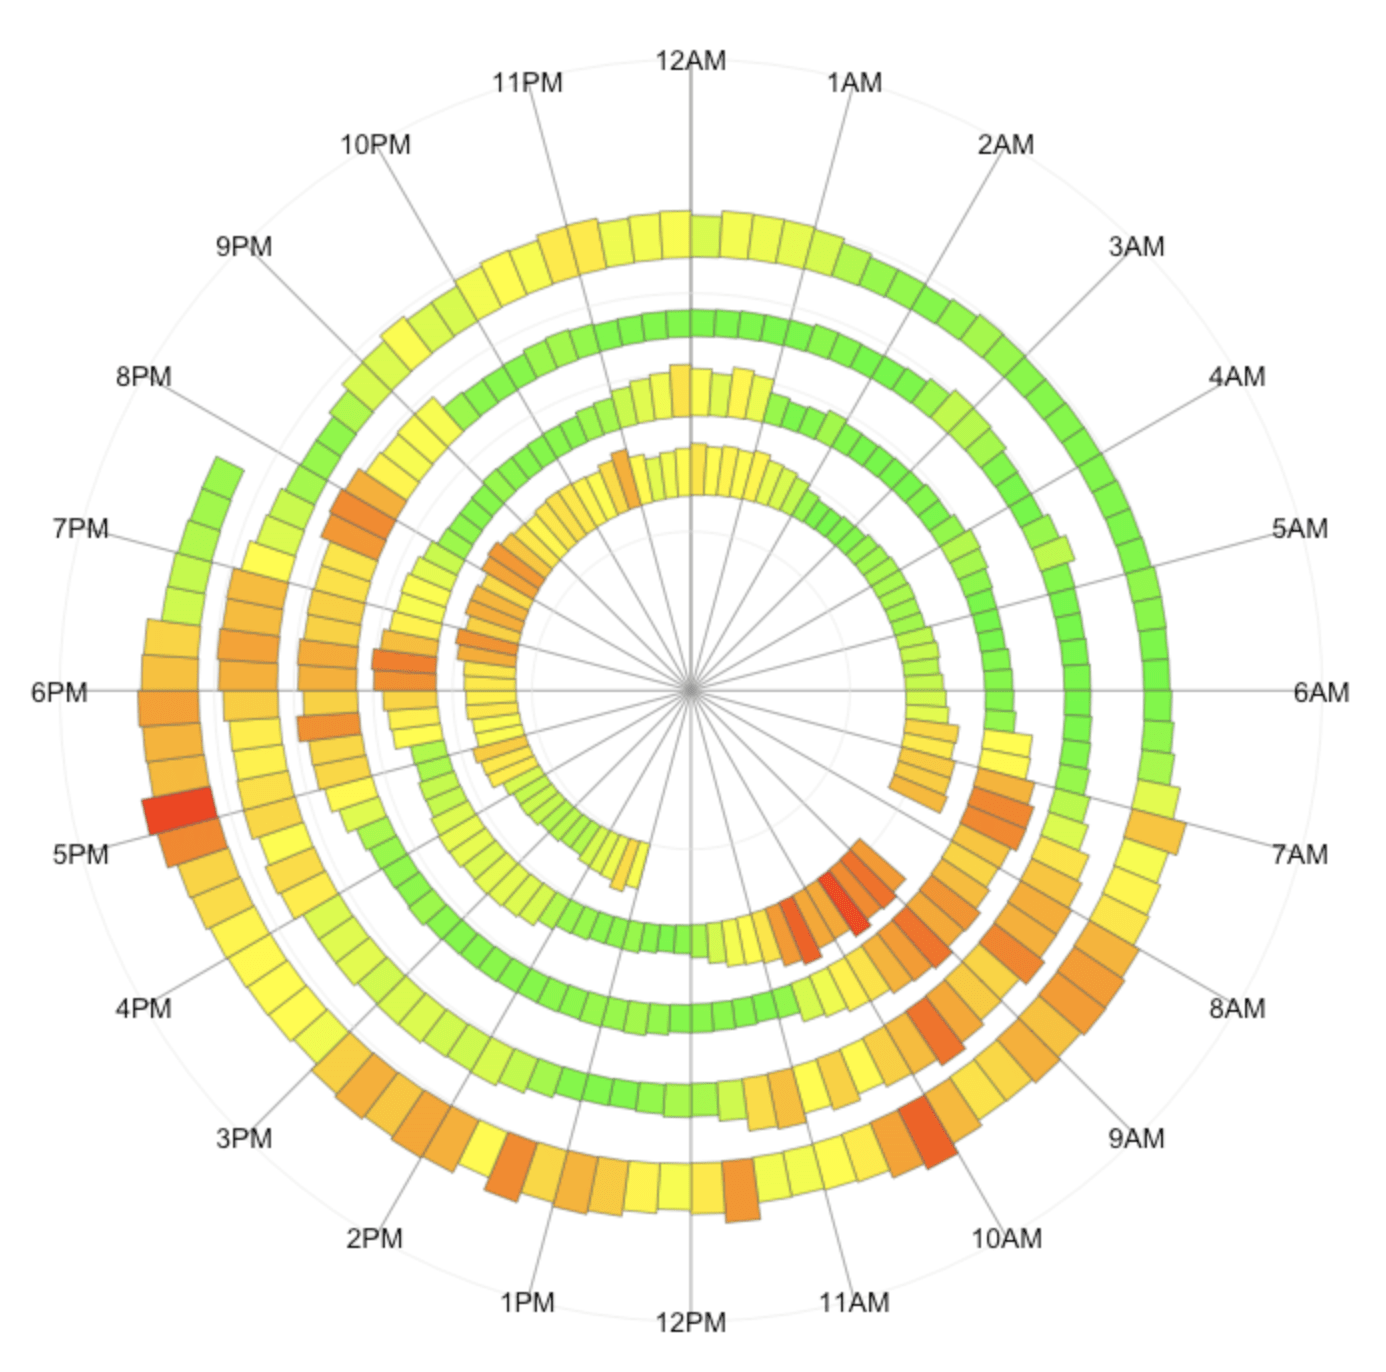
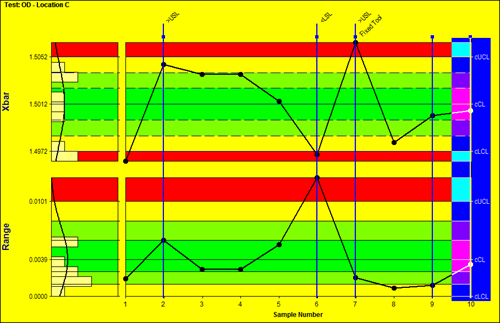
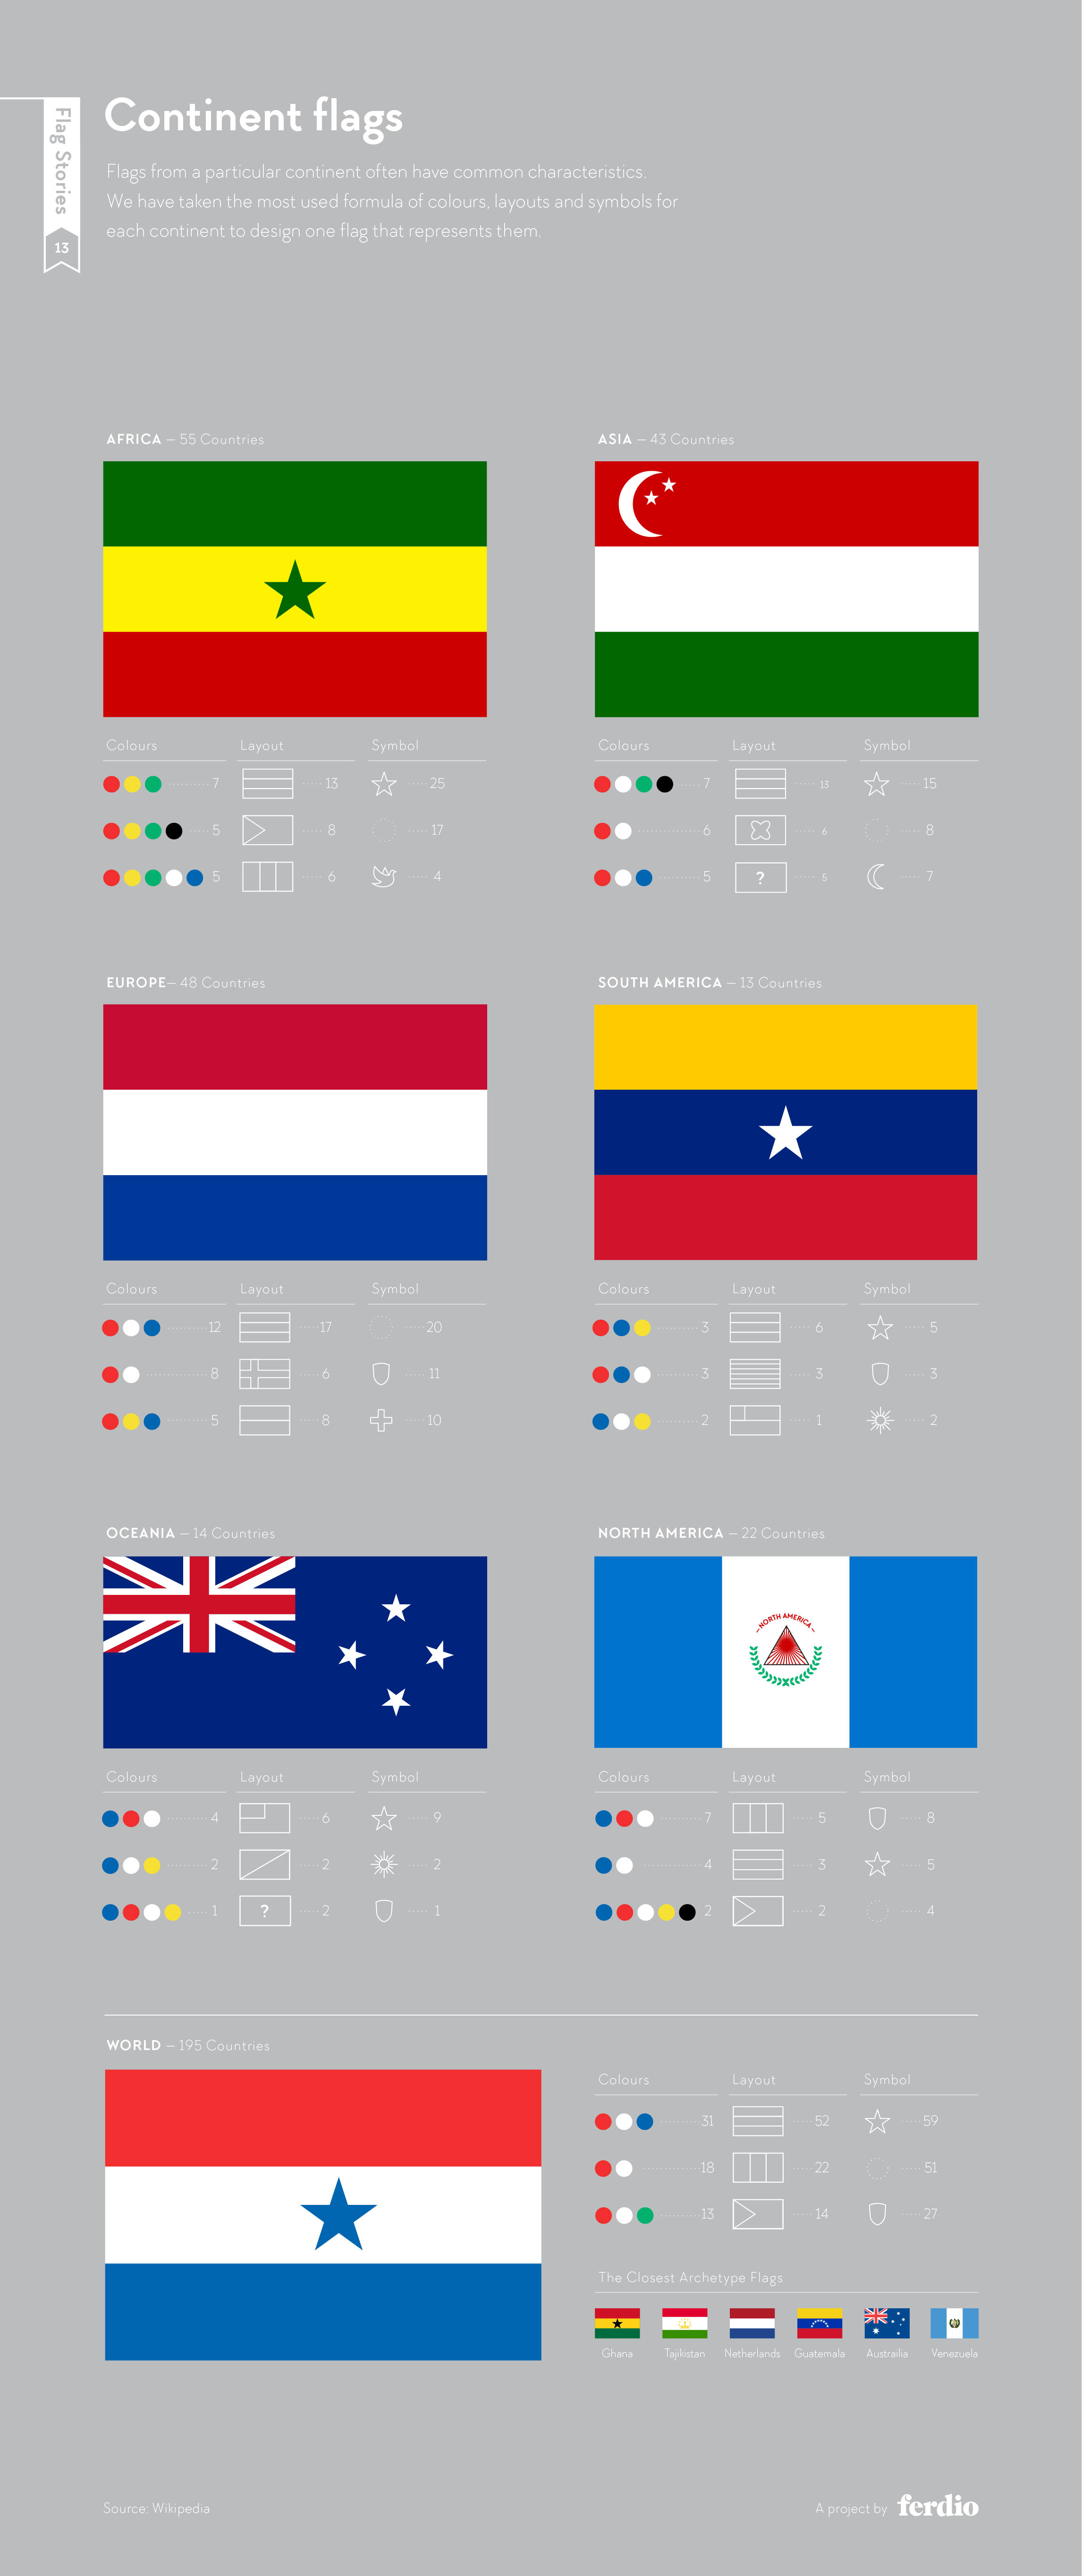
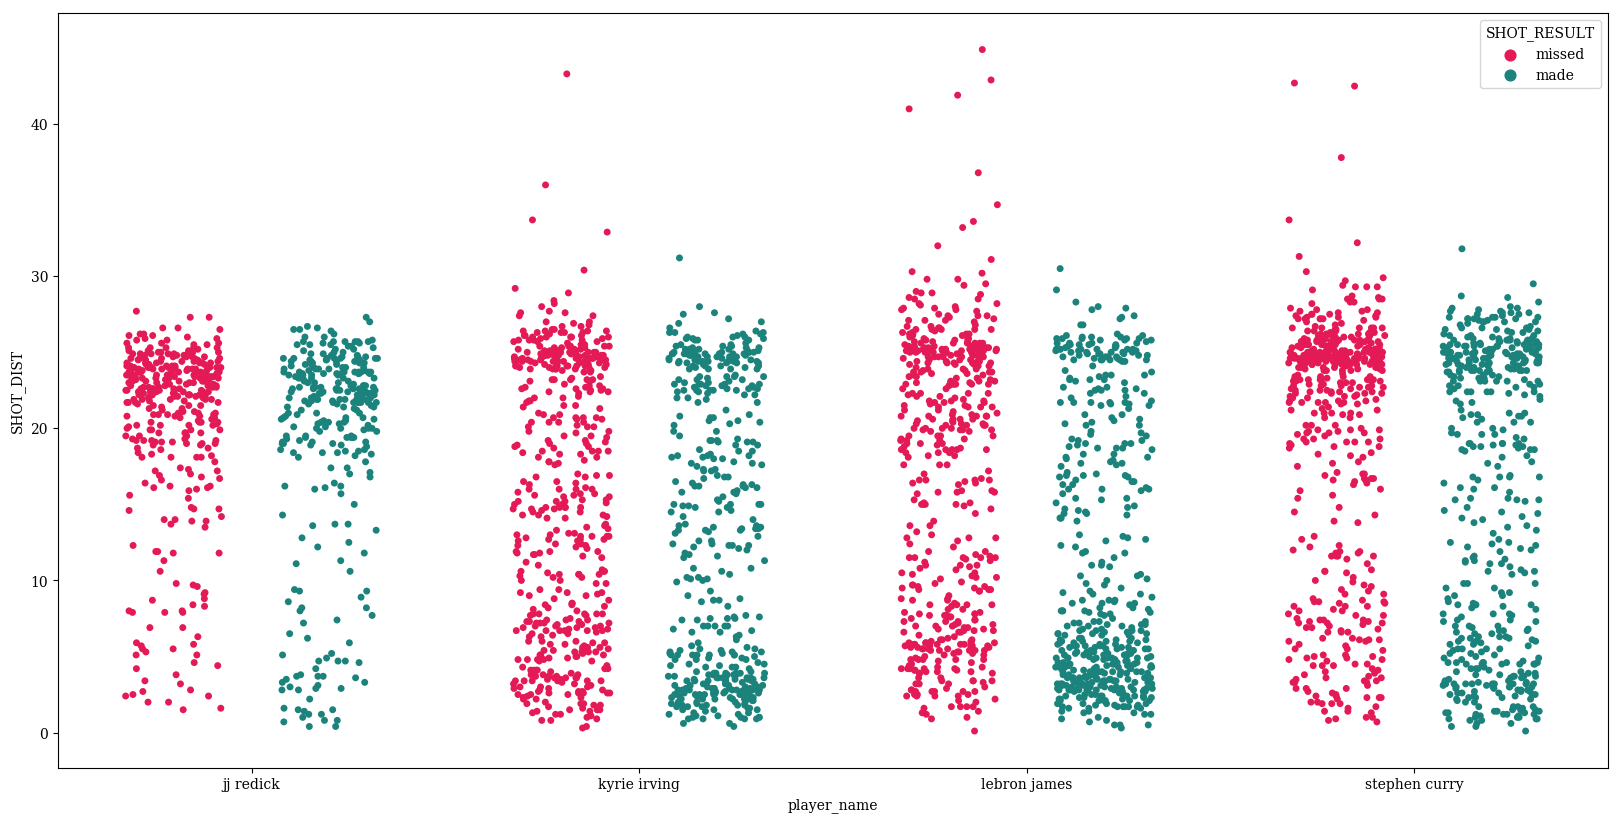
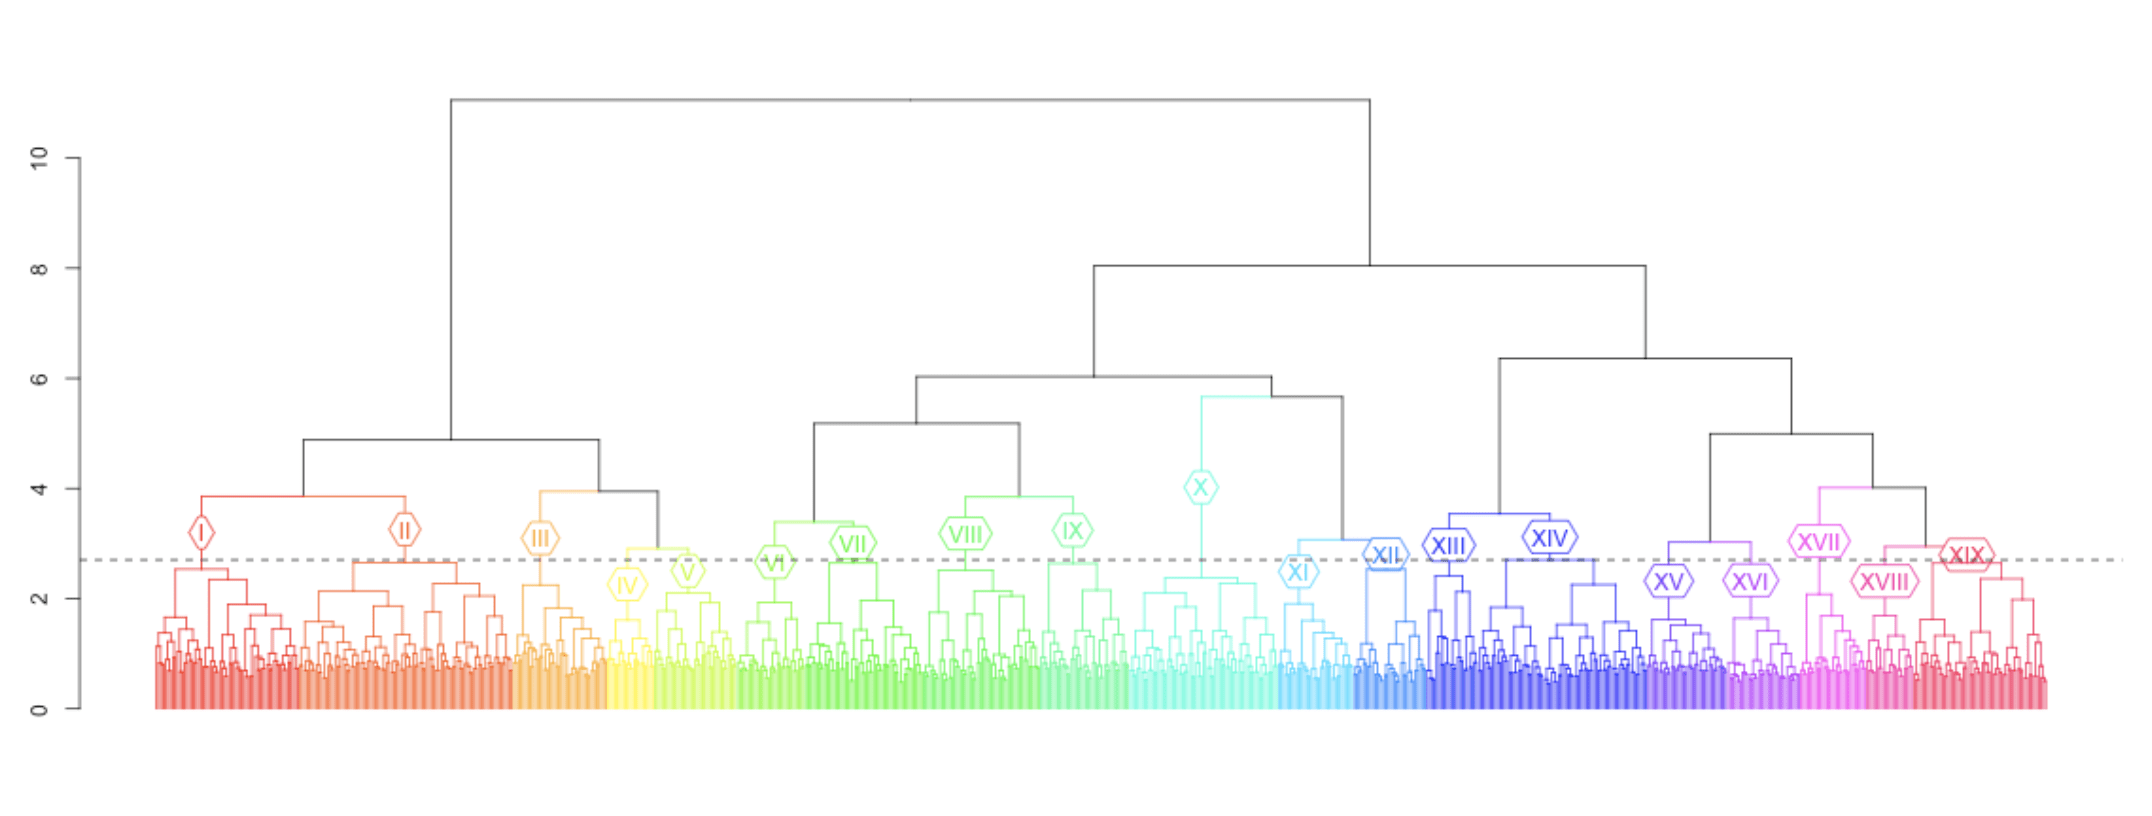
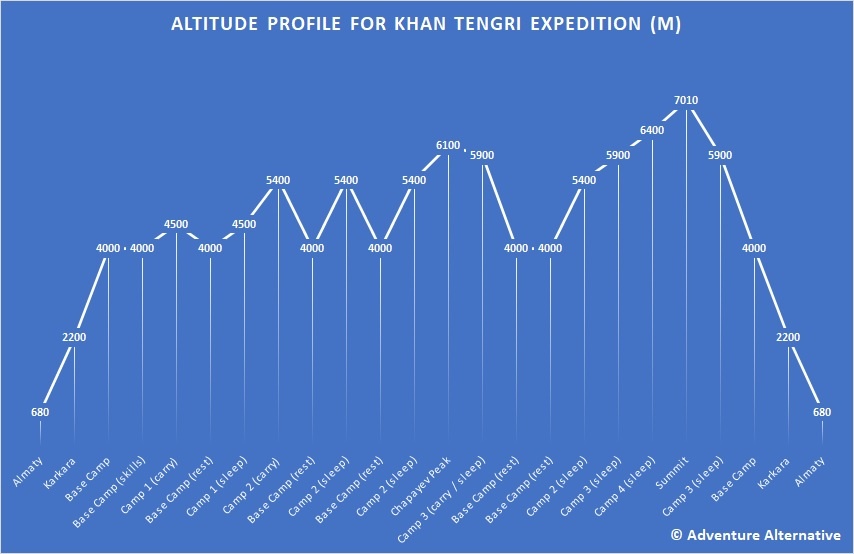
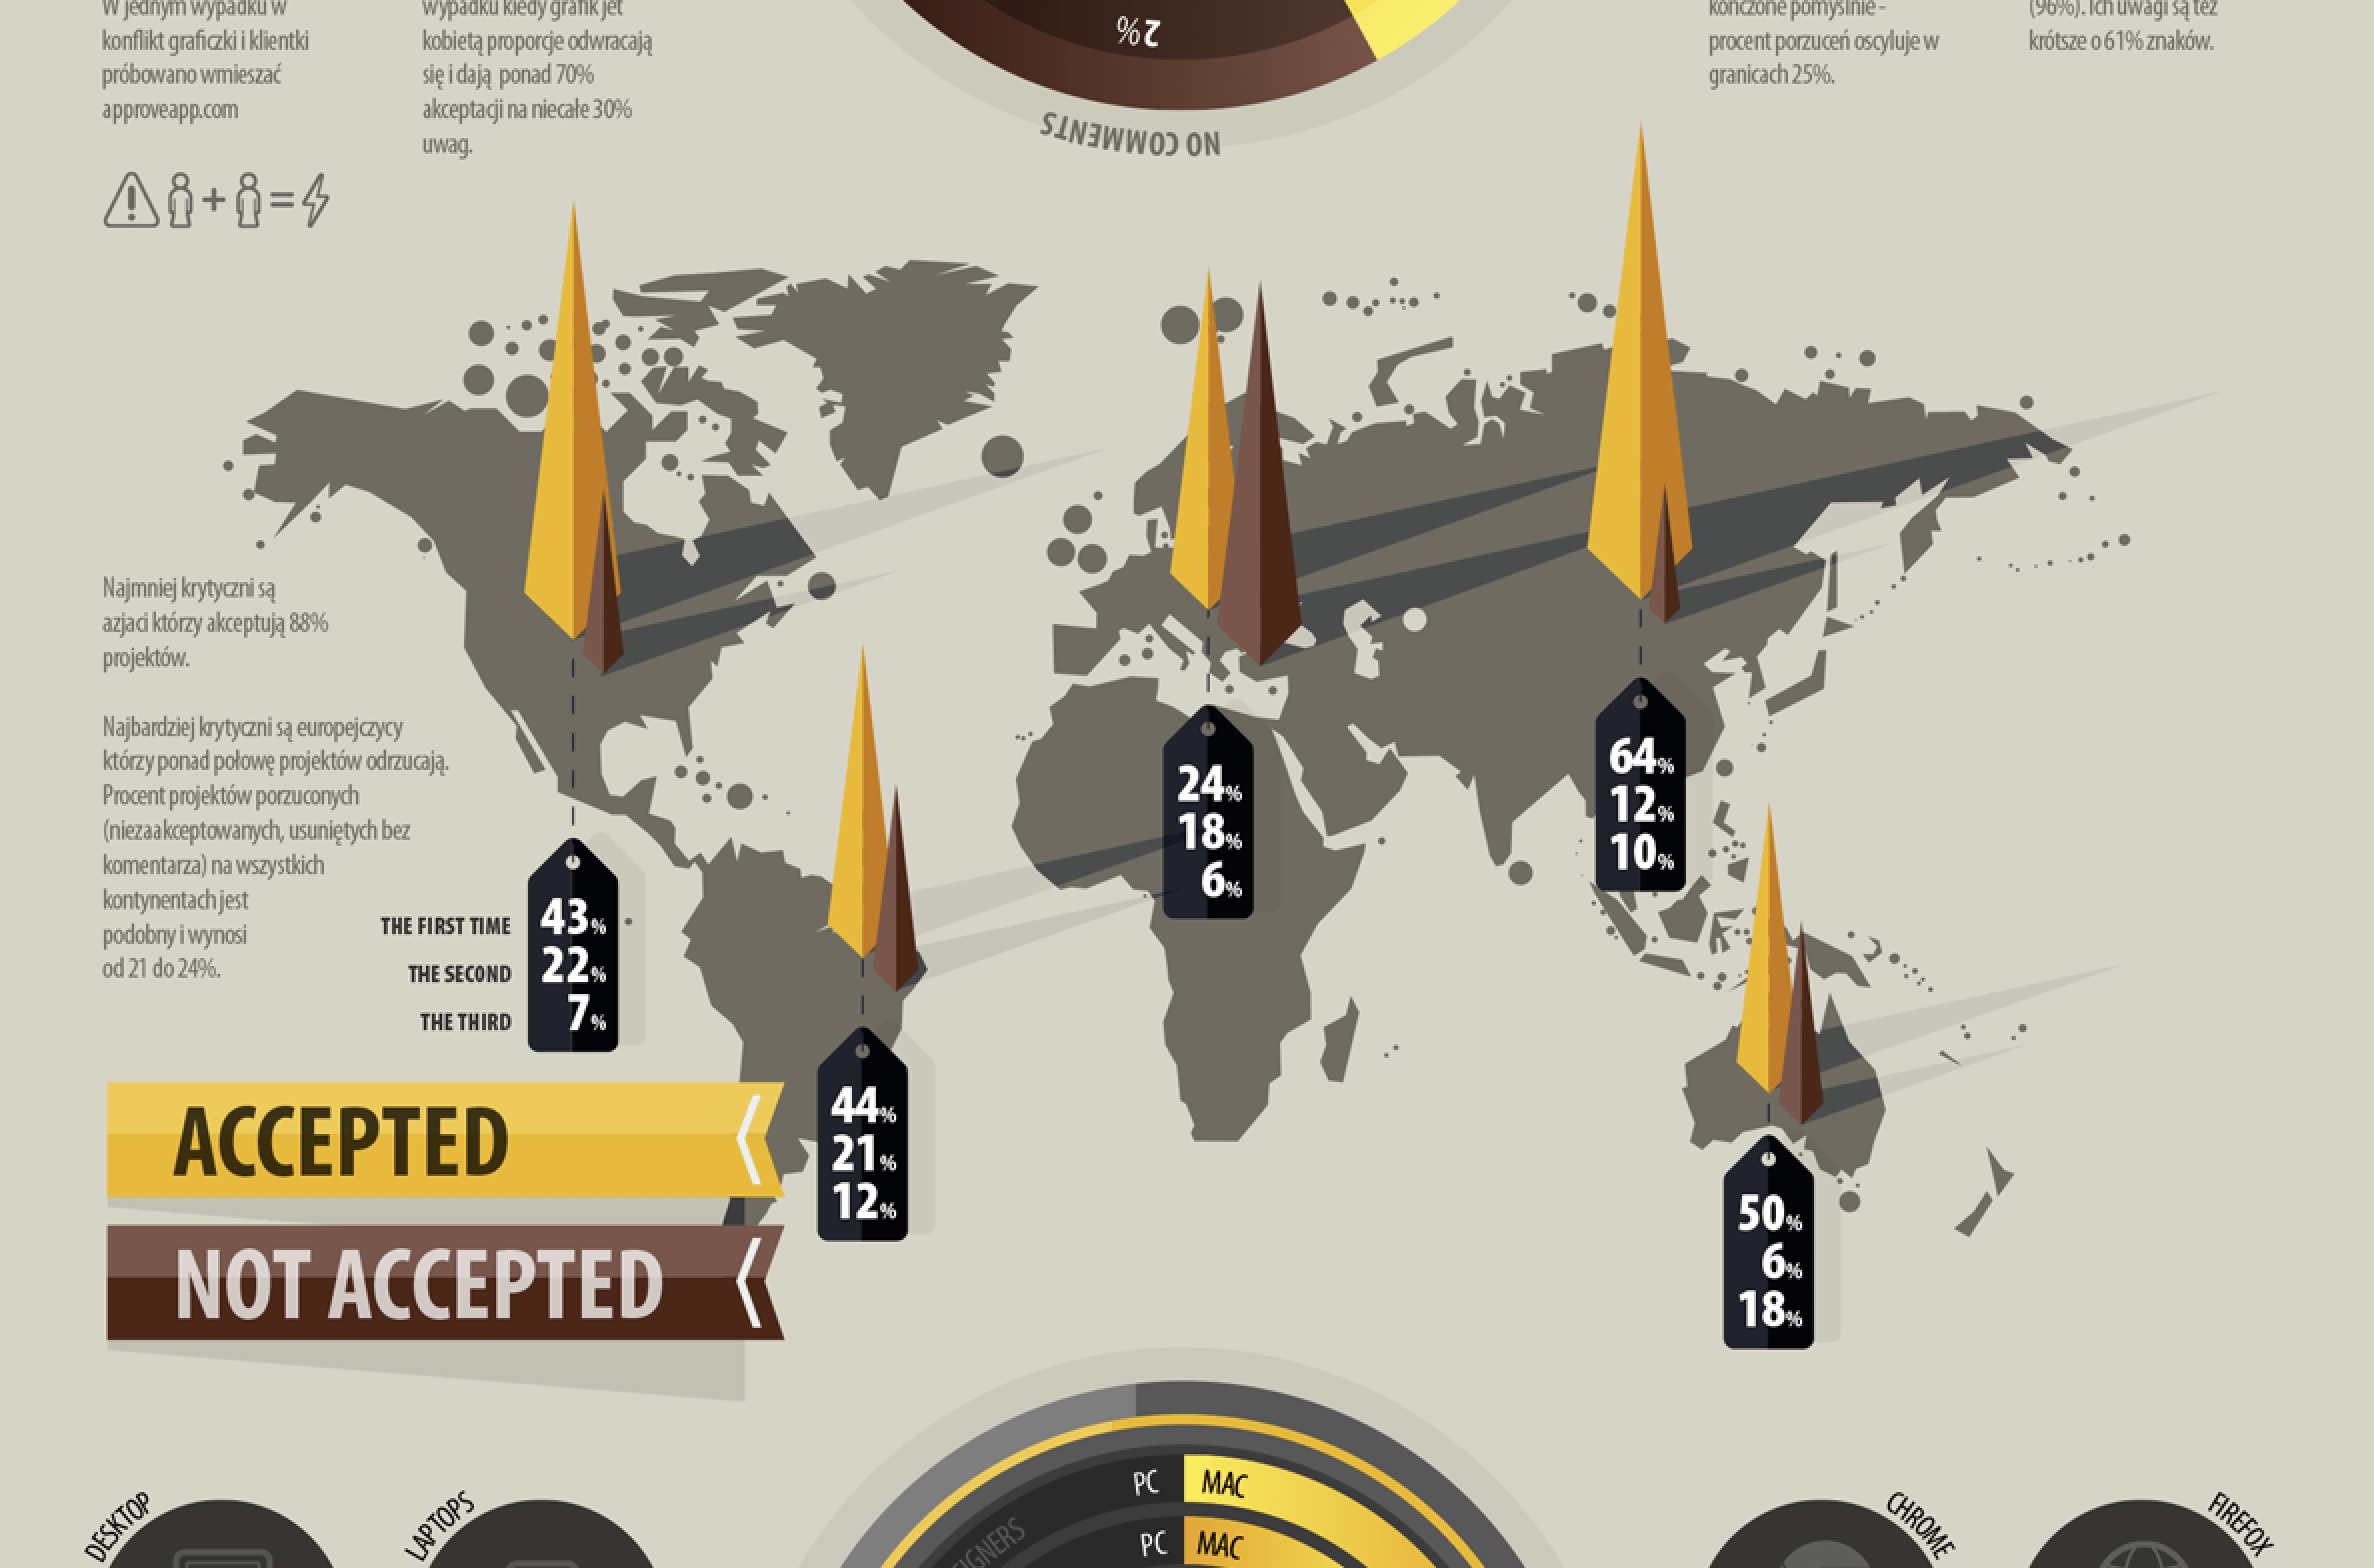
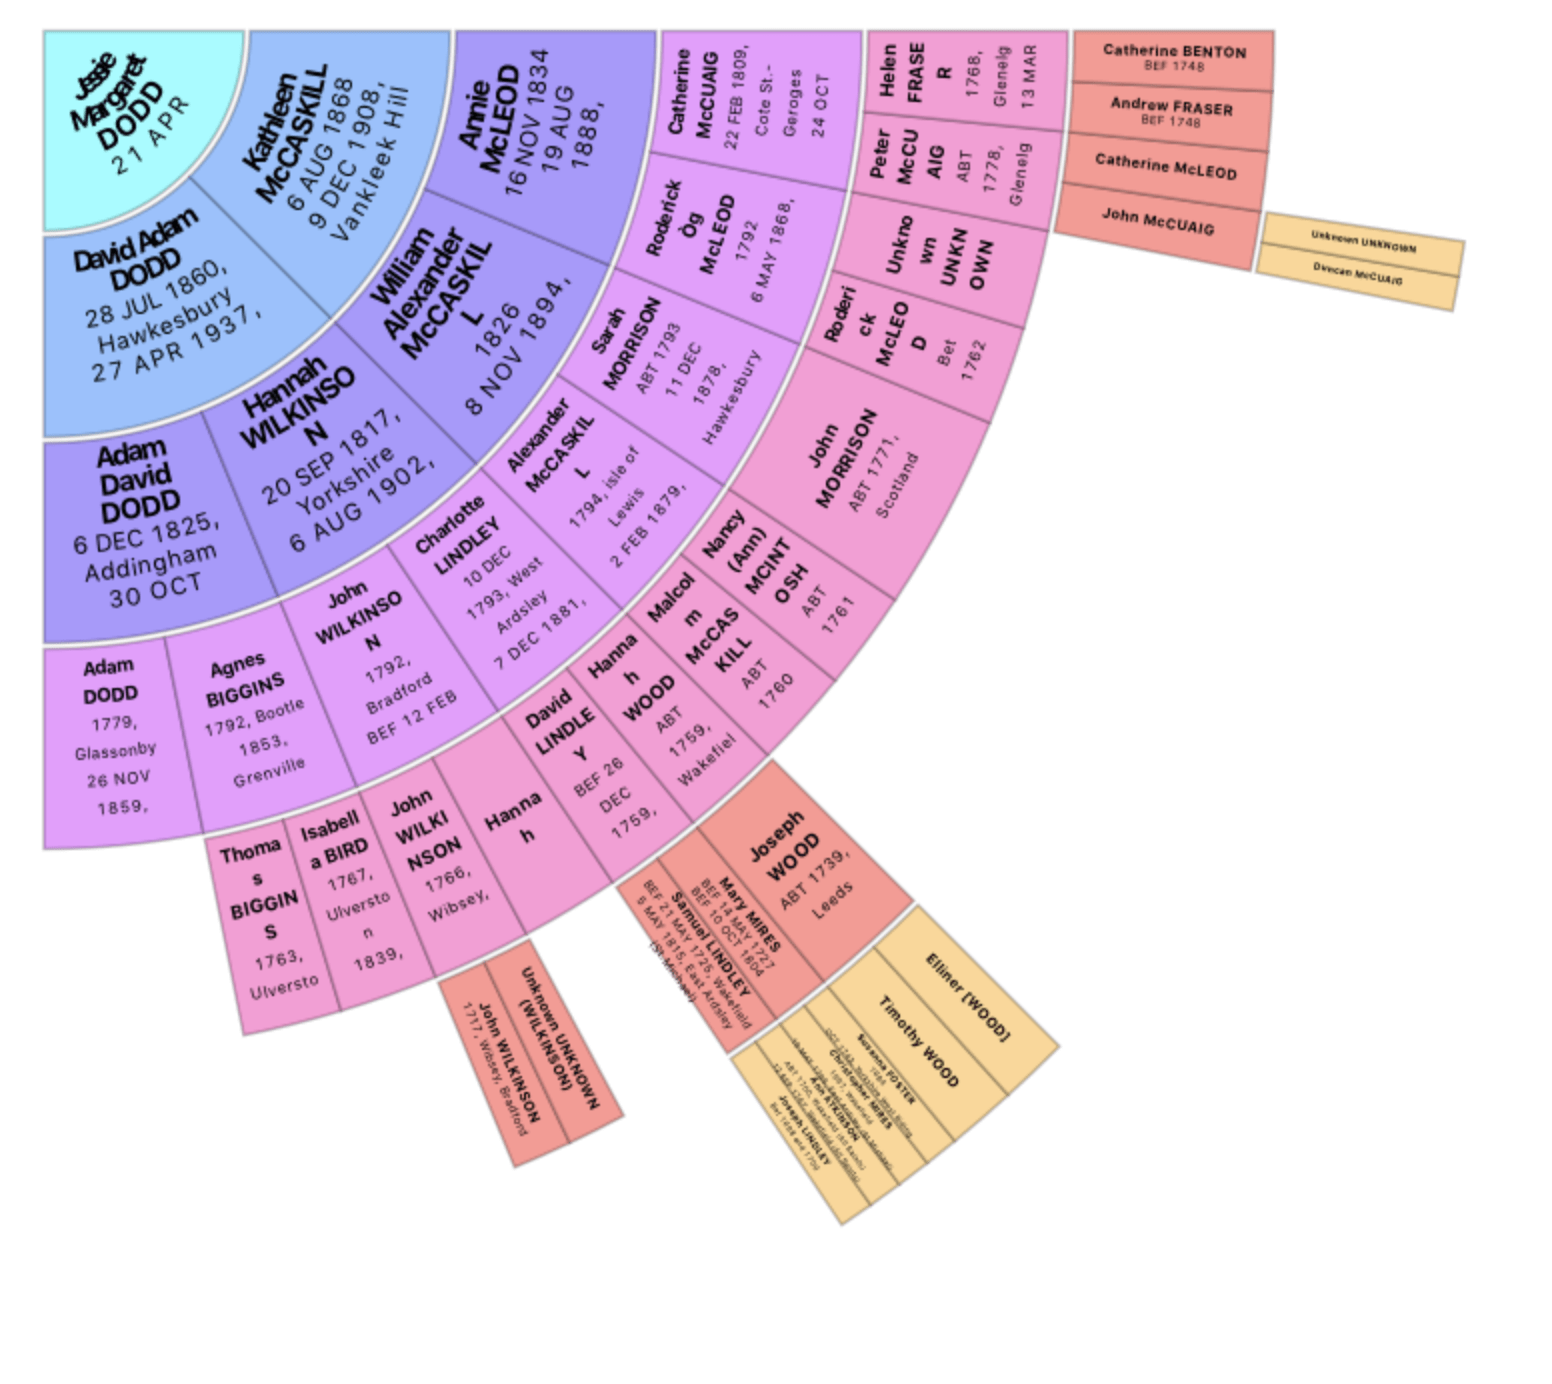
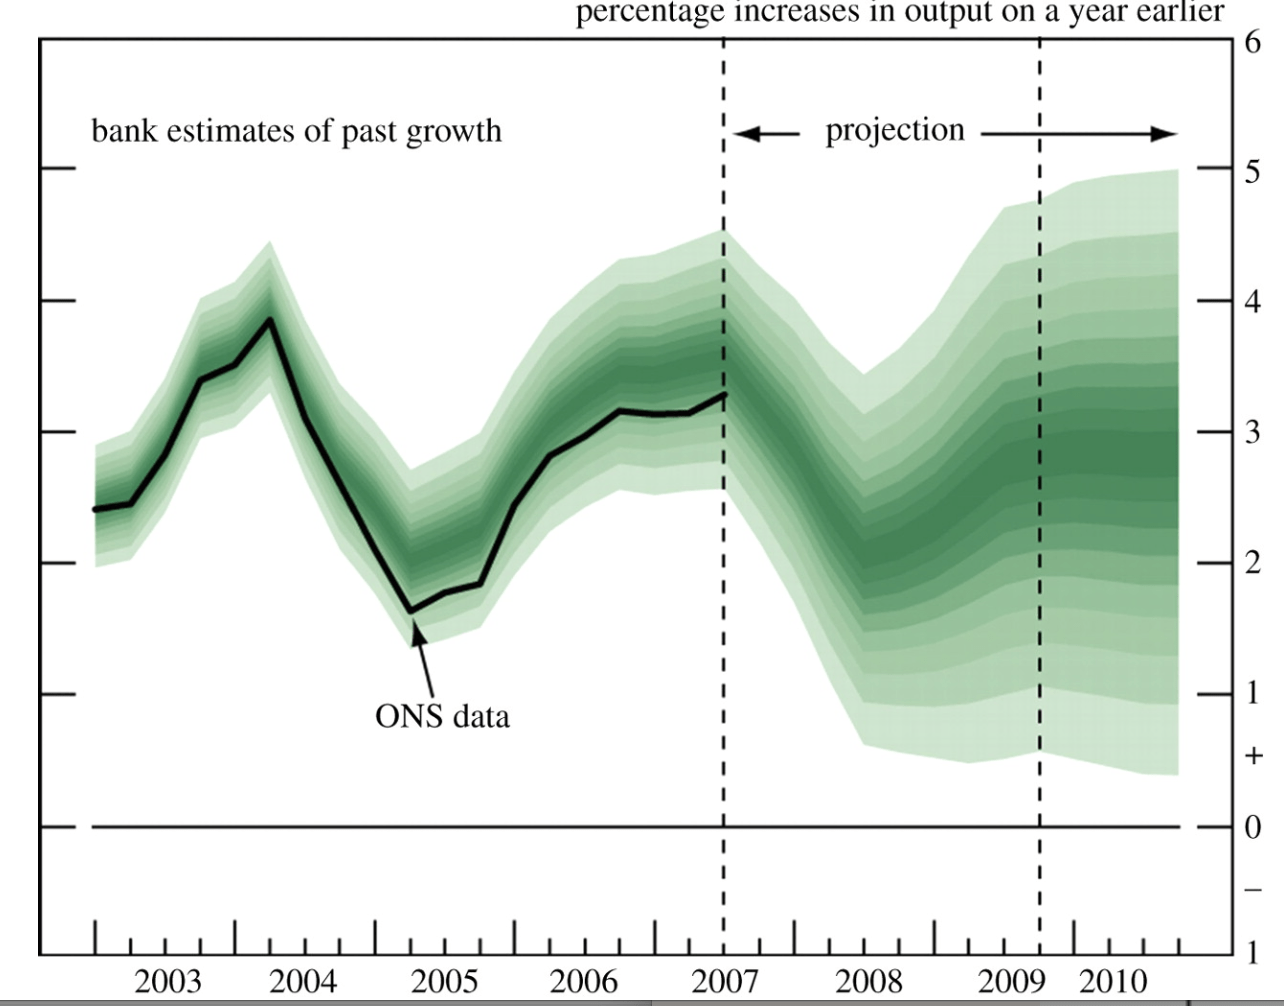
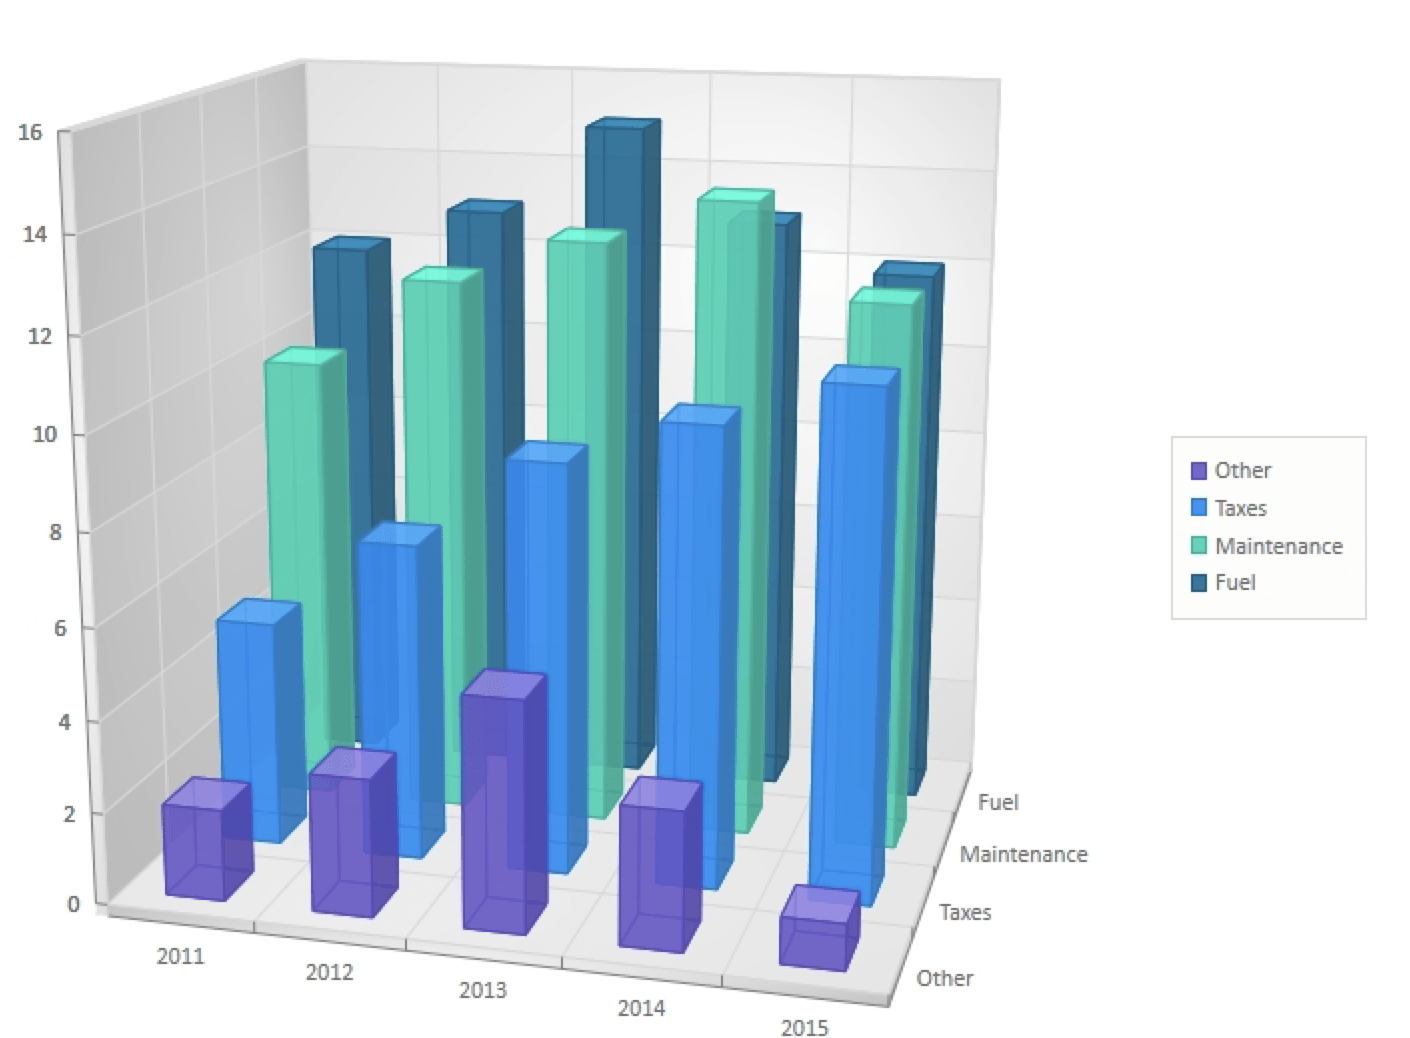
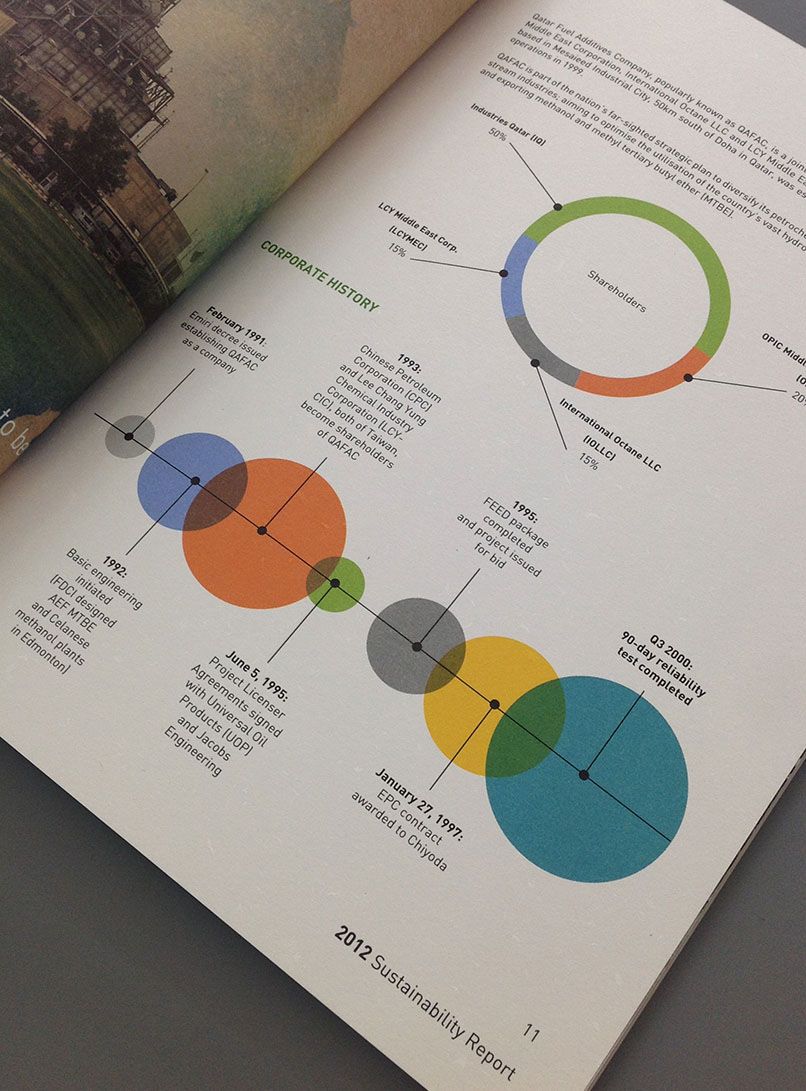
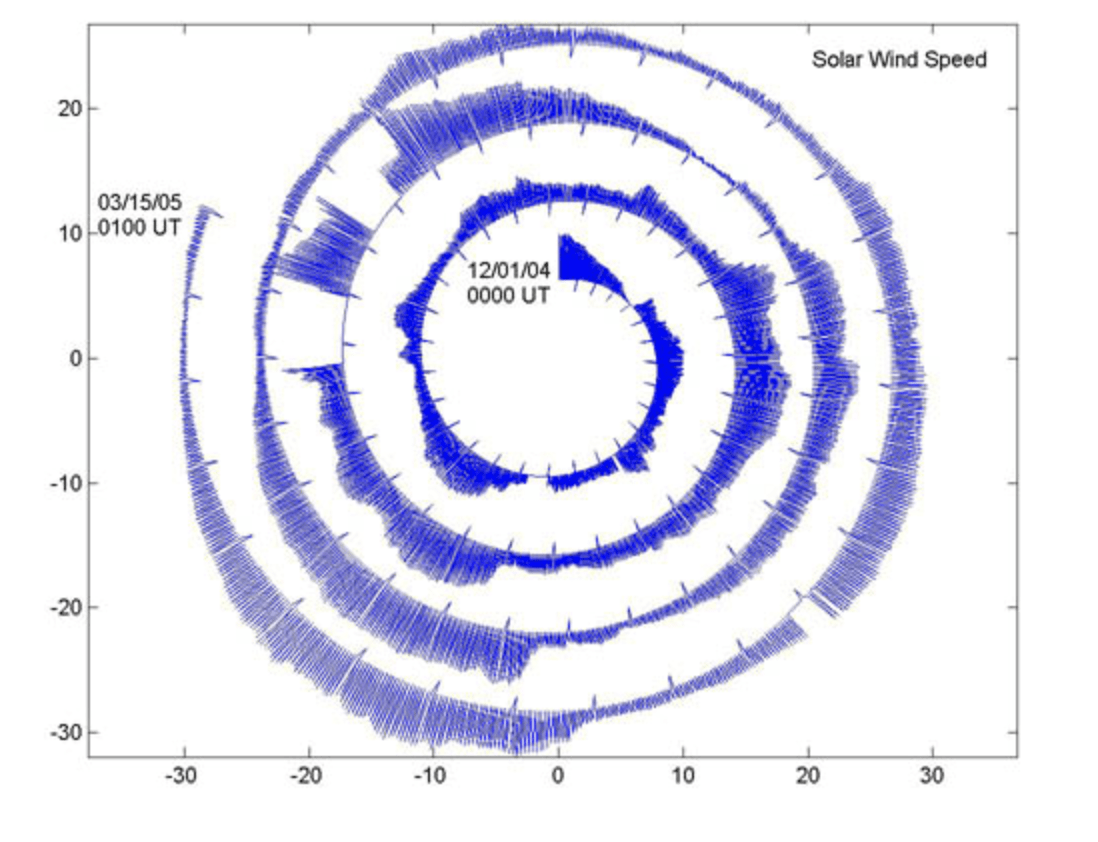
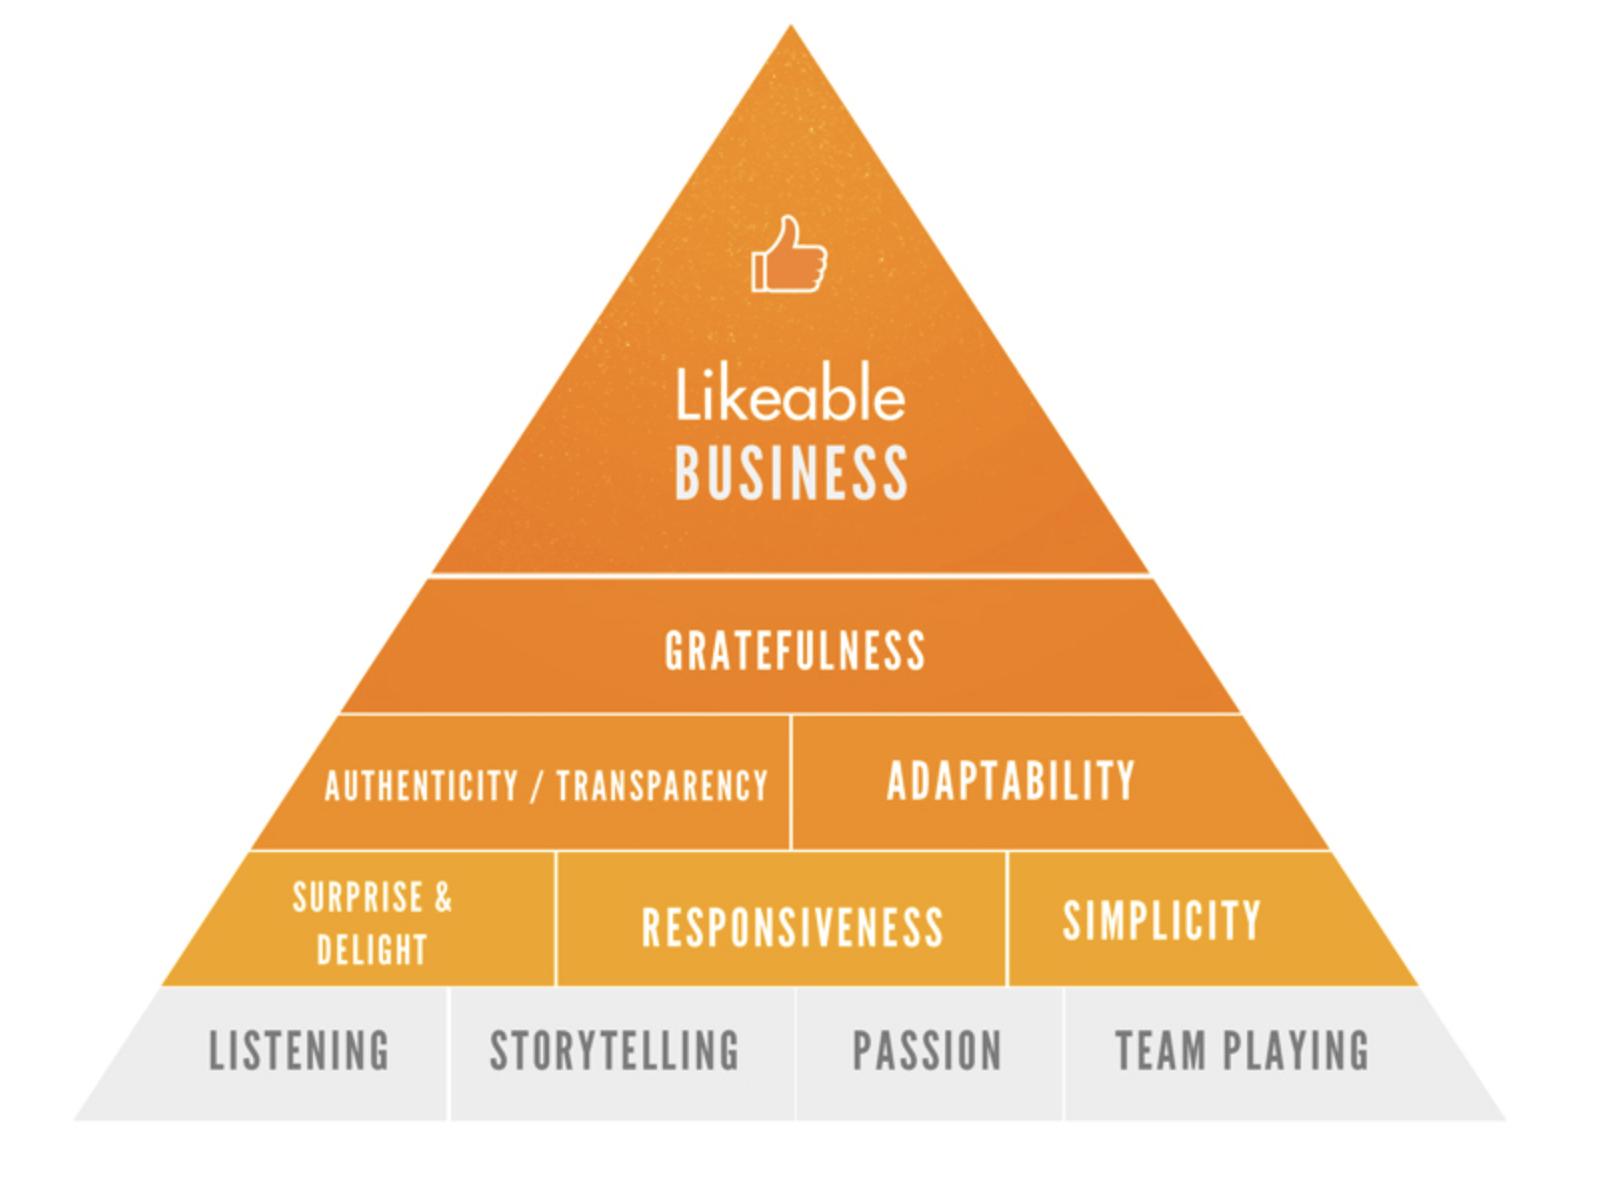
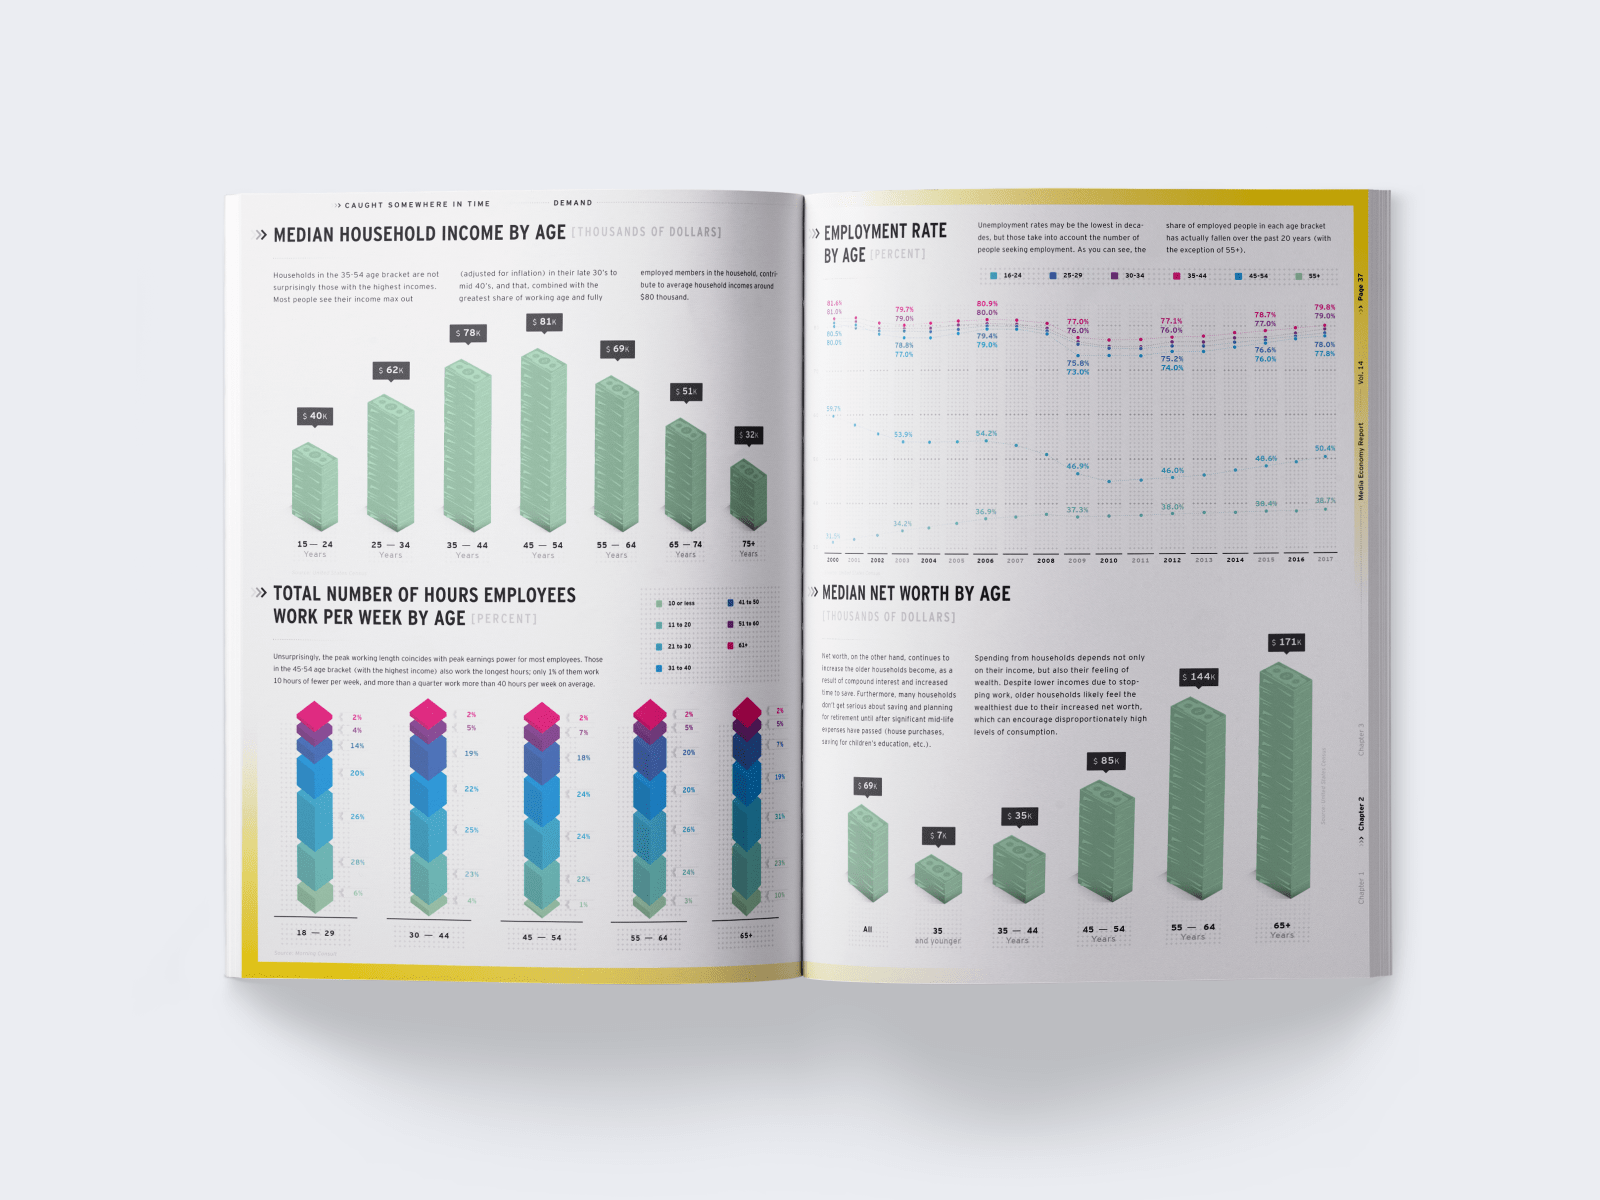
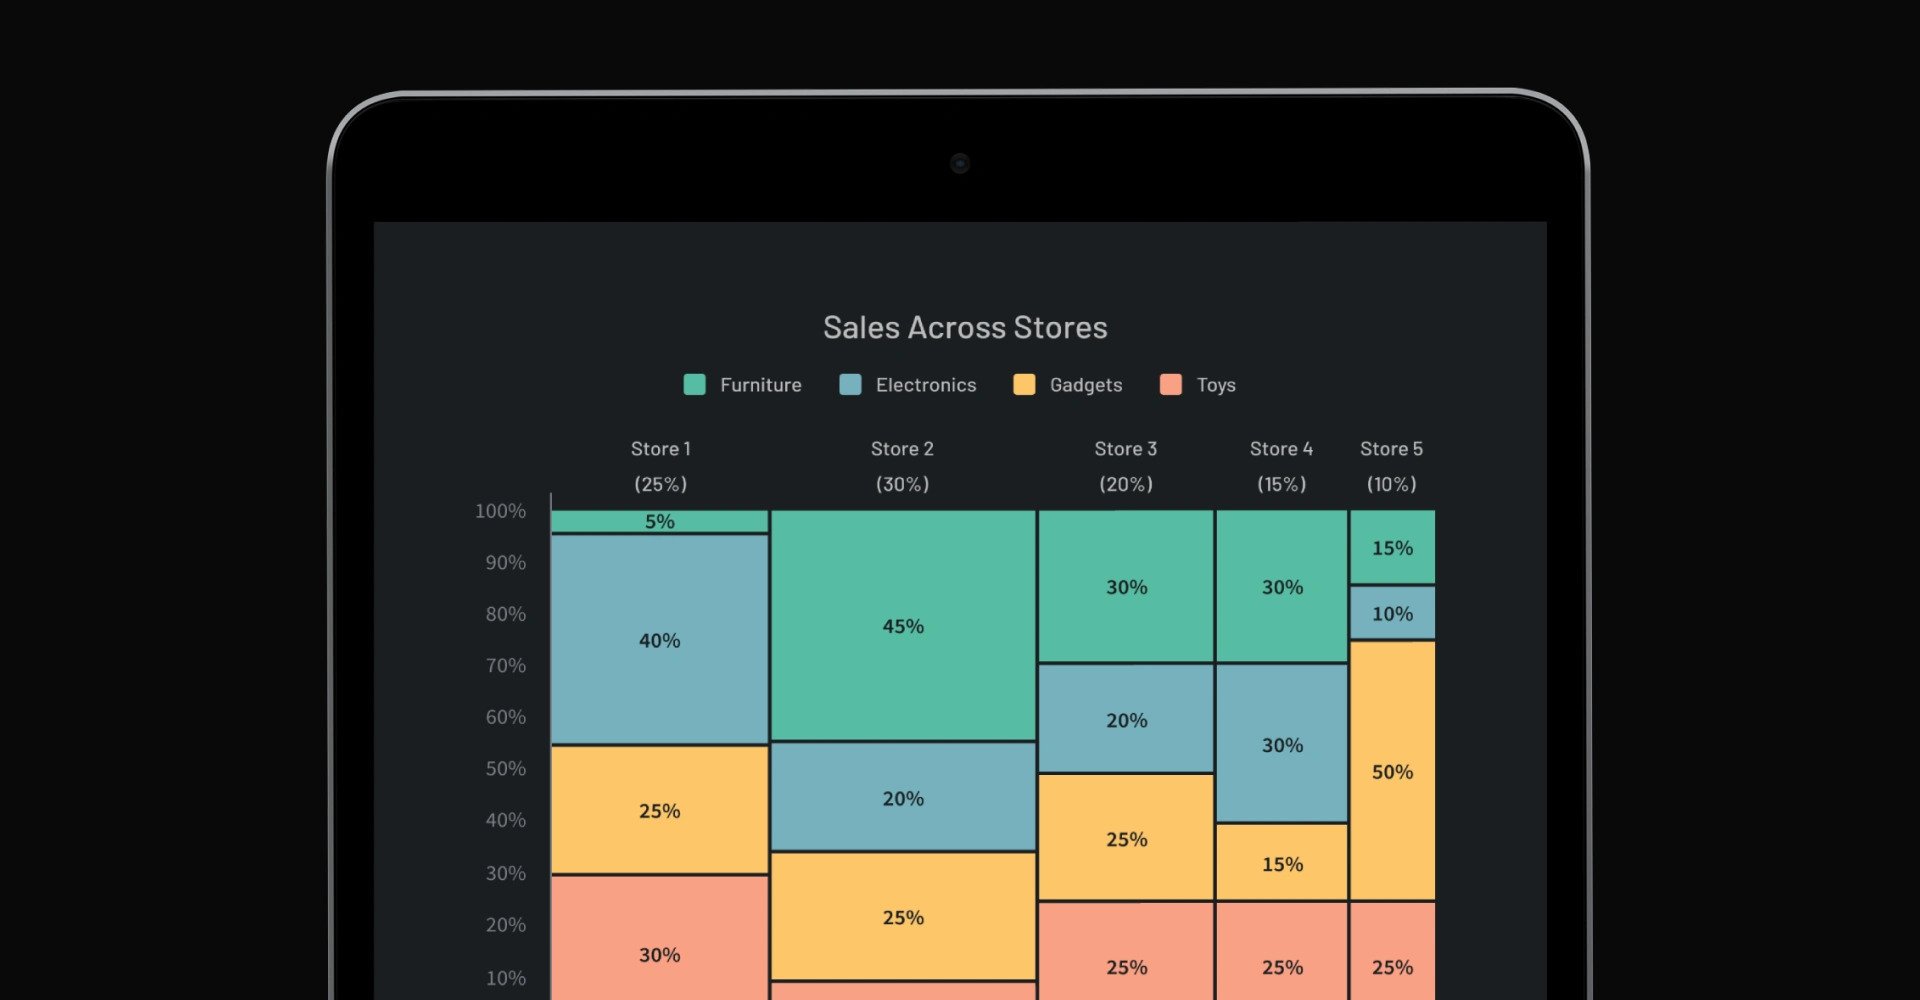
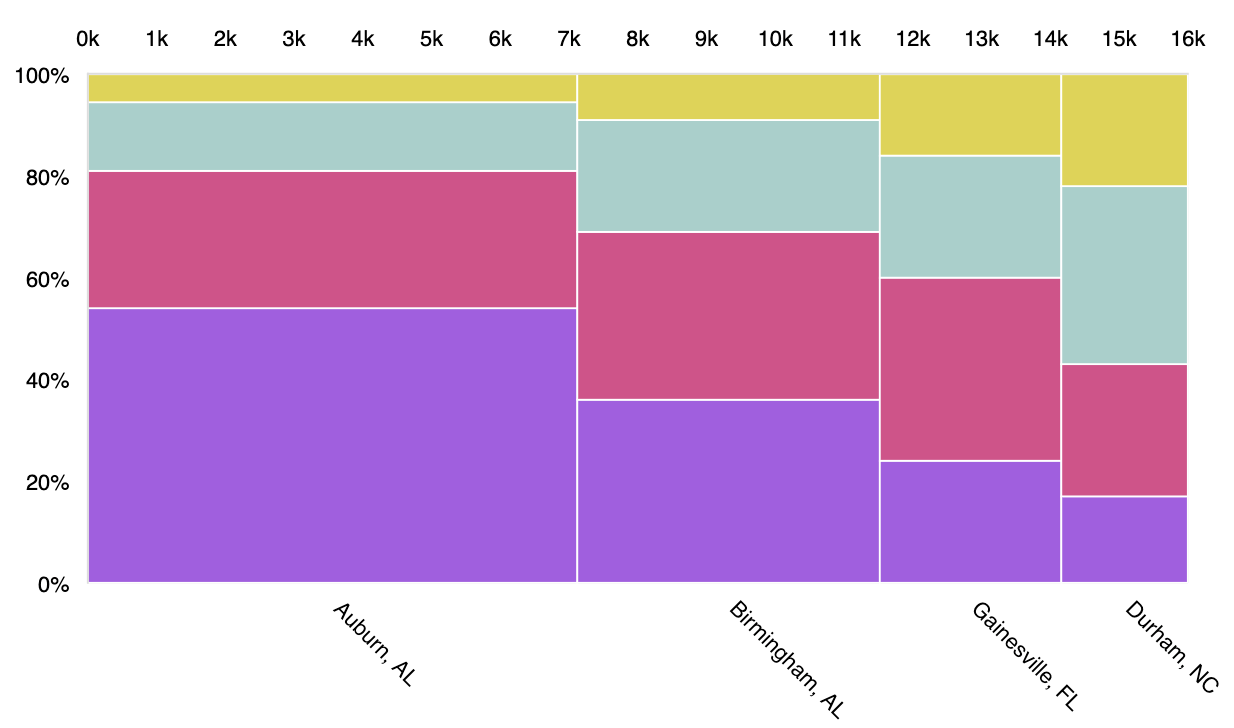
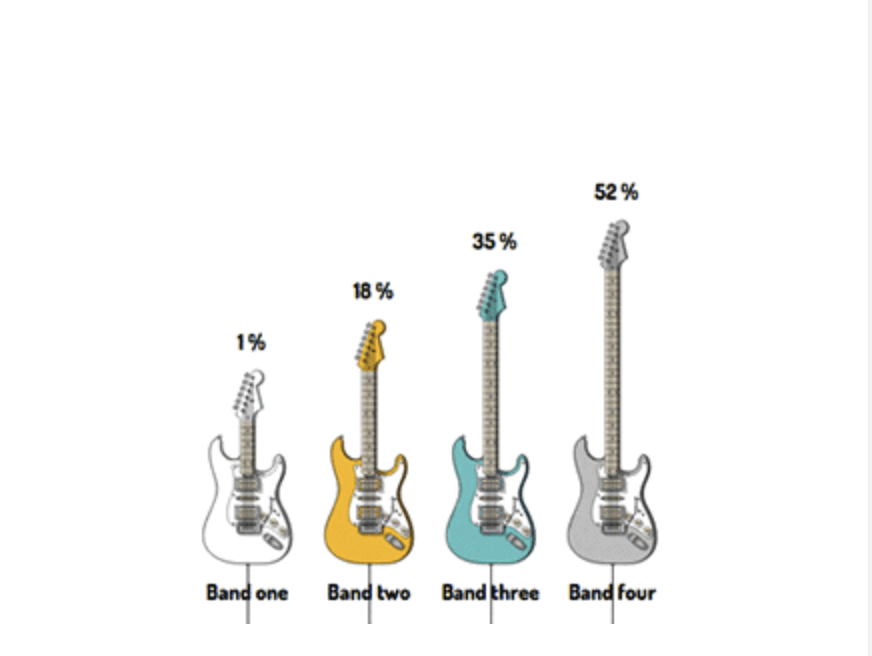
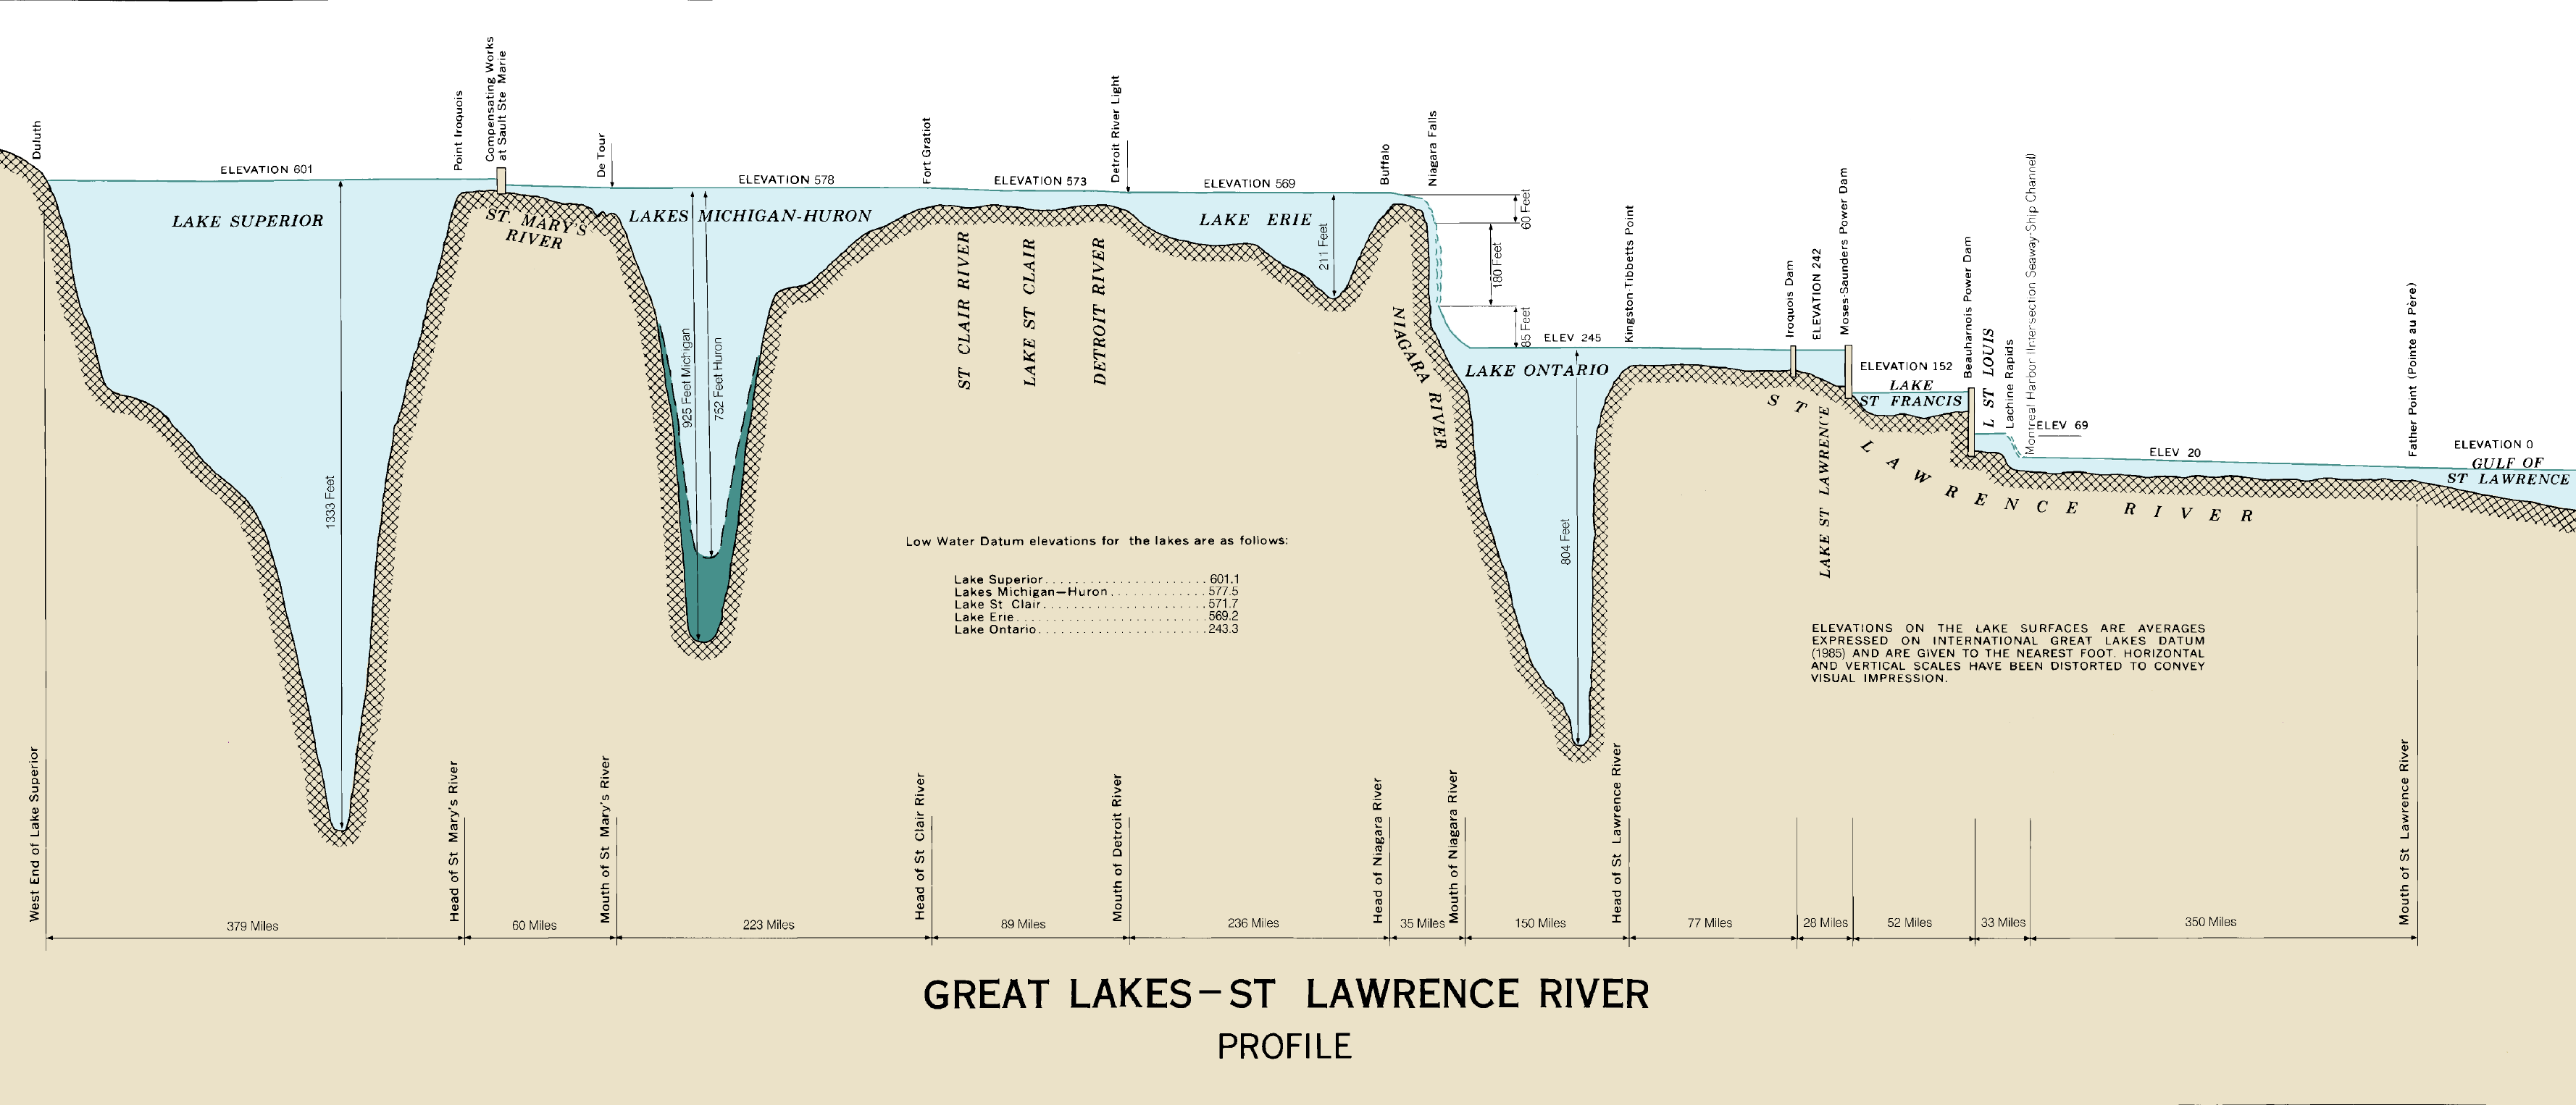
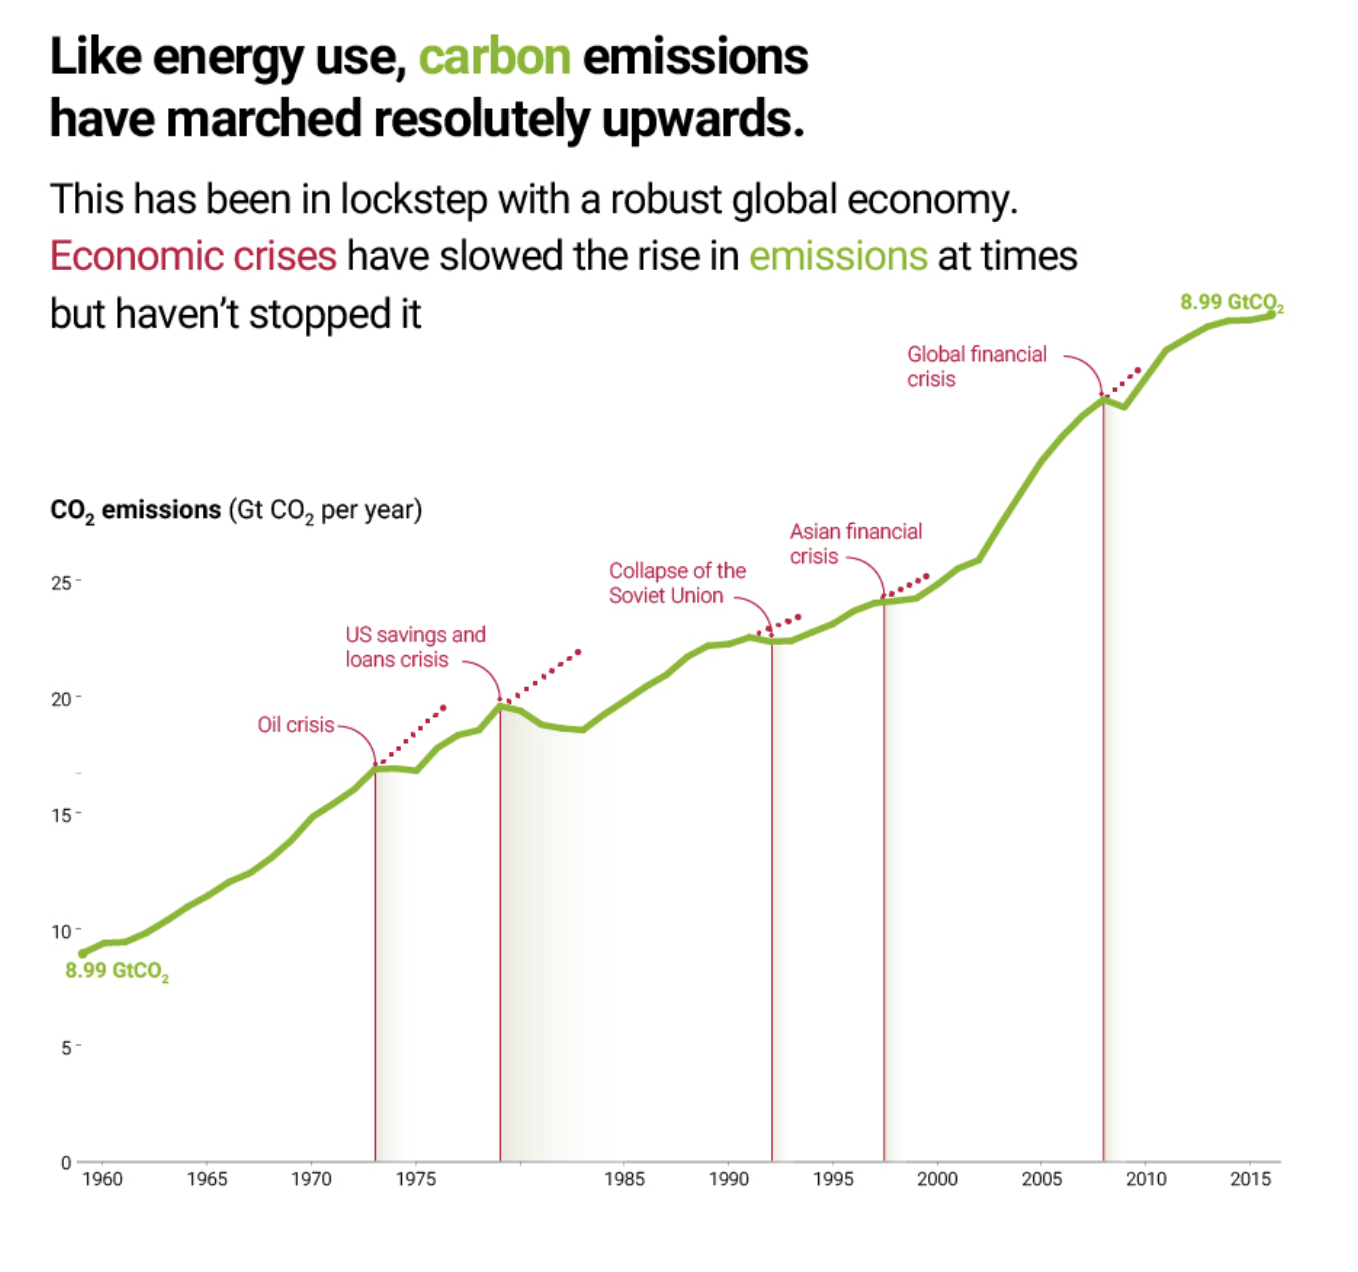
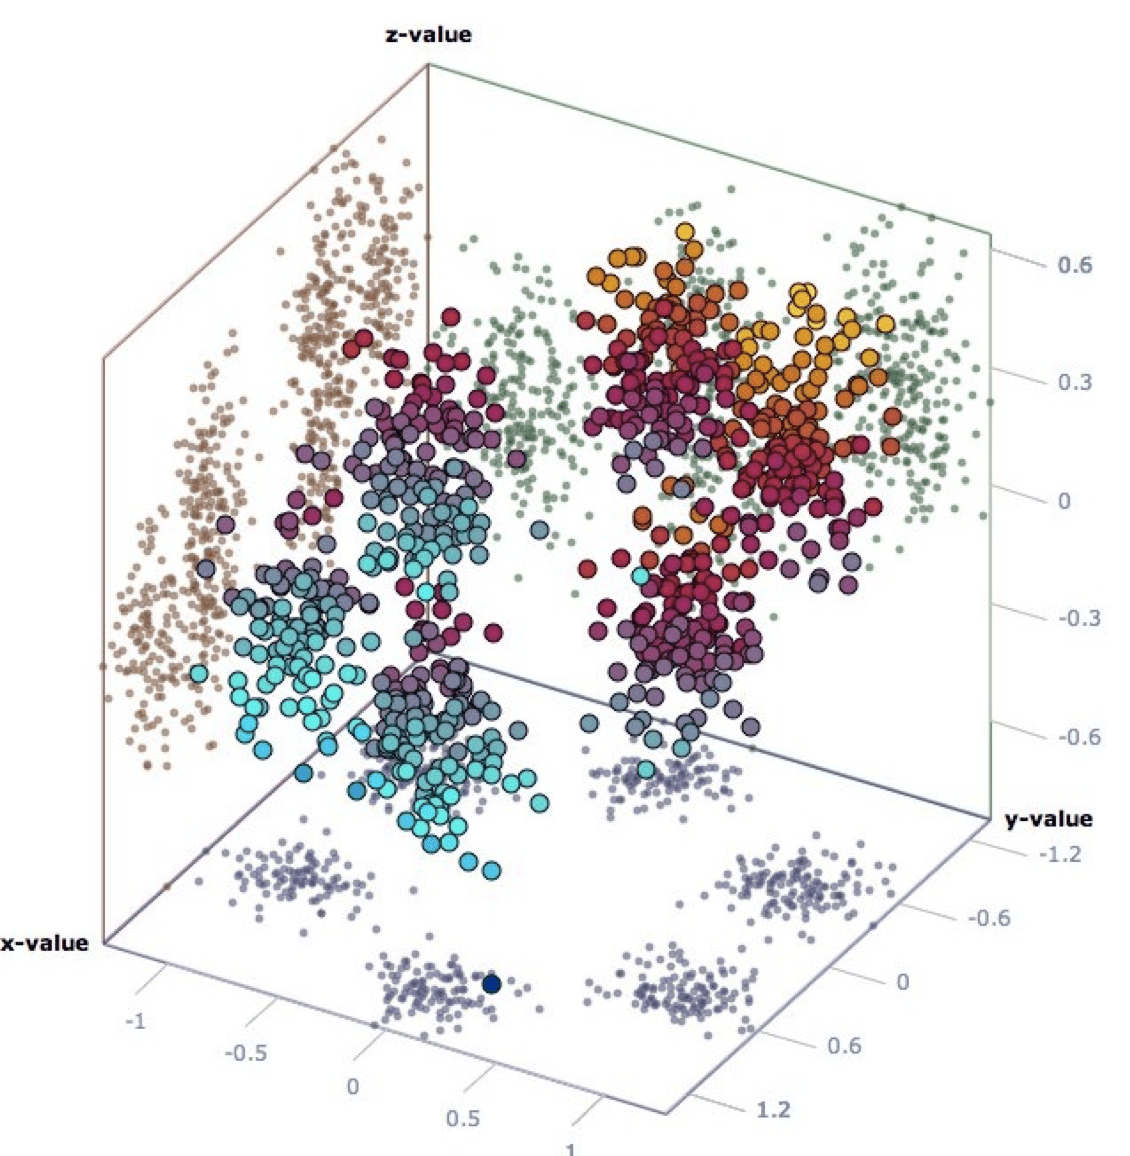
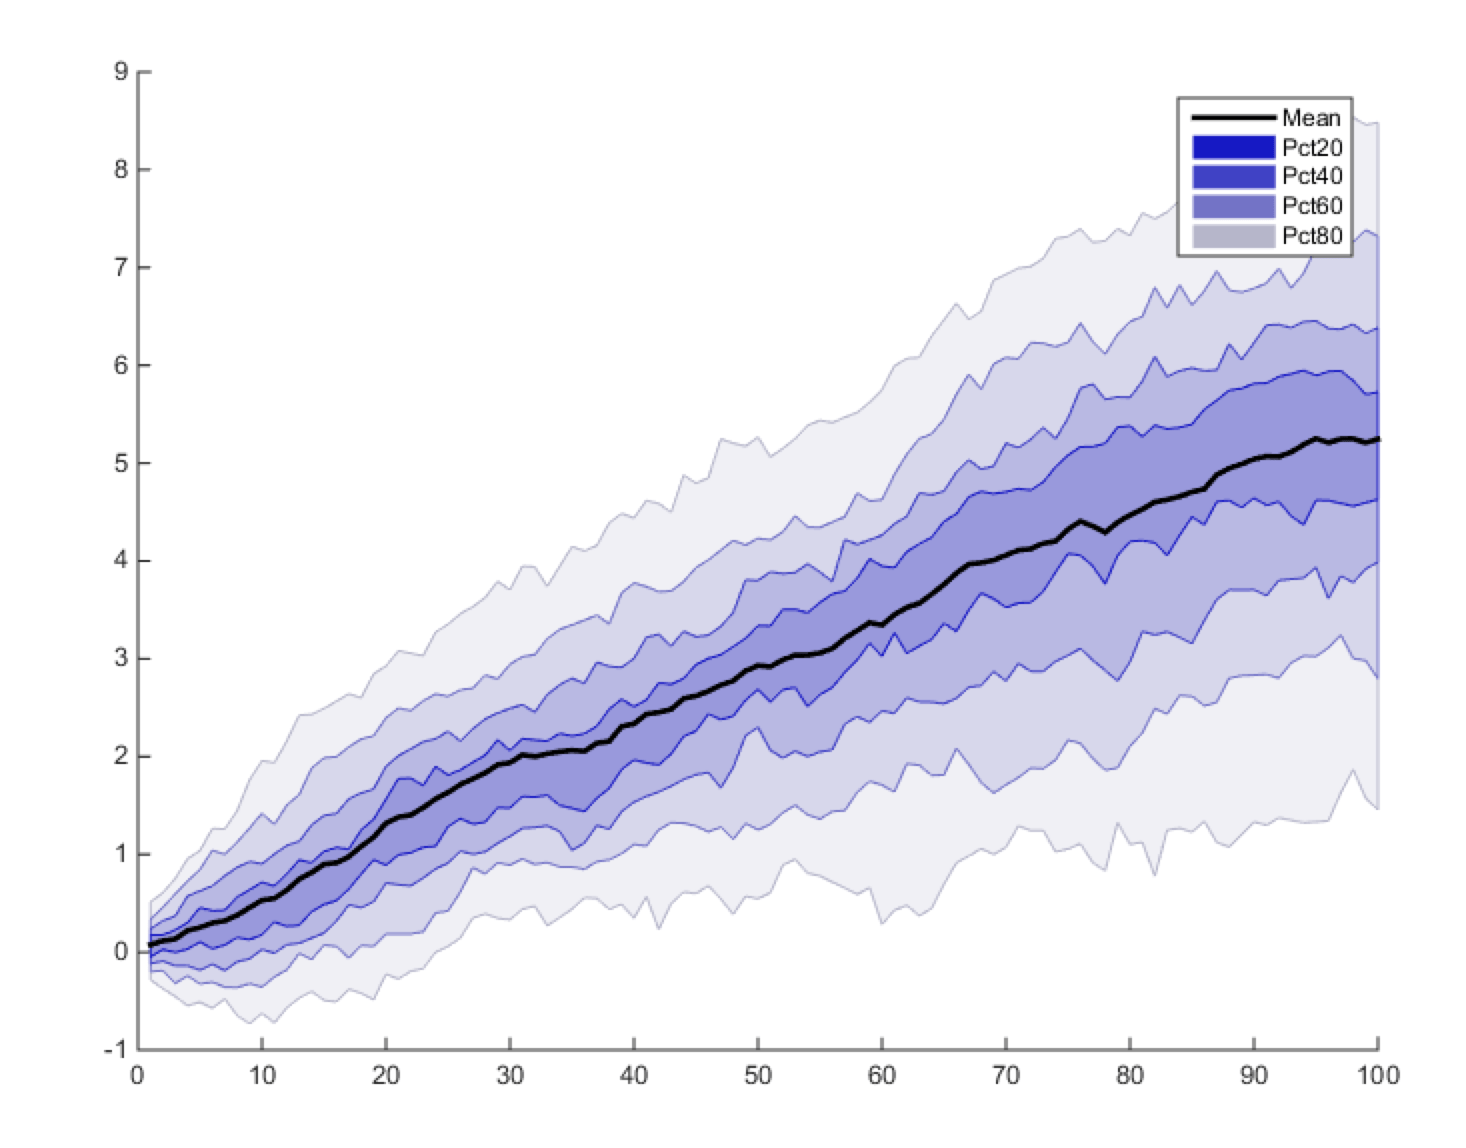
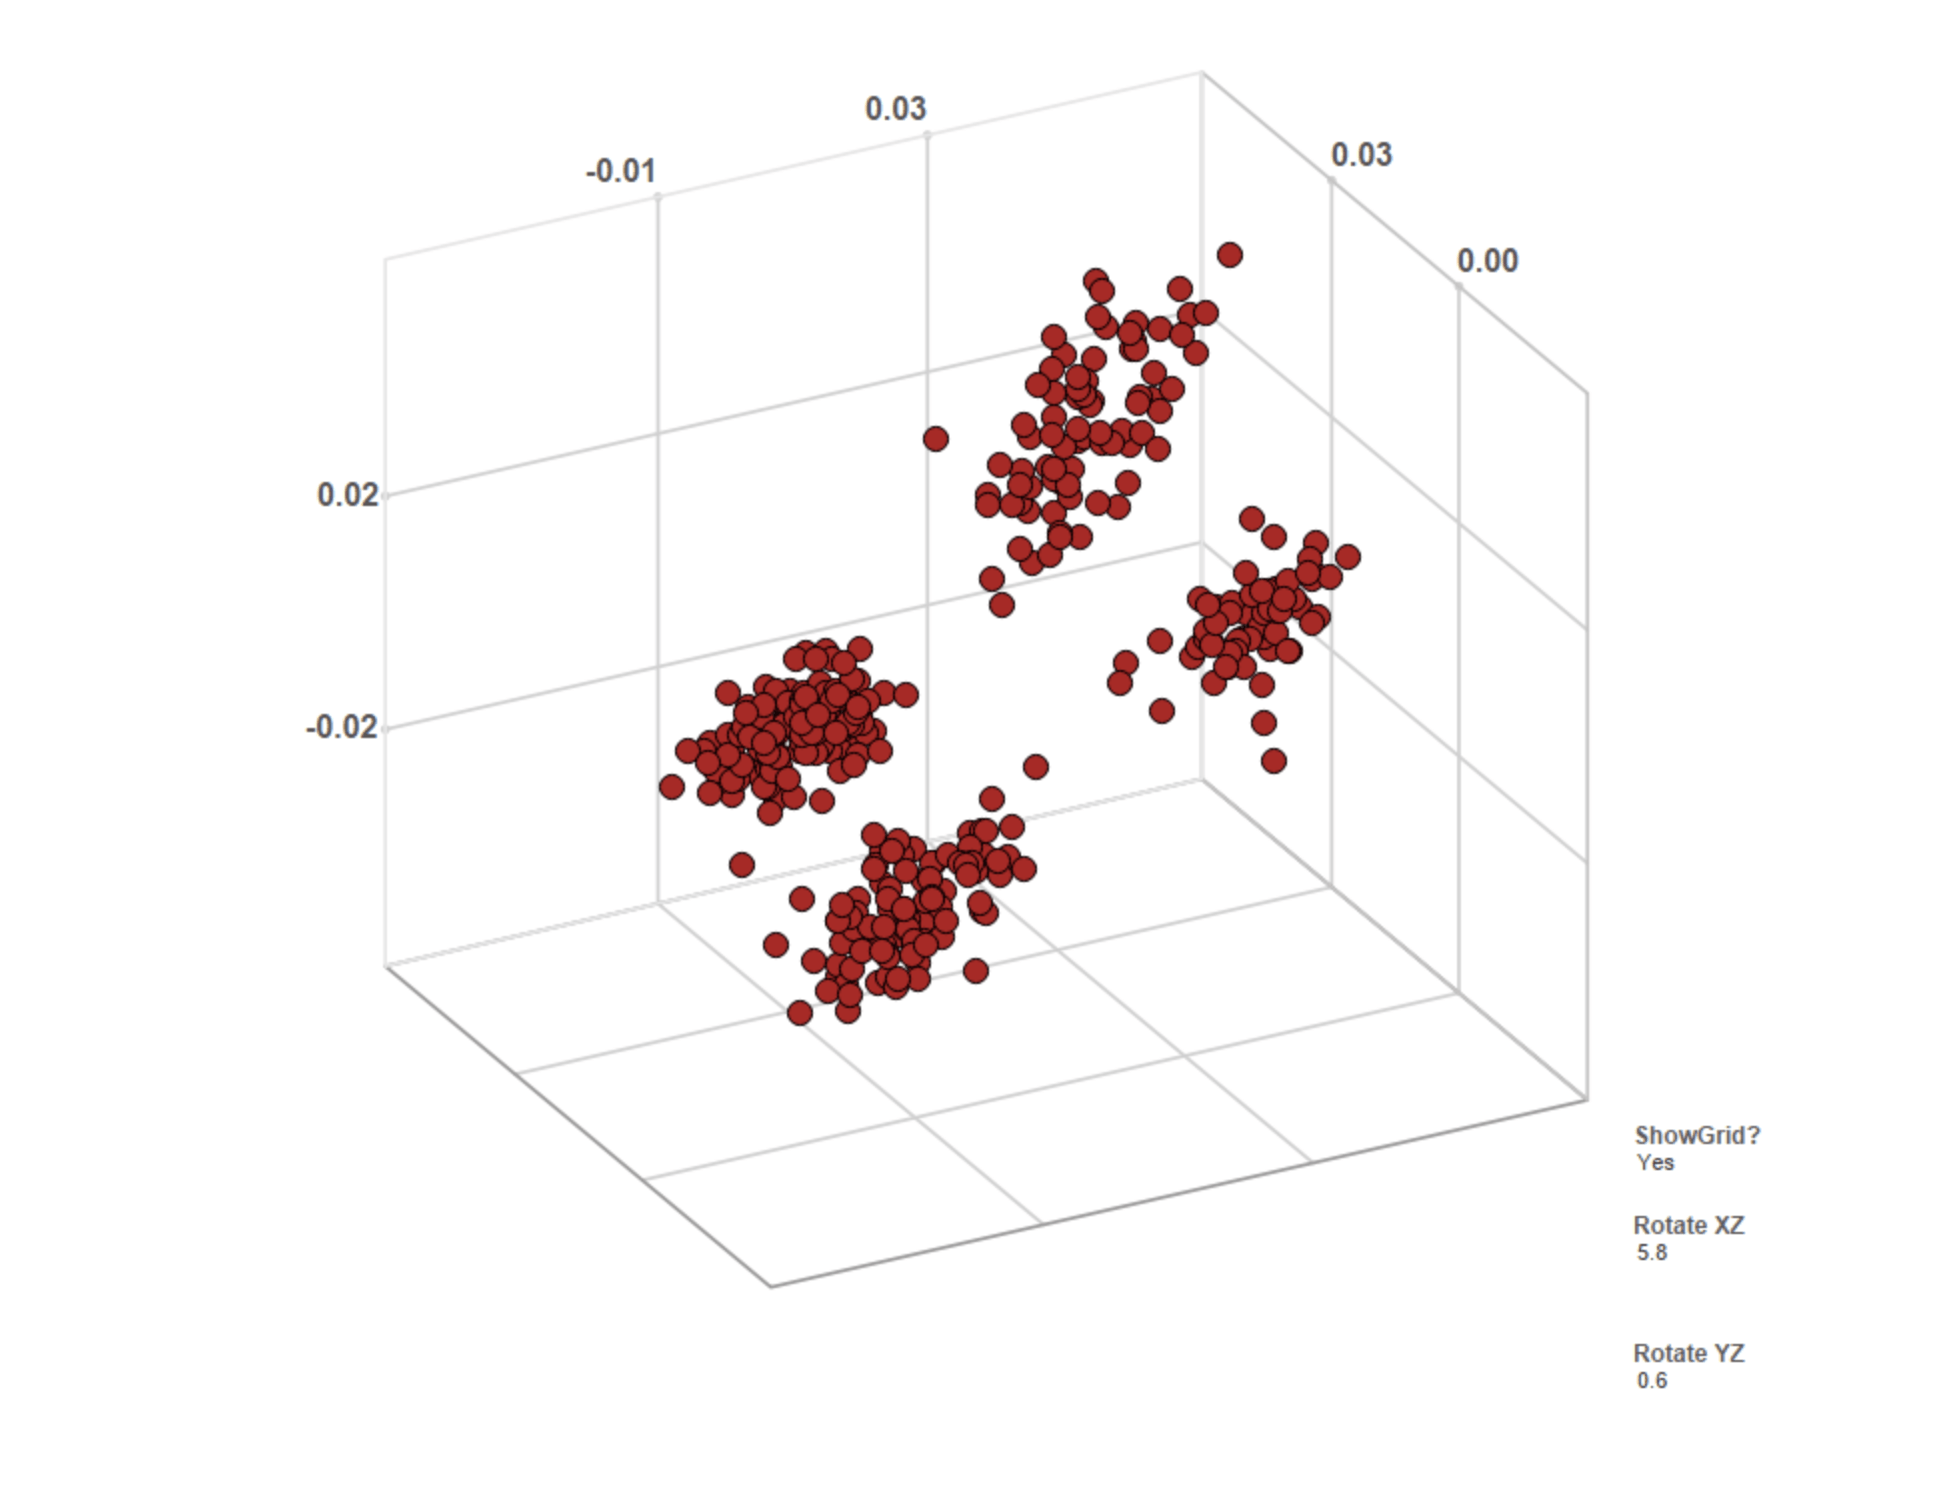
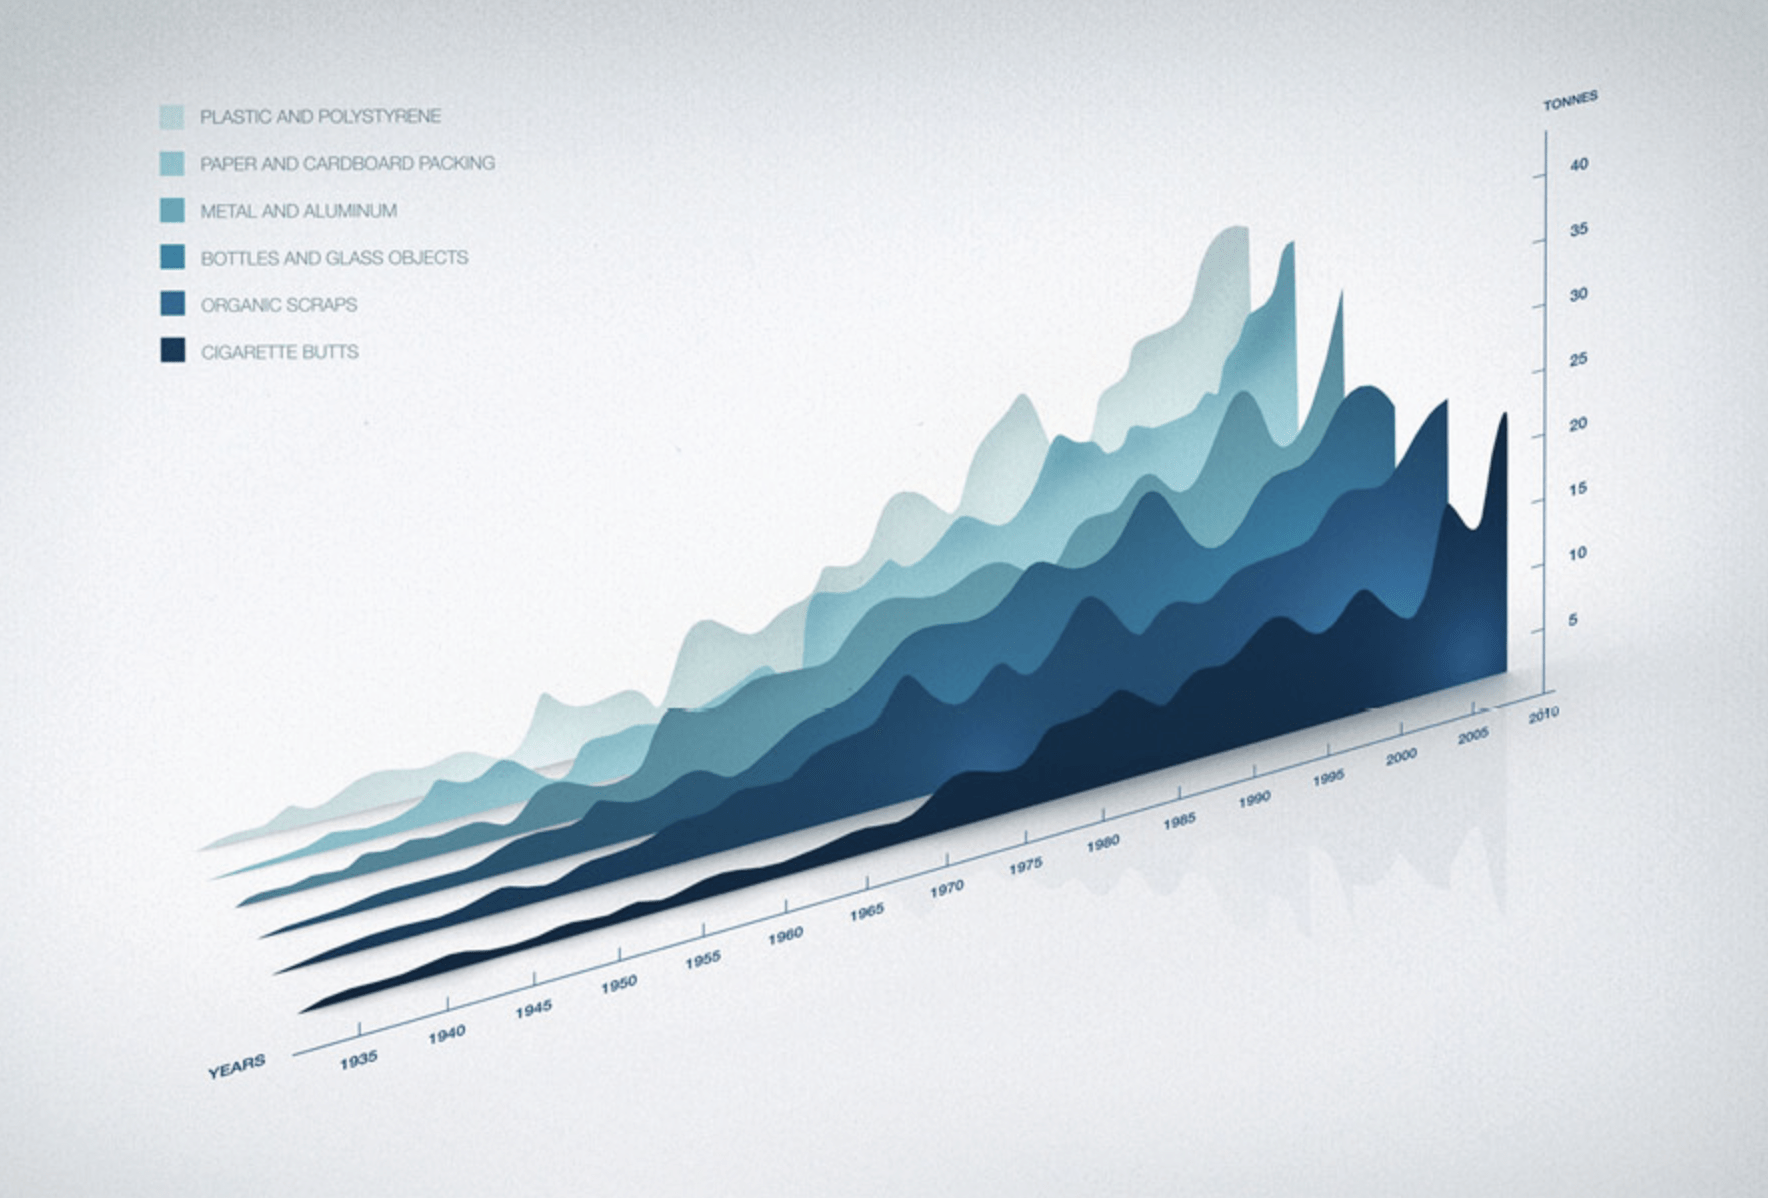
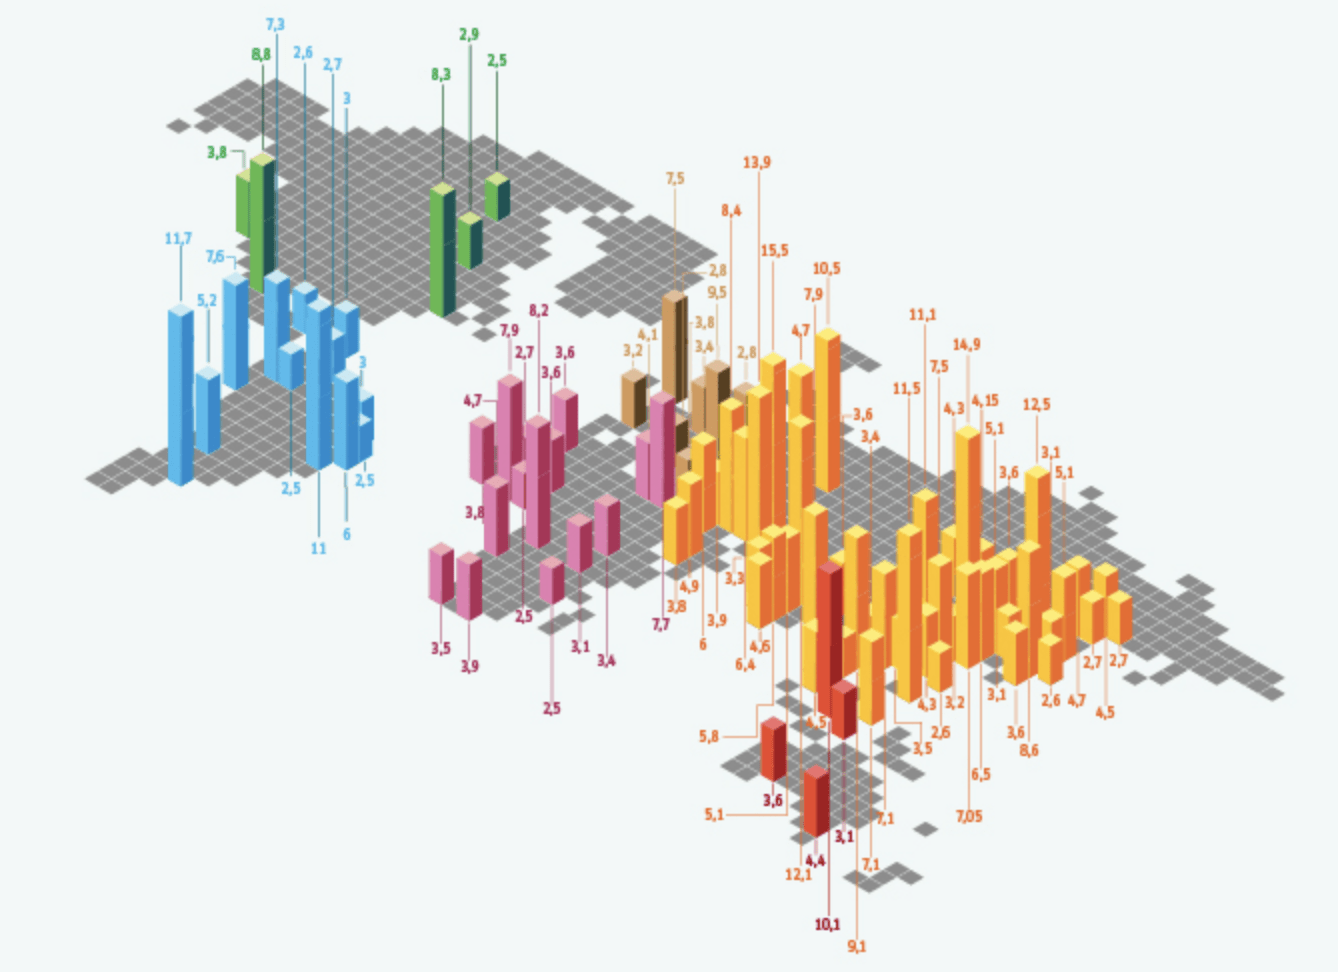
Data Viz Inspiration
Get inspired by a randomized selection from the 1500+ examples on the Data Viz Project, curated from various sources, for you to explore now.
Get inspired by a randomized selection from the 1500+ examples on the Data Viz Project, curated from various sources, for you to explore now.