by Ferdio
All
Family
Input
Function
Shape
Search
Inspiration
About
100 visualizations
Instagram
X
Chart
Diagram
Geospatial
Plot
Table
X
X
Comparison
Concept visualization
Correlation
Distribution
Geolocation
Part to whole
Trend over time
X
X
Search for:
Shape:
Dot
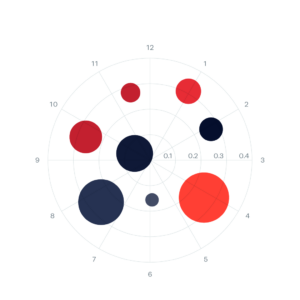
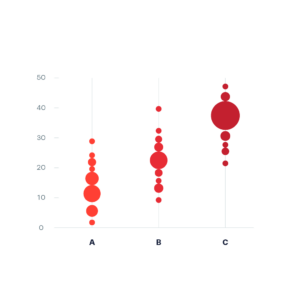
Circular Bubble Chart
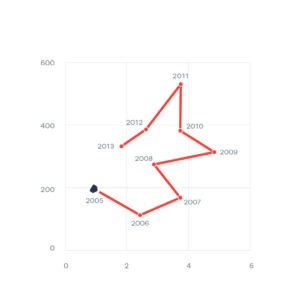
Connected Scatter Plot
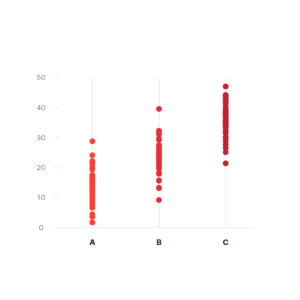
Strip Plot
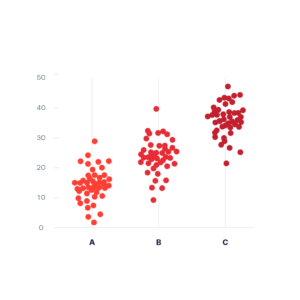
Jitter Plot
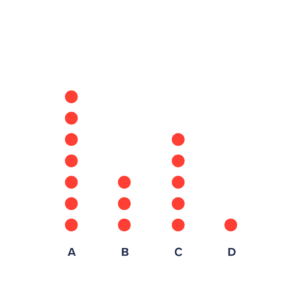
Counts Plot
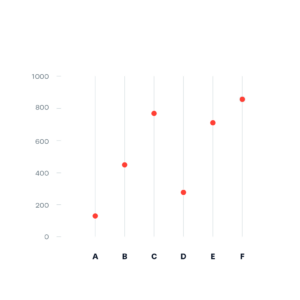
Dot Chart
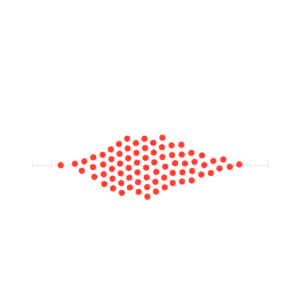
Beeswarm Plot
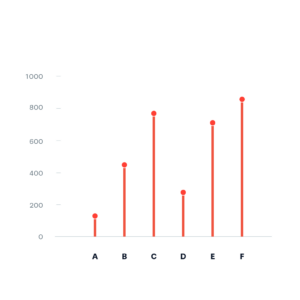
Lollipop Chart
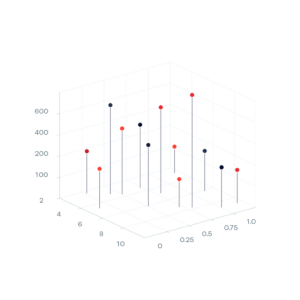
3D Scatter Plot
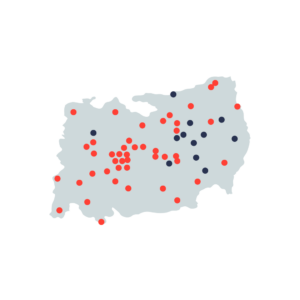
Dot Density Map
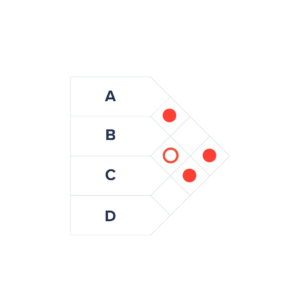
Matrix Diagram (Y-Shaped)
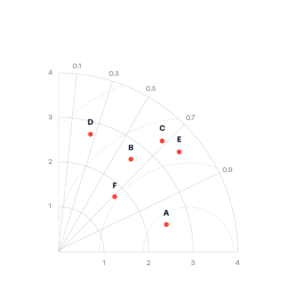
Taylor Diagram
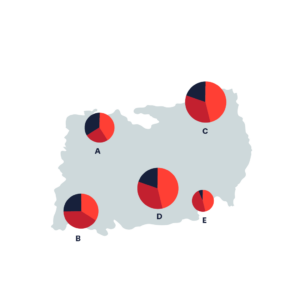
Pie Chart on a Map
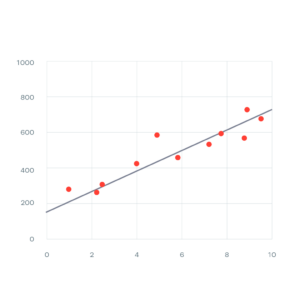
Trendline
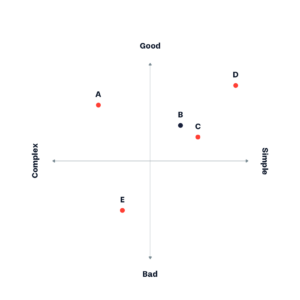
Opposite Diagram
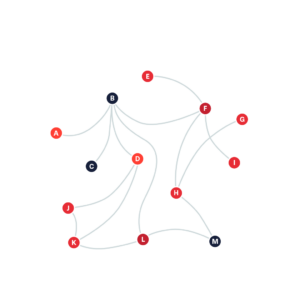
Network Visualisation
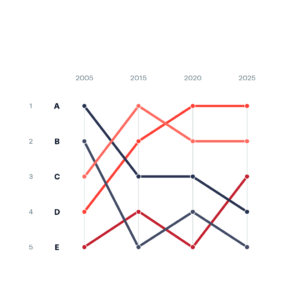
Bump Chart
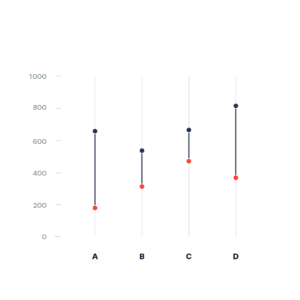
Dumbbell Plot
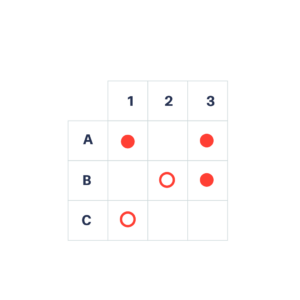
Matrix Diagram
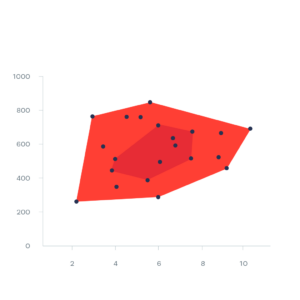
Bagplot
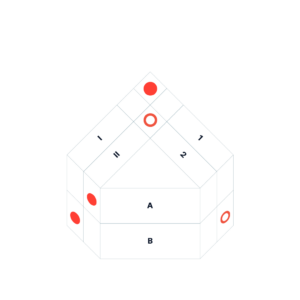
Matrix Diagram (Roof Shaped)
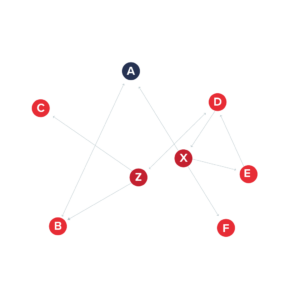
Sociogram
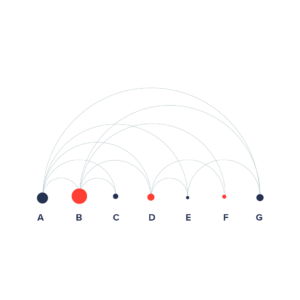
Arc Diagram
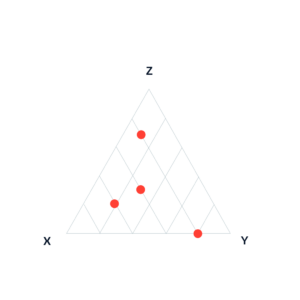
Ternary Plot
Dot Plot
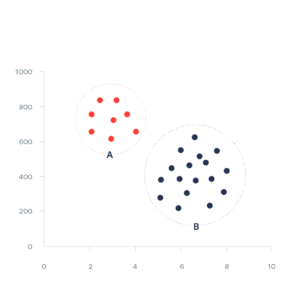
Cluster Analysis
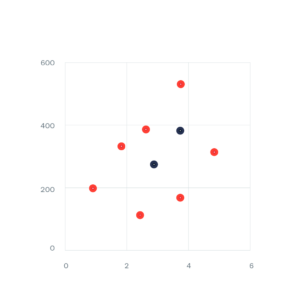
Scatter Plot