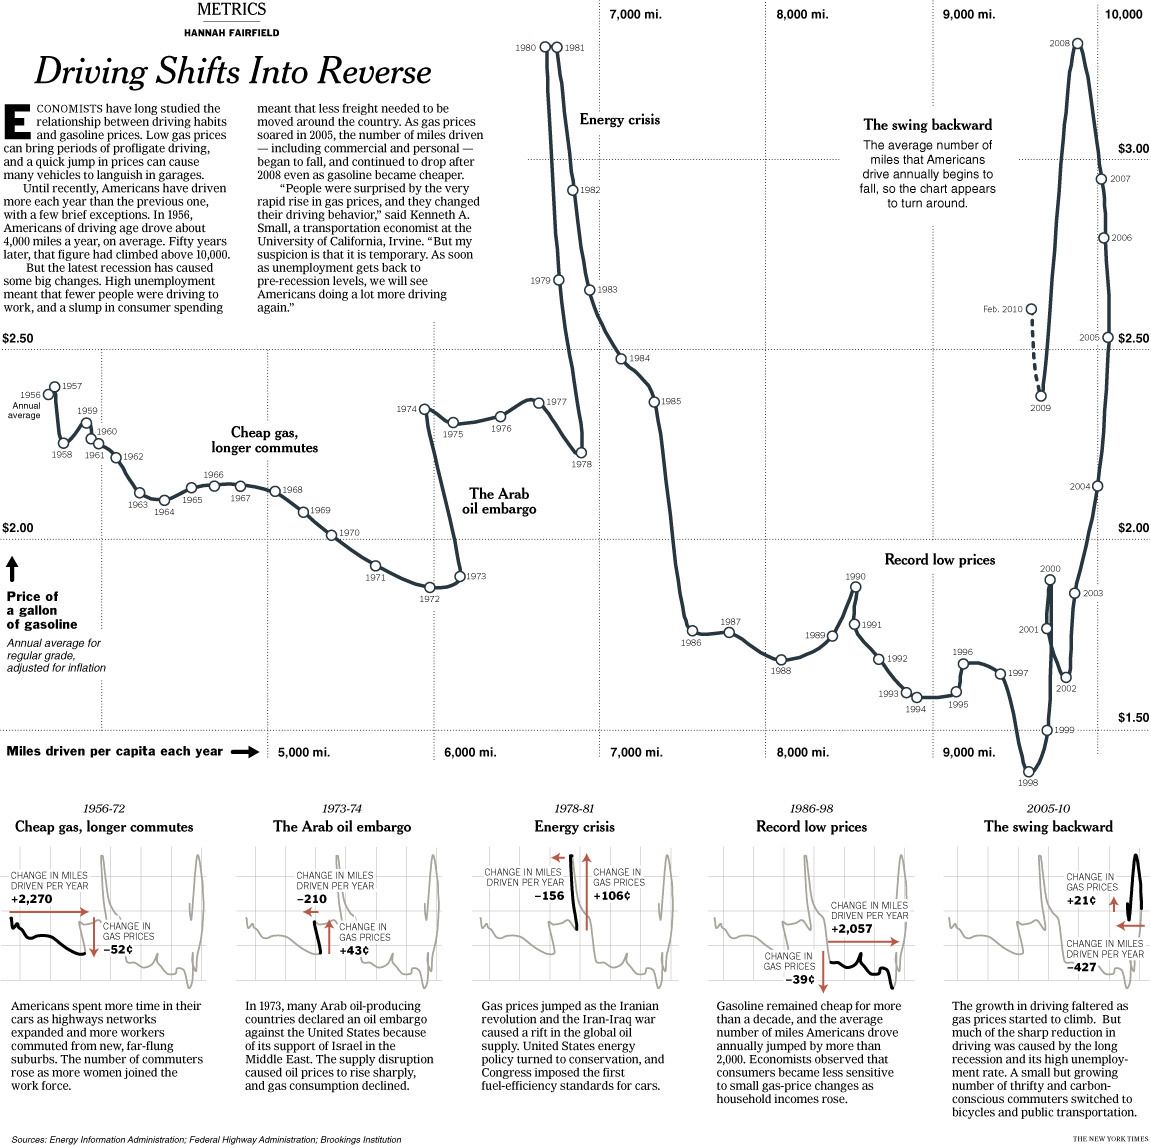
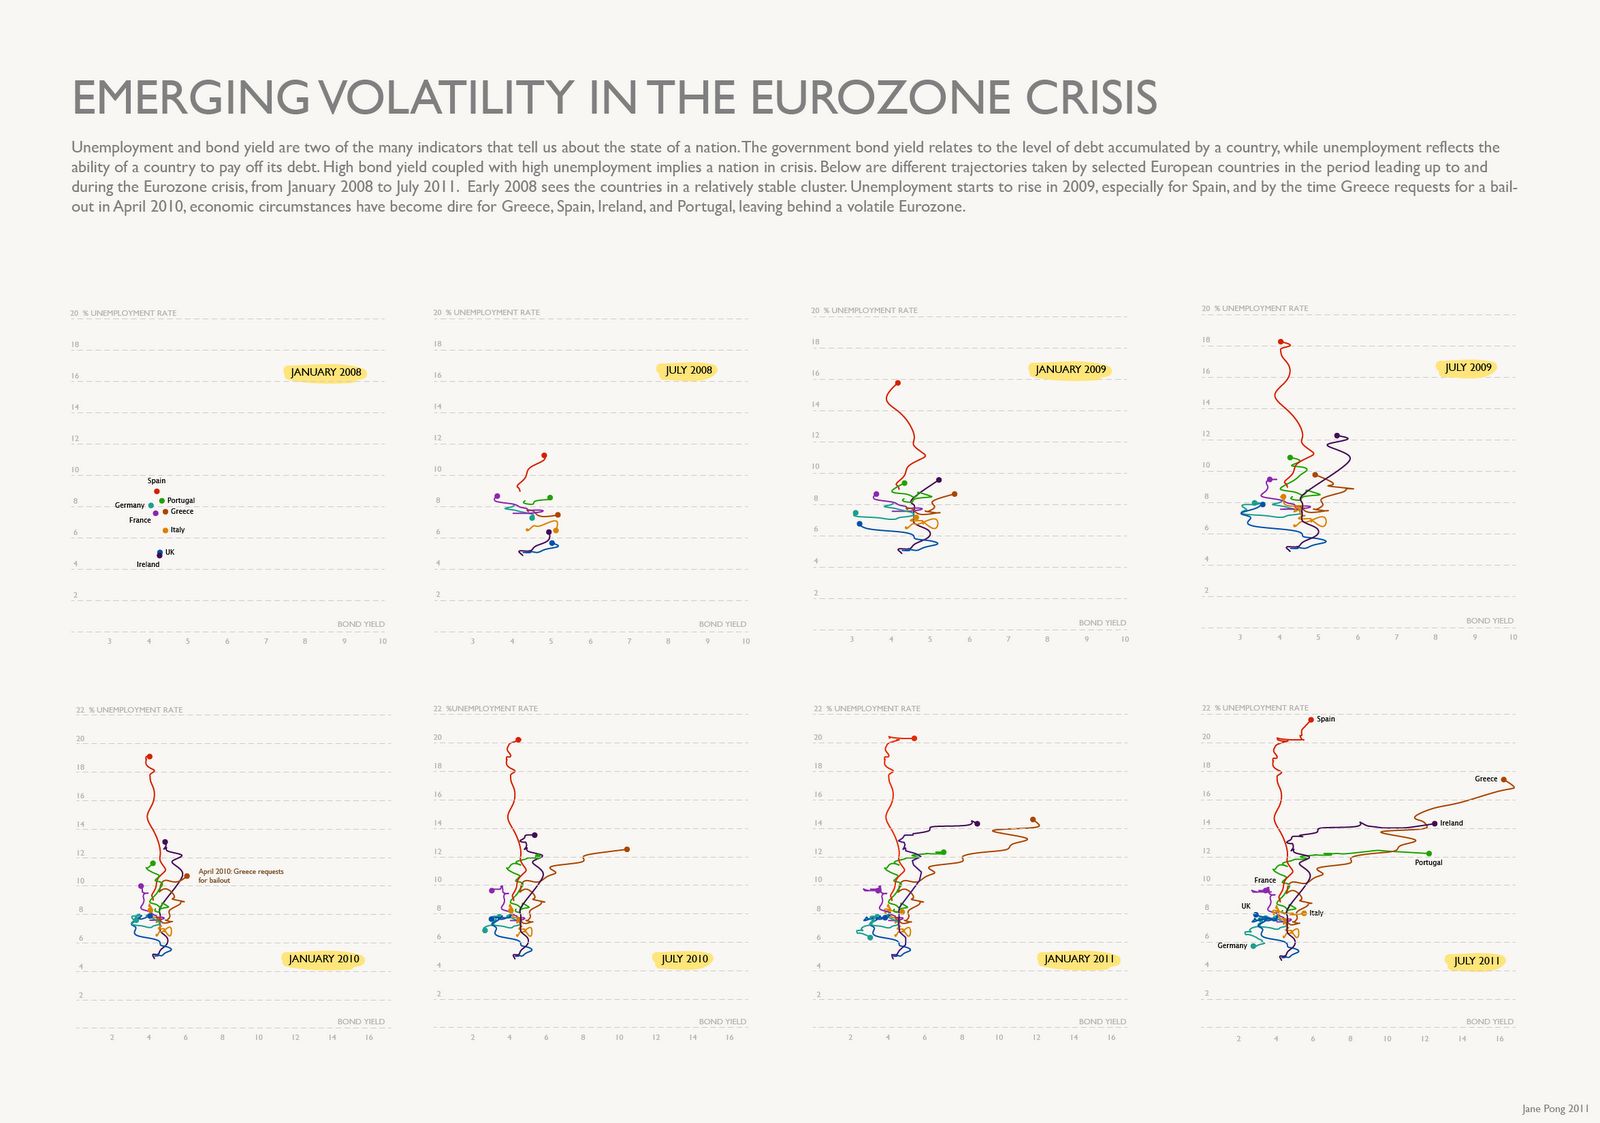
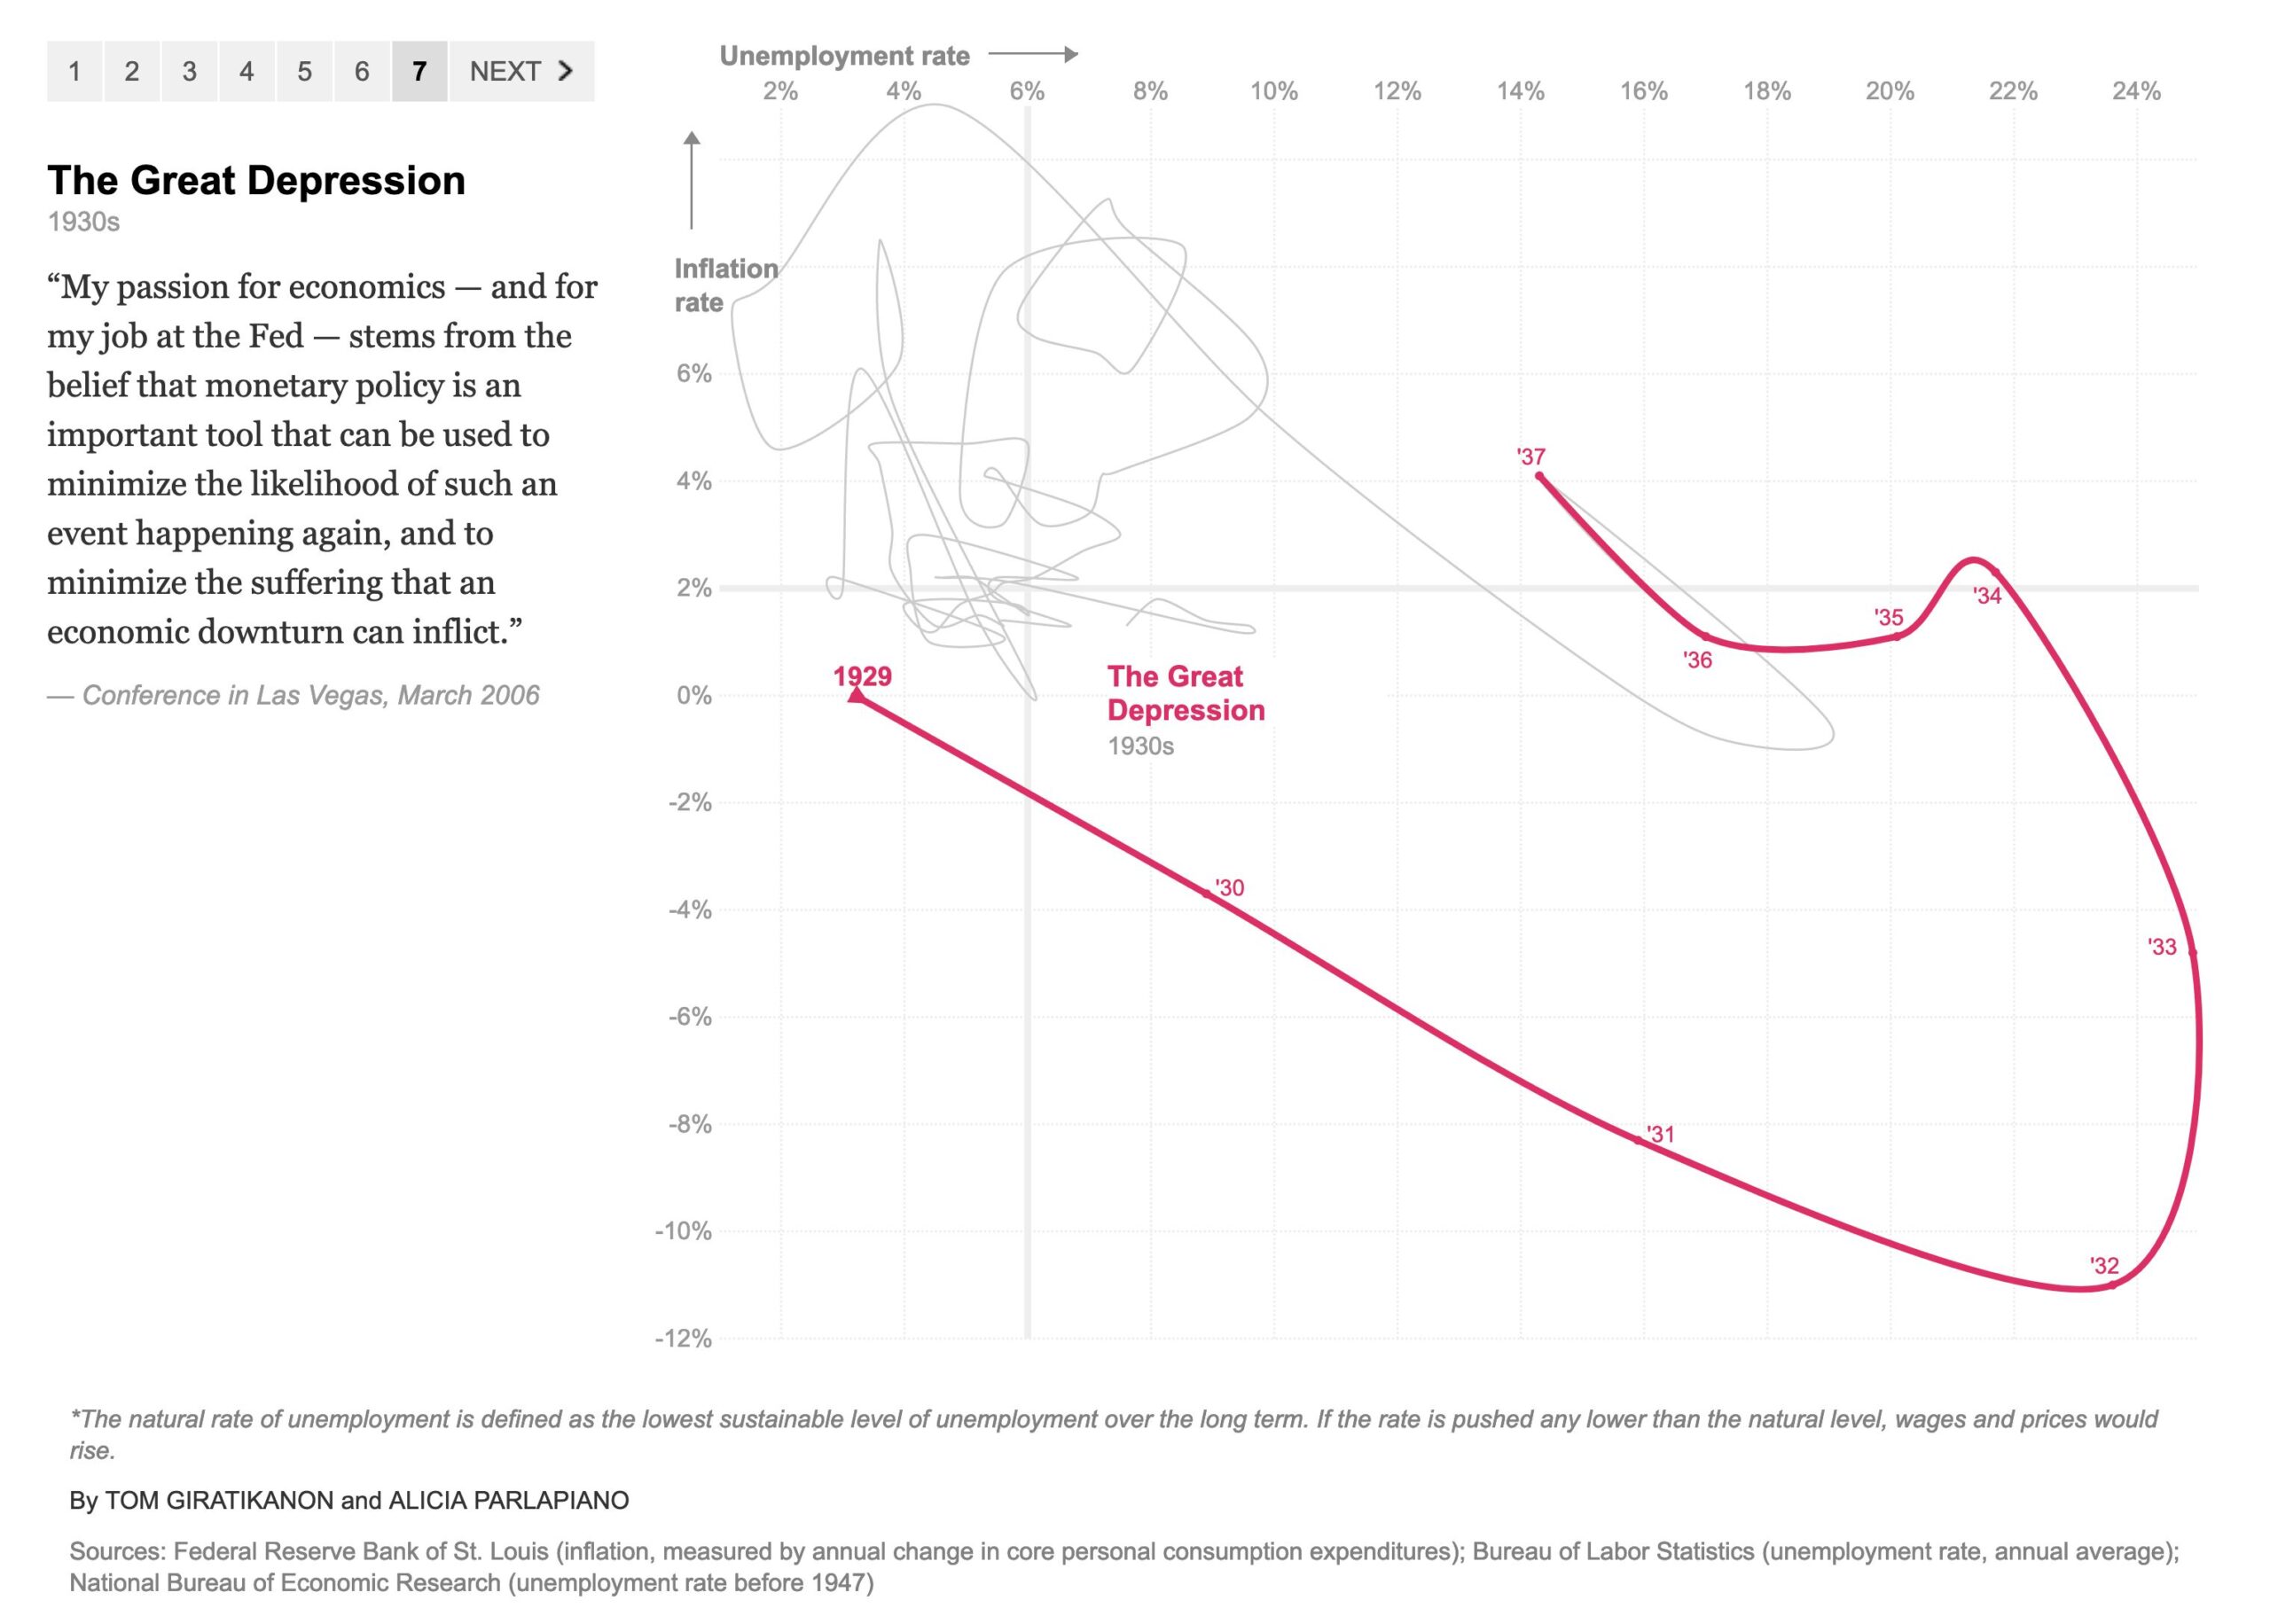
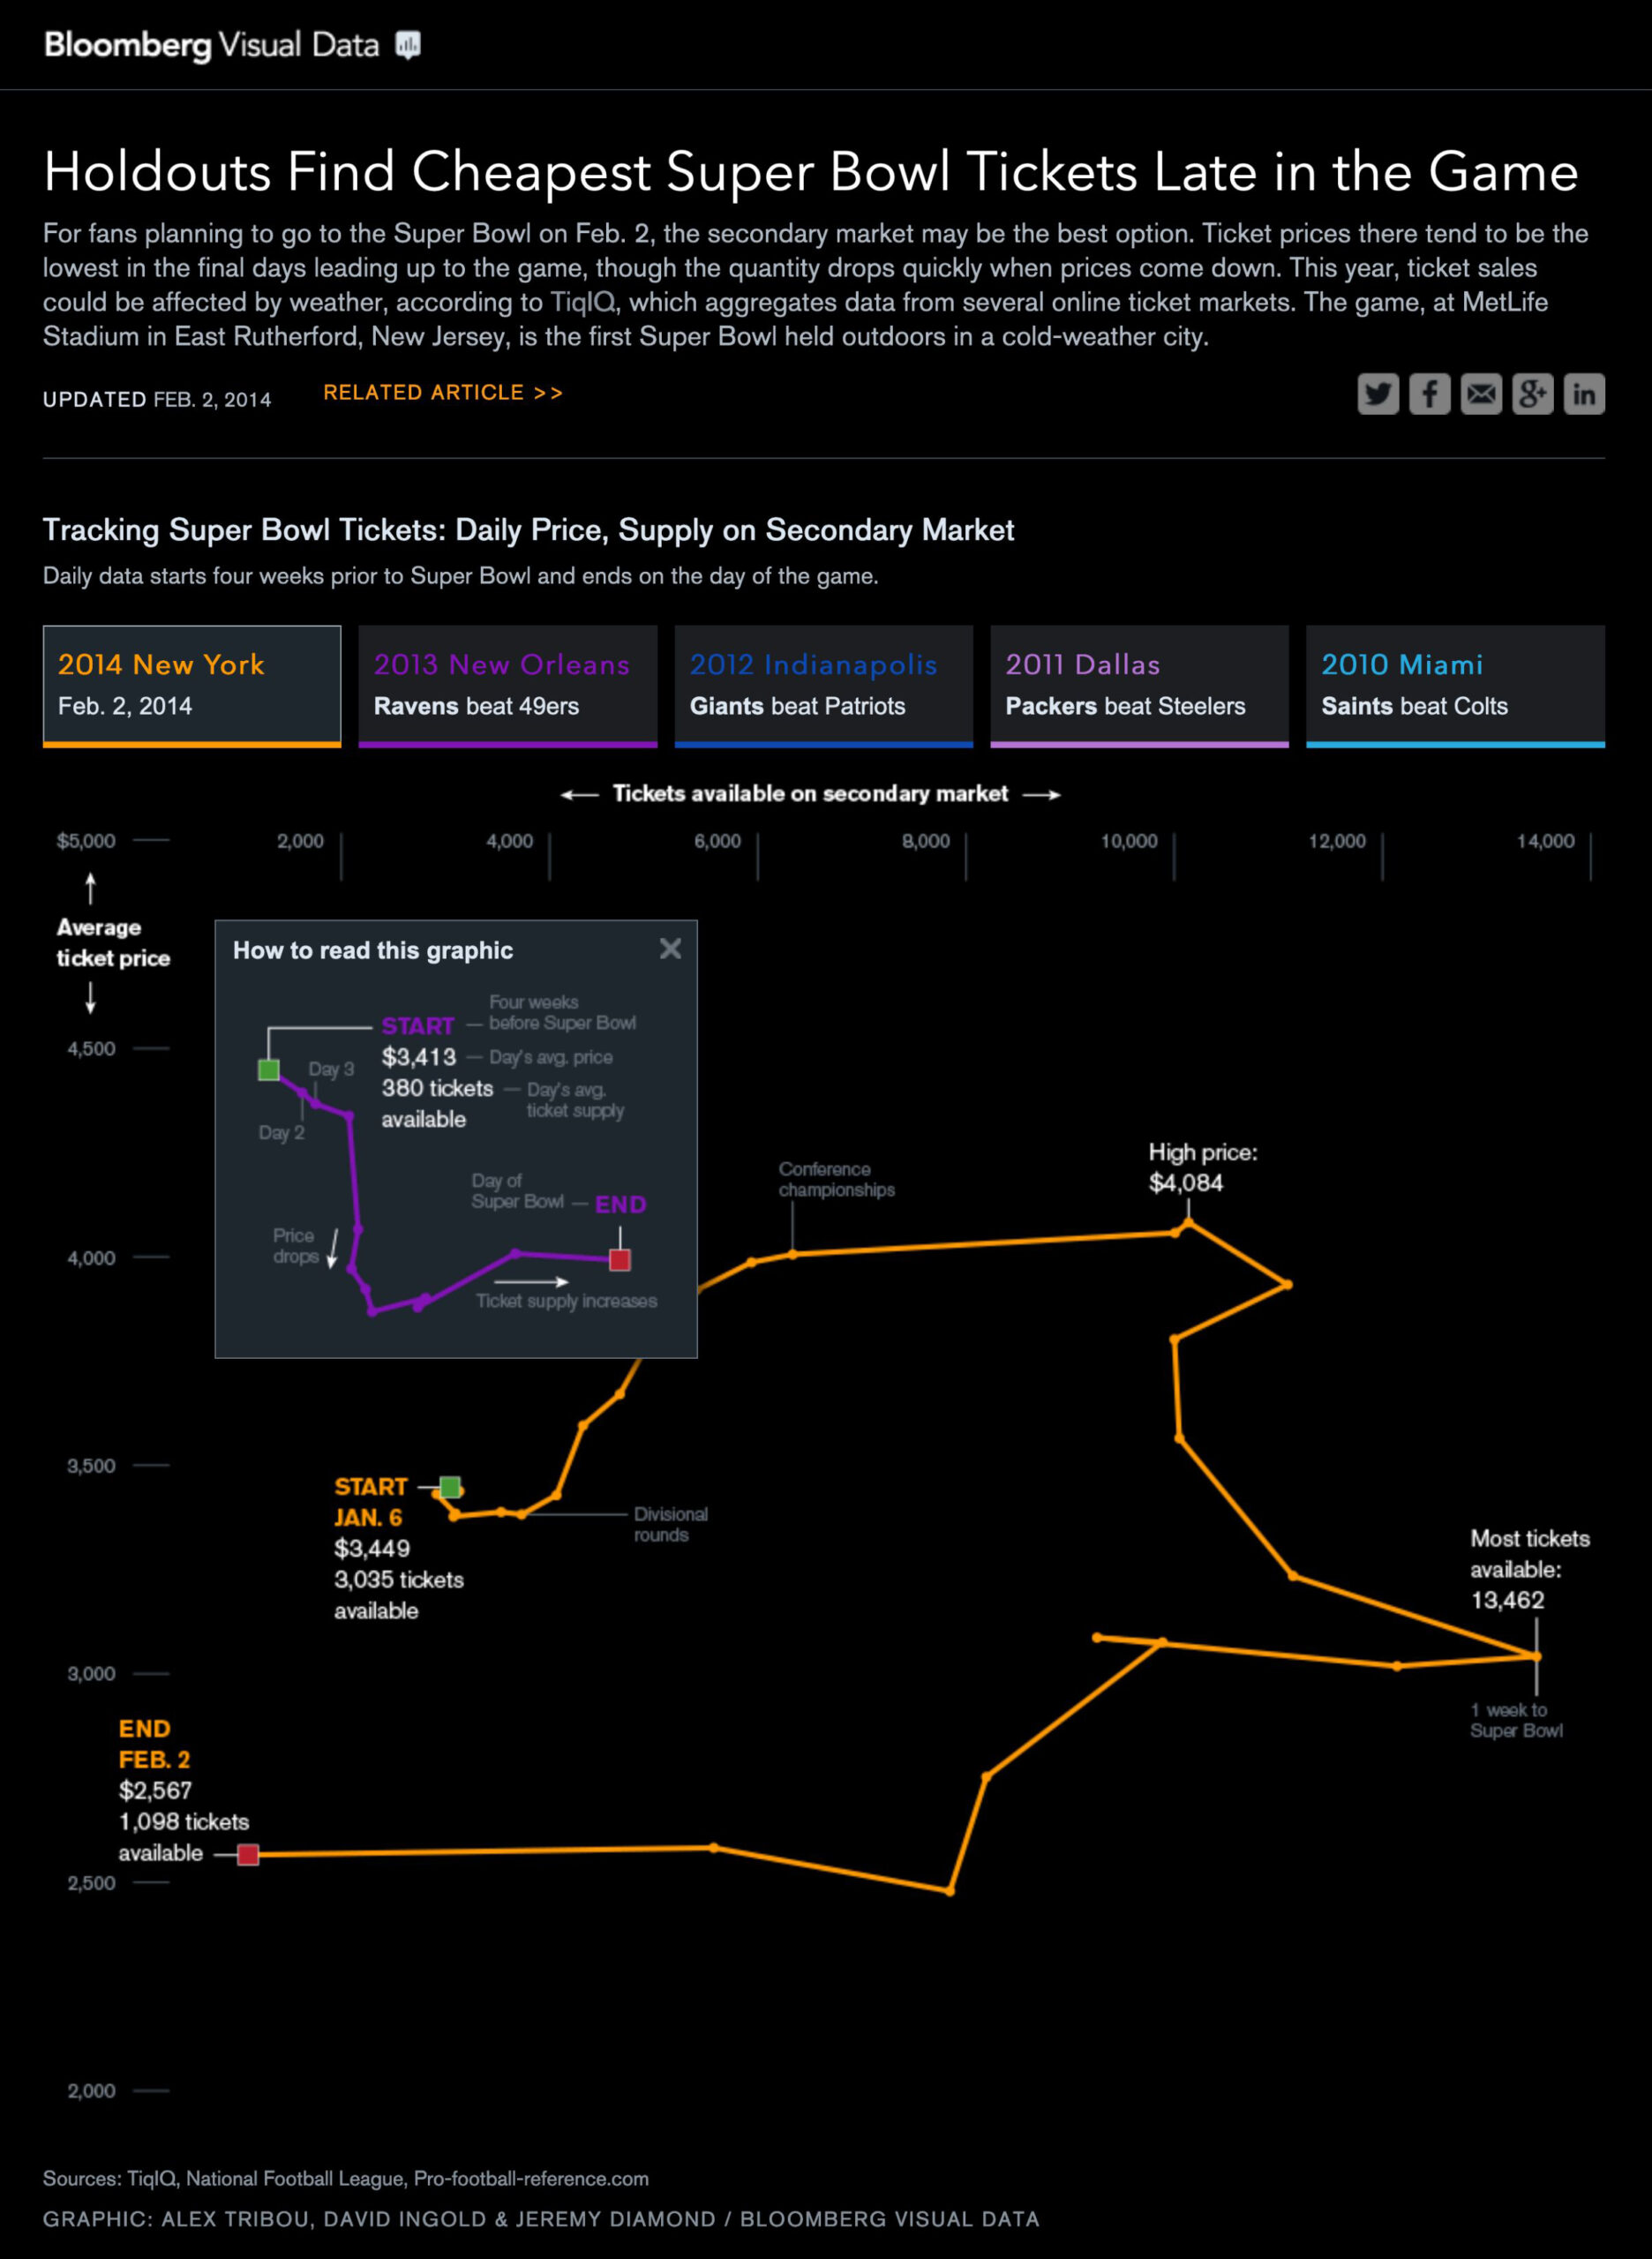
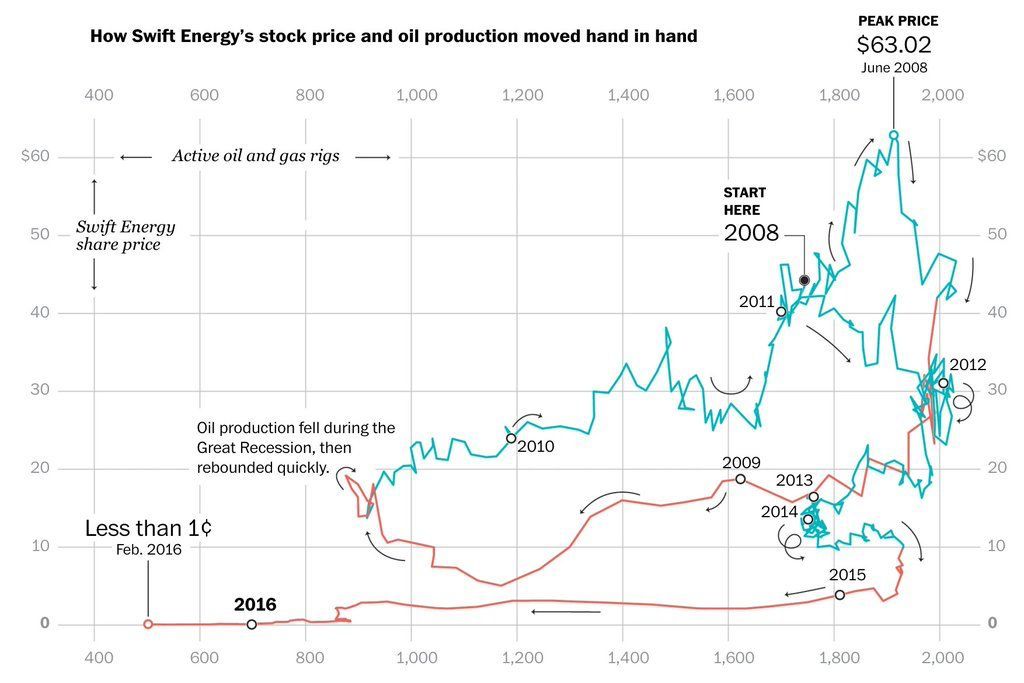
Connected Scatter Plot
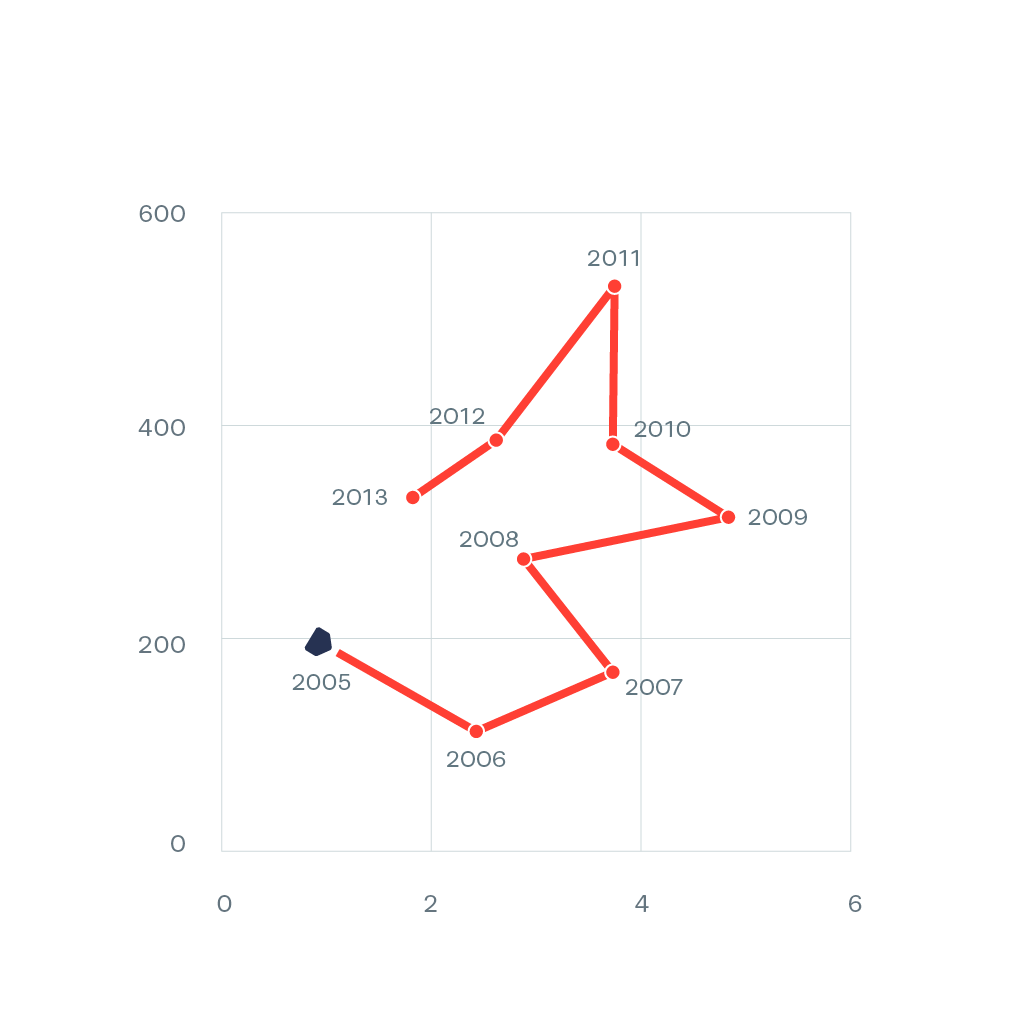
The connected scatter plot is an hybrid between a scatter plot and a line graph, where the individual data points connected by straight lines in sequential order, which can help to show trends and patterns in the data. It can use three numerical variables as input: the first two variables are plotted on the x-axis and y-axis, respectively, and the third variable is used to label the data points in order (e.g. years).