Dot Chart
Also called: Dot Plot

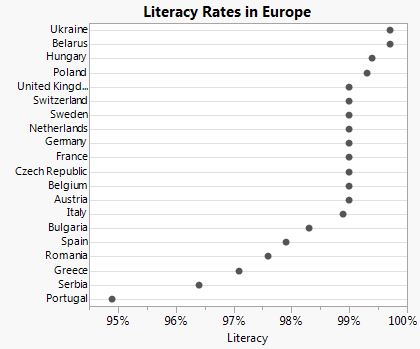
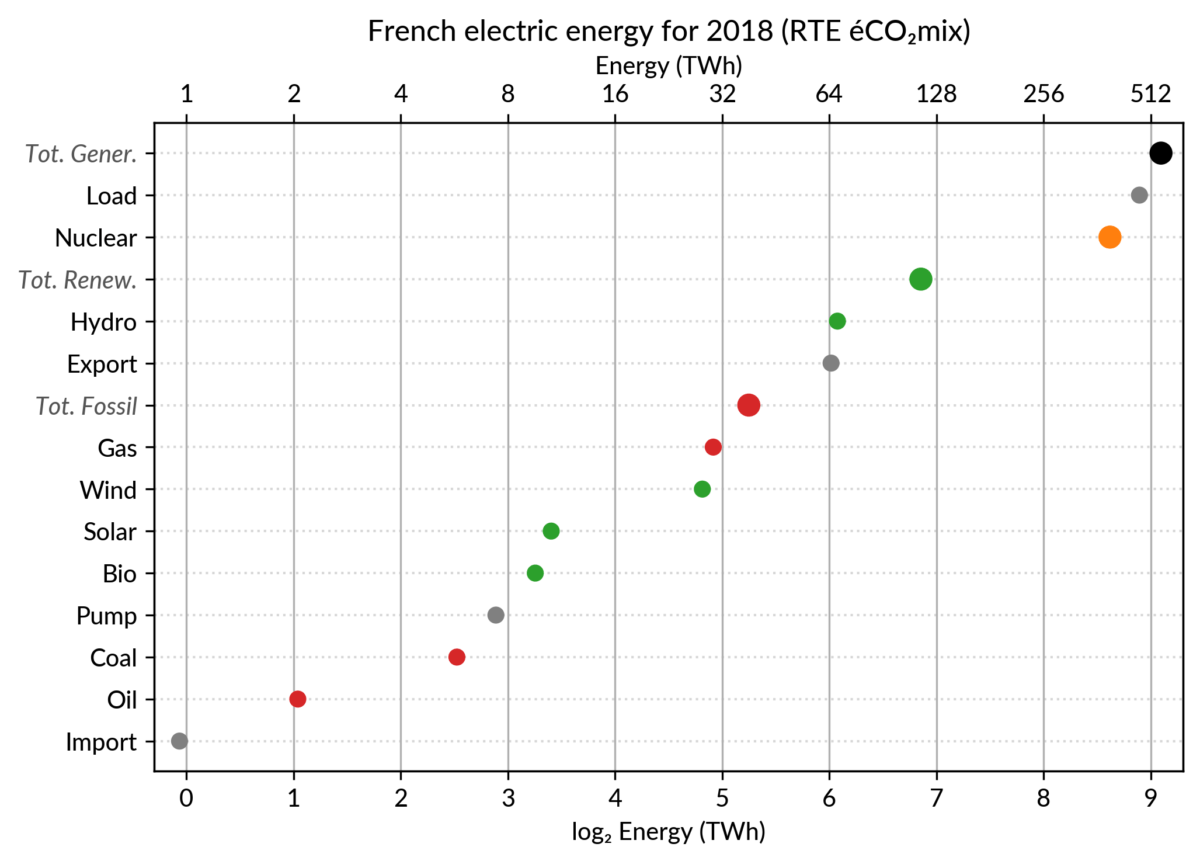
A dot chart is a simple two-dimensional chart used to compare the values of a one-dimensional variable across several categories. One axis is used to separate each category, and the other axis is the one the value is plotted along. If the categories’ order is not significant (chronologically for instance), it is common to sort the dot chart by values. The dot chart should not be mistaken with the scatter plot and its two-dimensional and often more numerous data points. Alternatives include the lollipop chart that adds lines to the dot chart, as well as the classic bar chart.