Jitter Plot
Also called: Jittered Strip Plot or Jittered Individual Value Plot
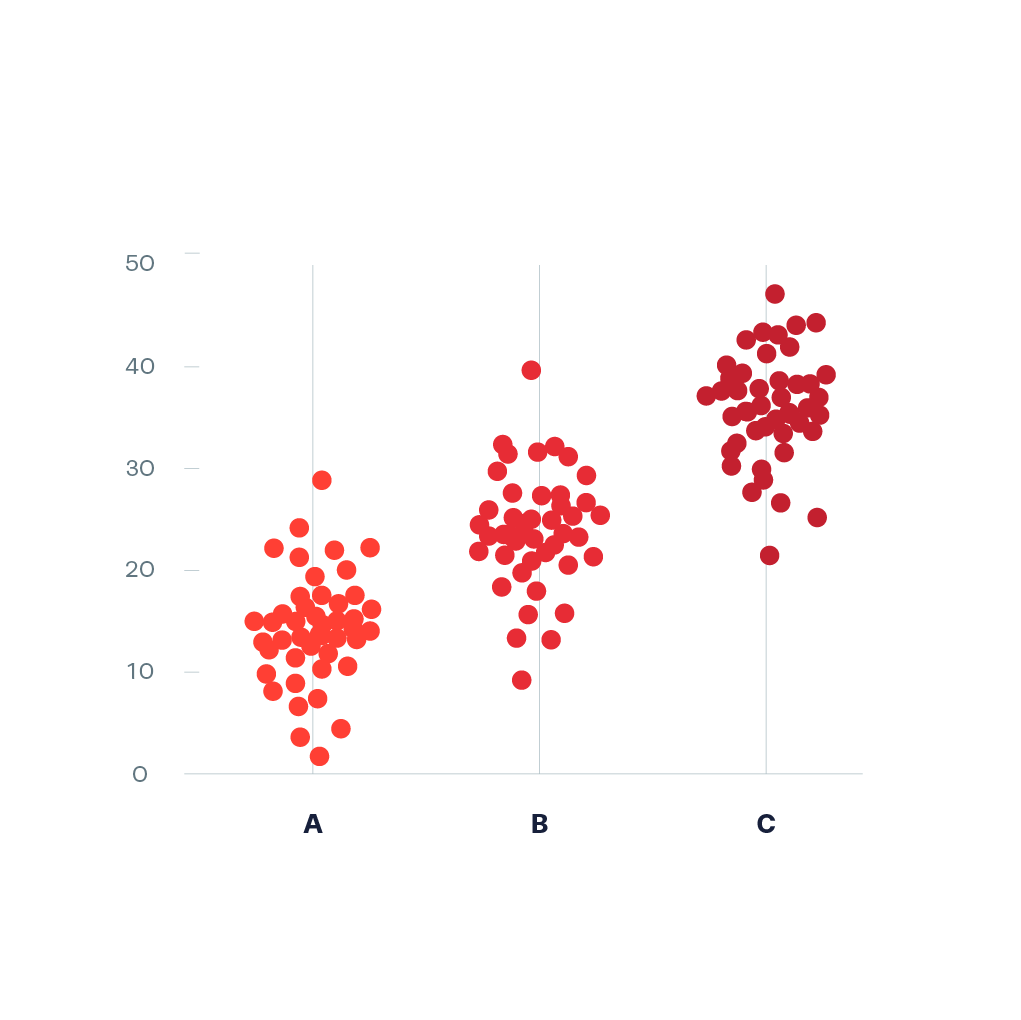
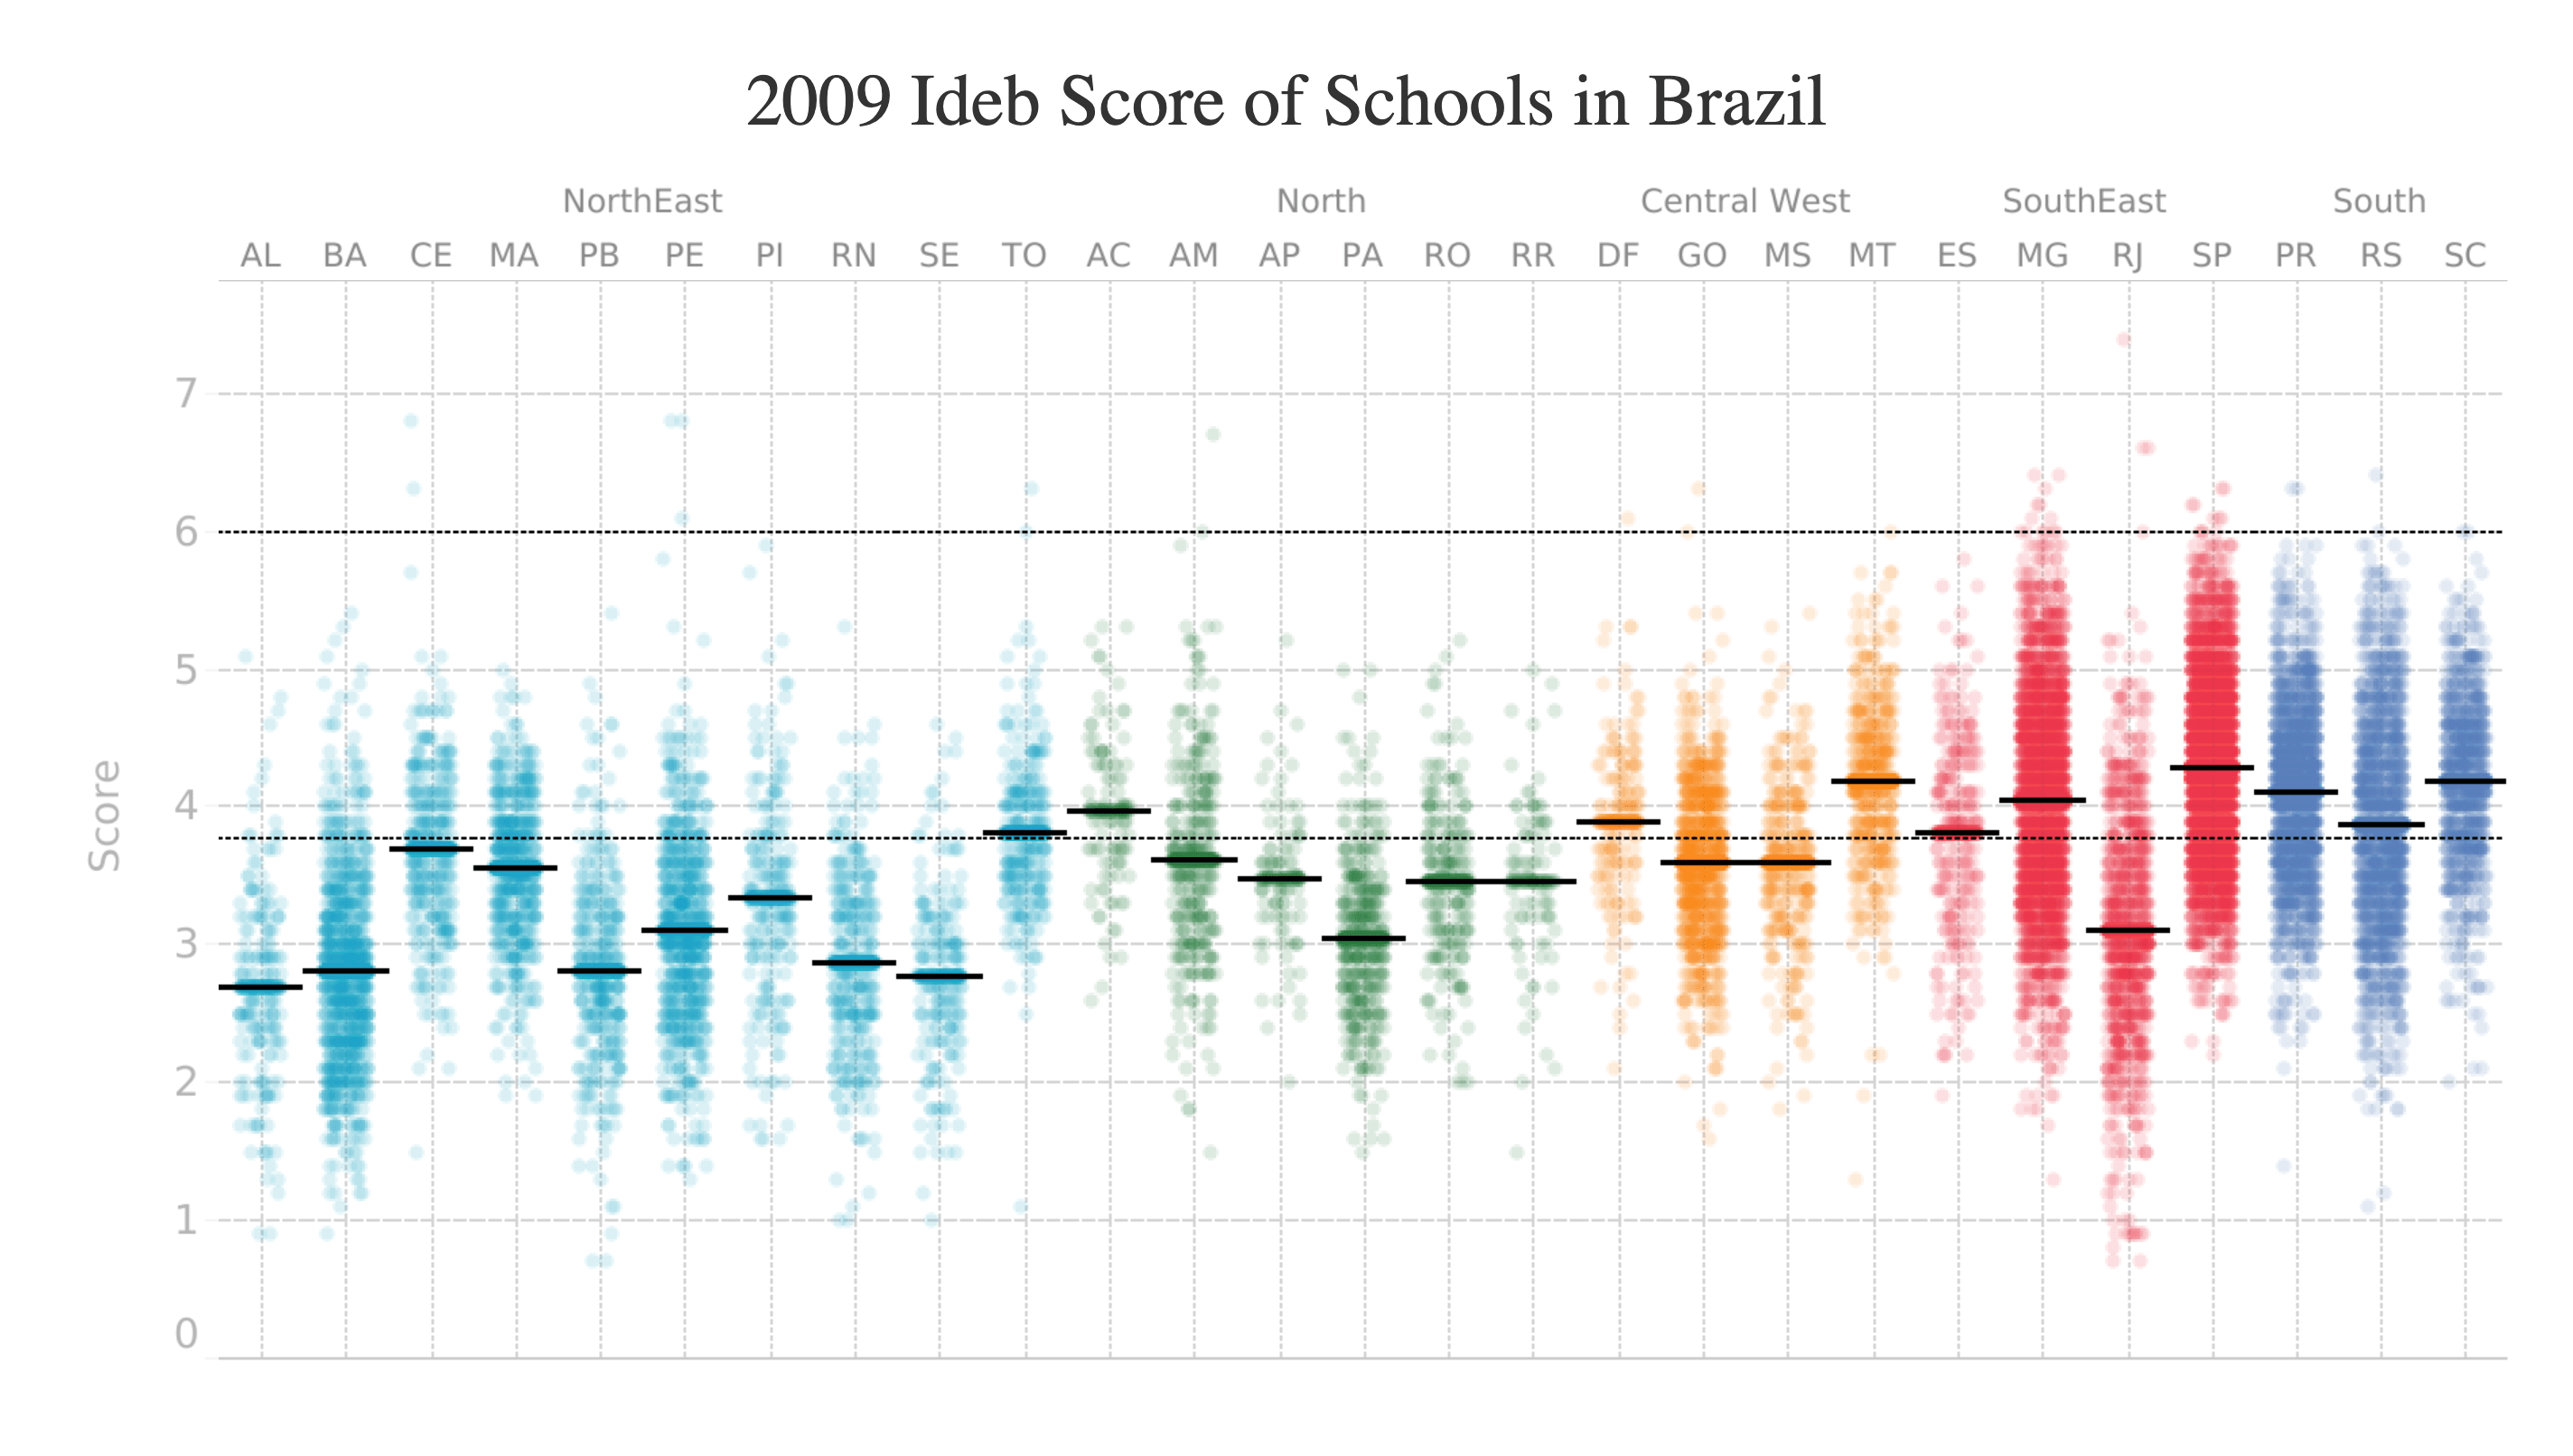
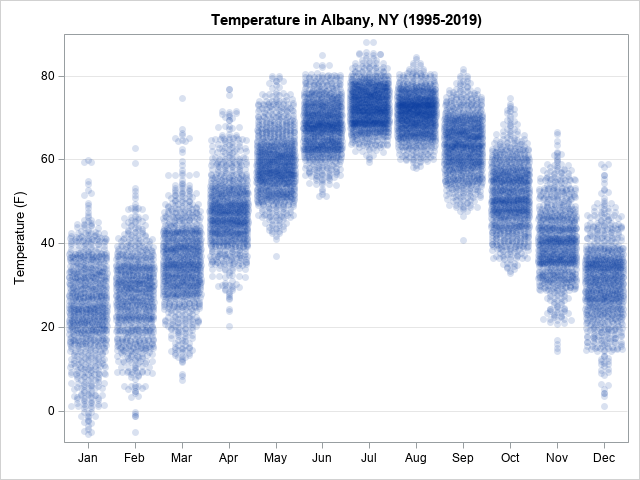
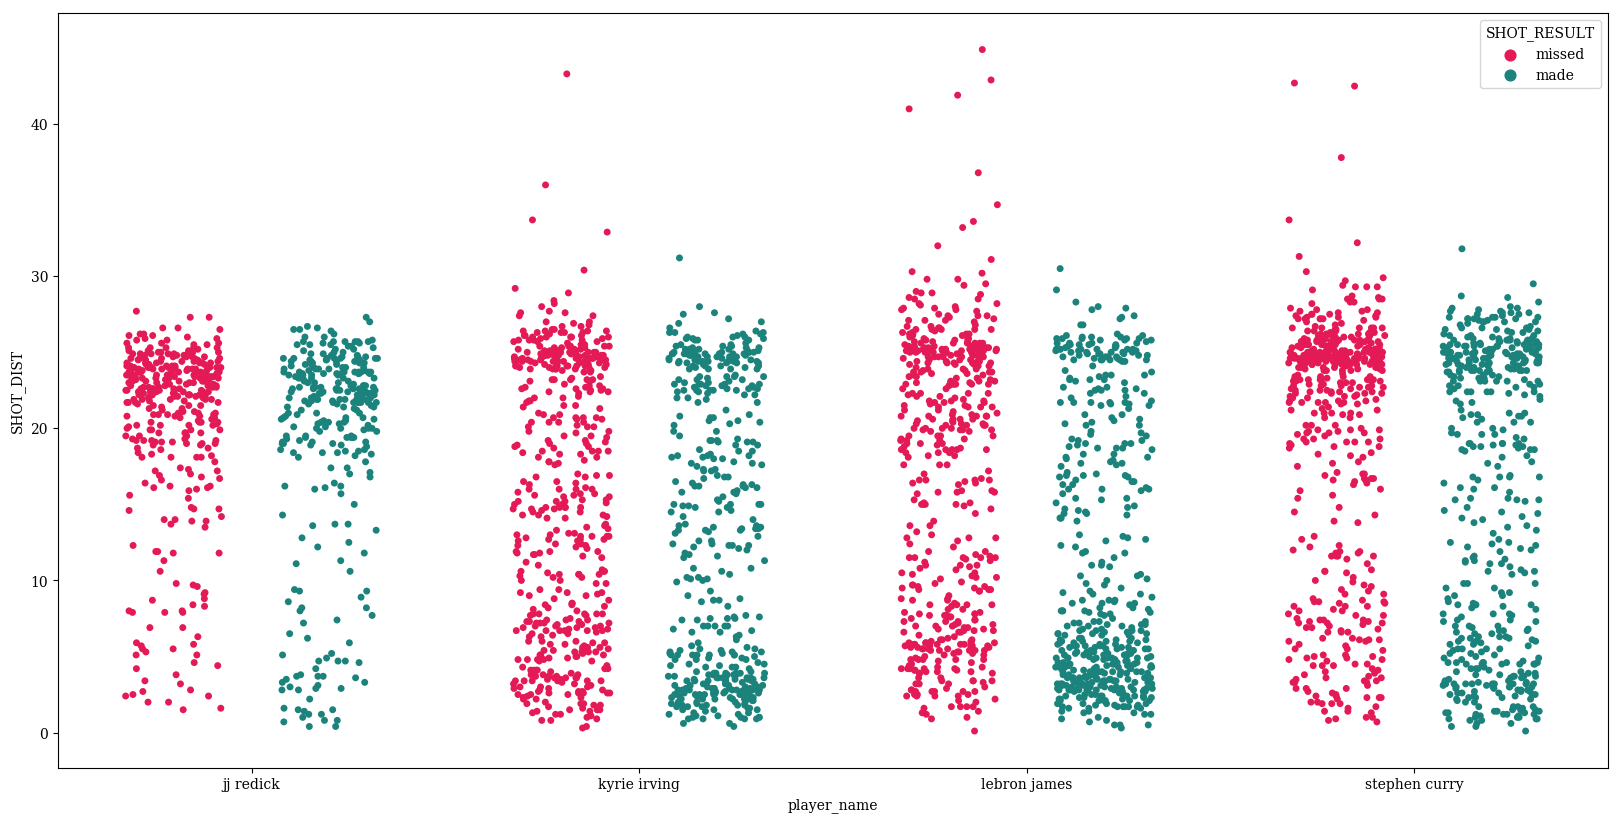
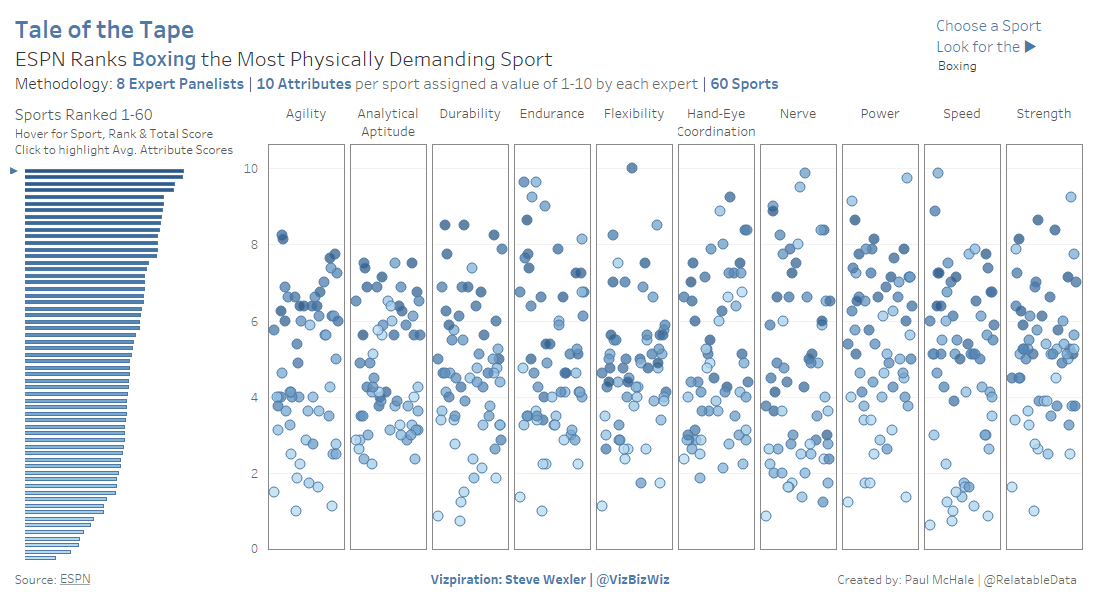
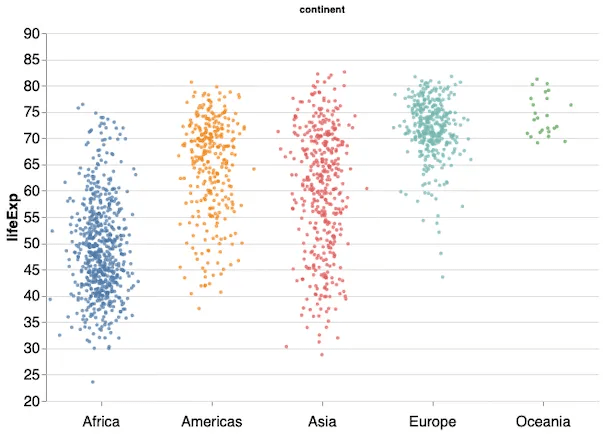
A jitter plot is a variant of the strip plot with a better view of overlapping data points, used to visualise the distribution of many individual one-dimensional values. The values are plotted as dots along one axis, and the dots are then shifted randomly along the other axis, which has no meaning in itself data-wise, allowing the dots not to overlap. Typically, several jitter plots are placed side by side to compare the distributions of data points among several values, categories or ranges.
Another way to avoid overlap in a strip plot is to make a counts plot, and other ways to visualise similar data include violin plots and boxplots.