Counts Plot
Also called: Strip Plot with Counts or Individual Value Plot with Counts
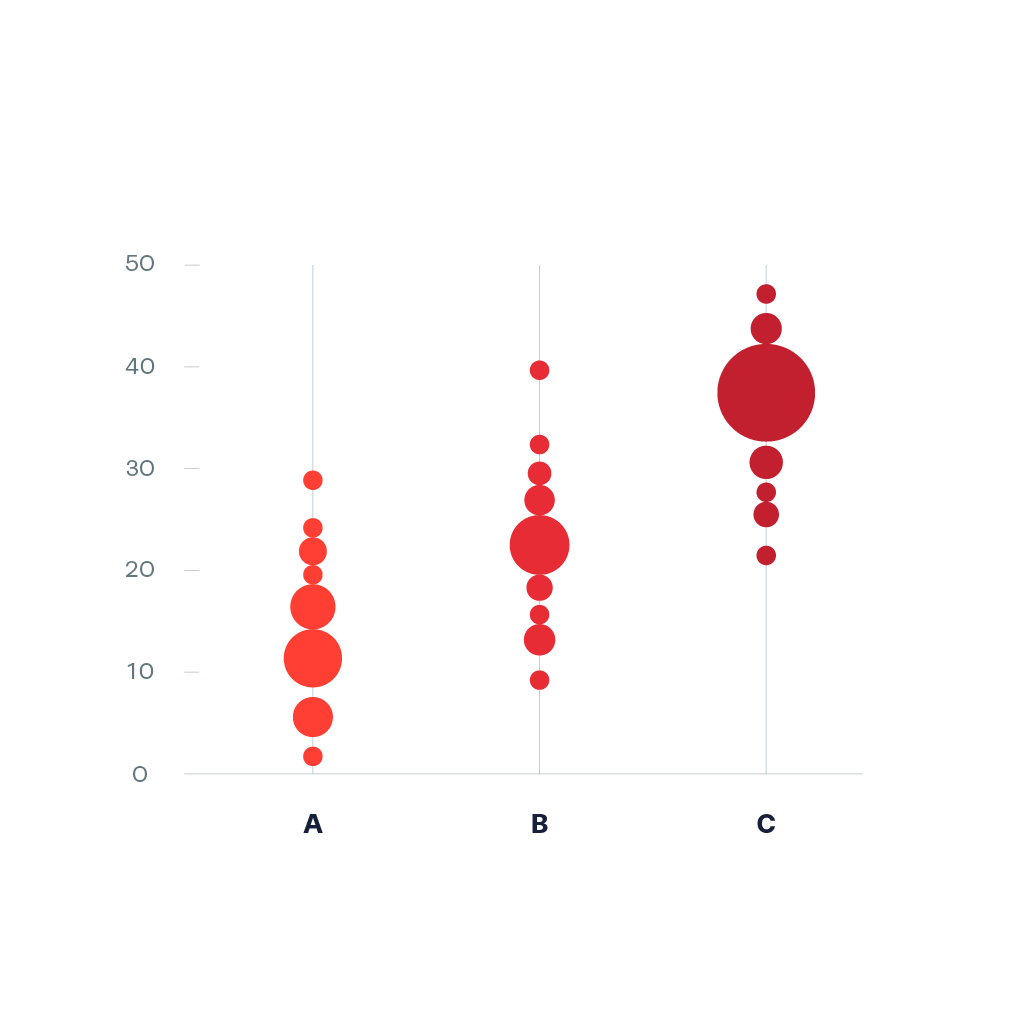
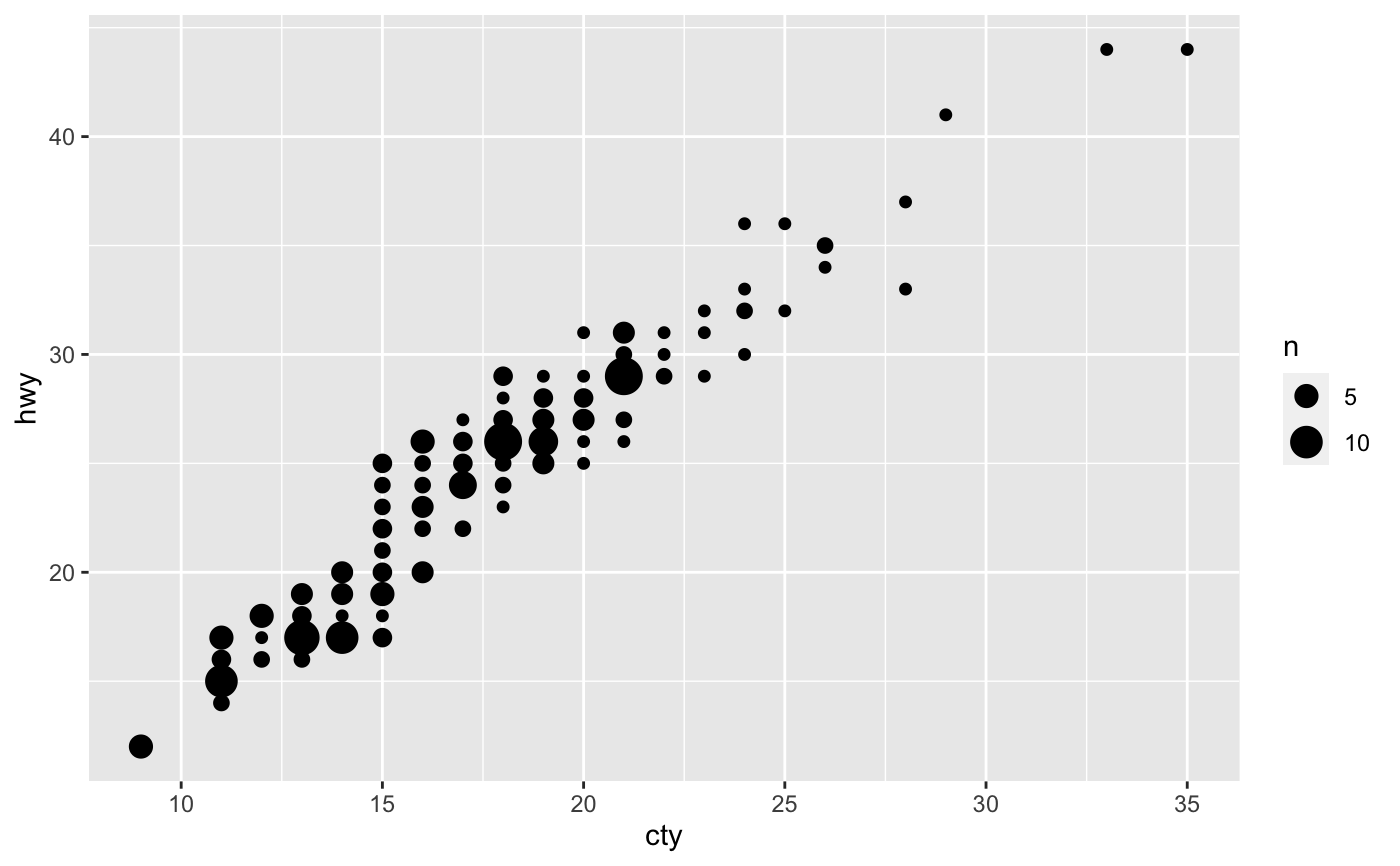
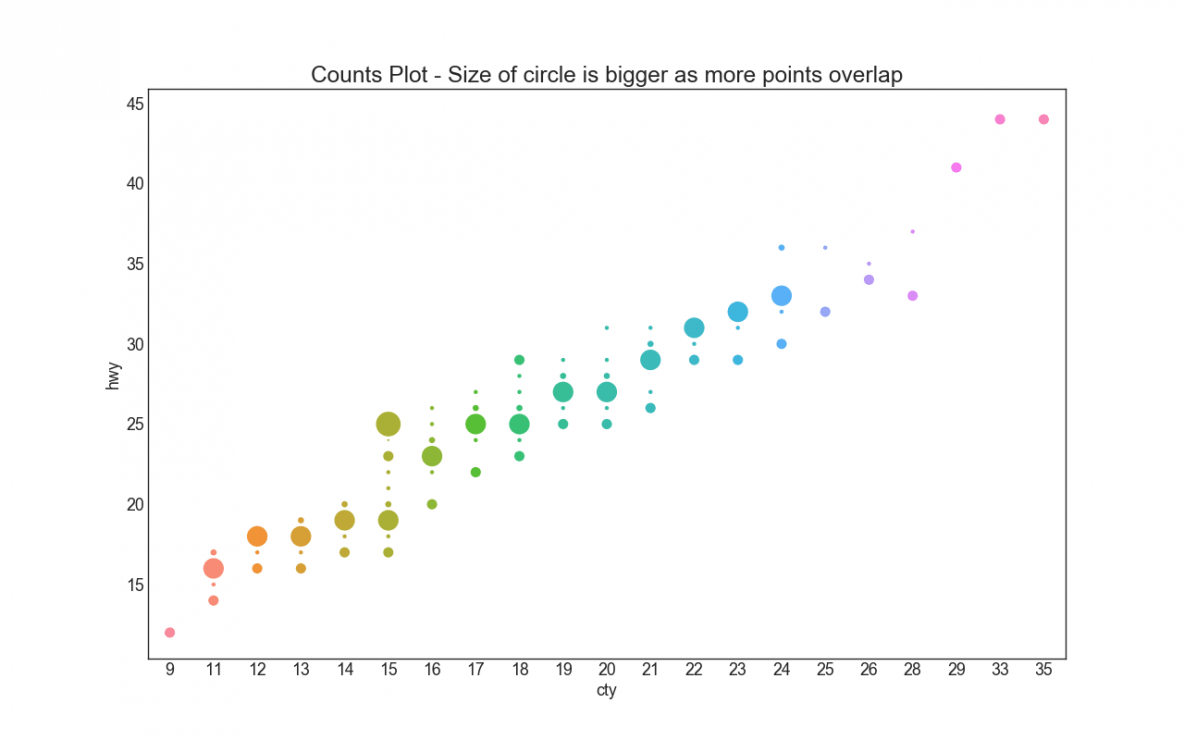
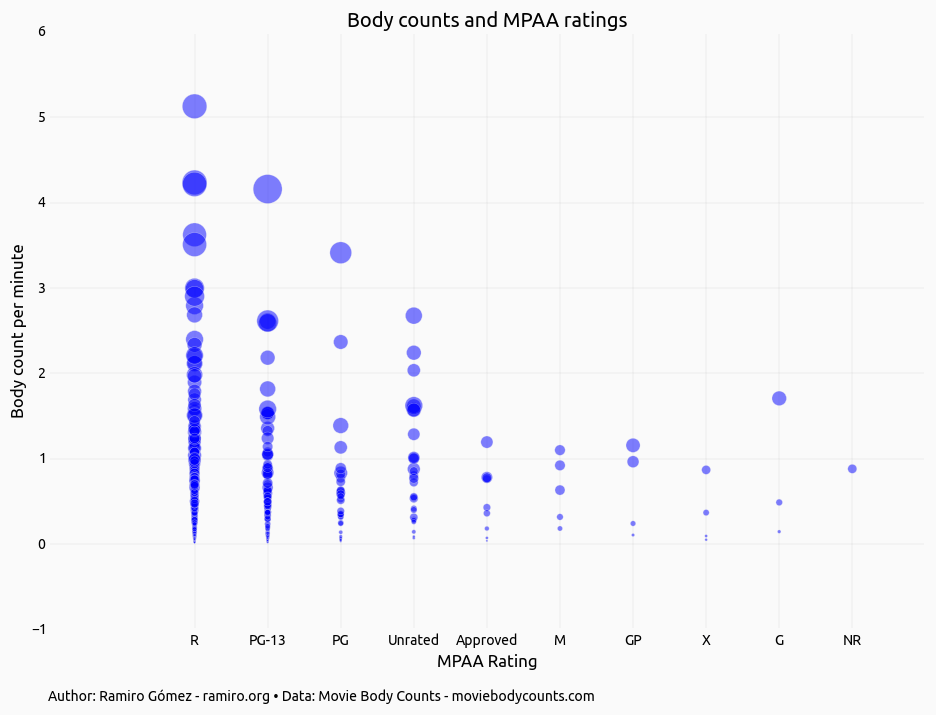
A counts plot is a variant of the strip plot with a better view of overlapping data points, used to visualise the distribution of many individual one-dimensional values. The values are plotted as dots along one unique axis, and dots with the same values are scaled-up, proportionally to how many dots would otherwise overlap there. Typically, several counts plots are placed side by side to compare the distributions of data points among several values, categories or ranges.
Another way to avoid overlap in a strip plot is to make a jitter plot, and other ways to visualise similar data include violin plots and boxplots.