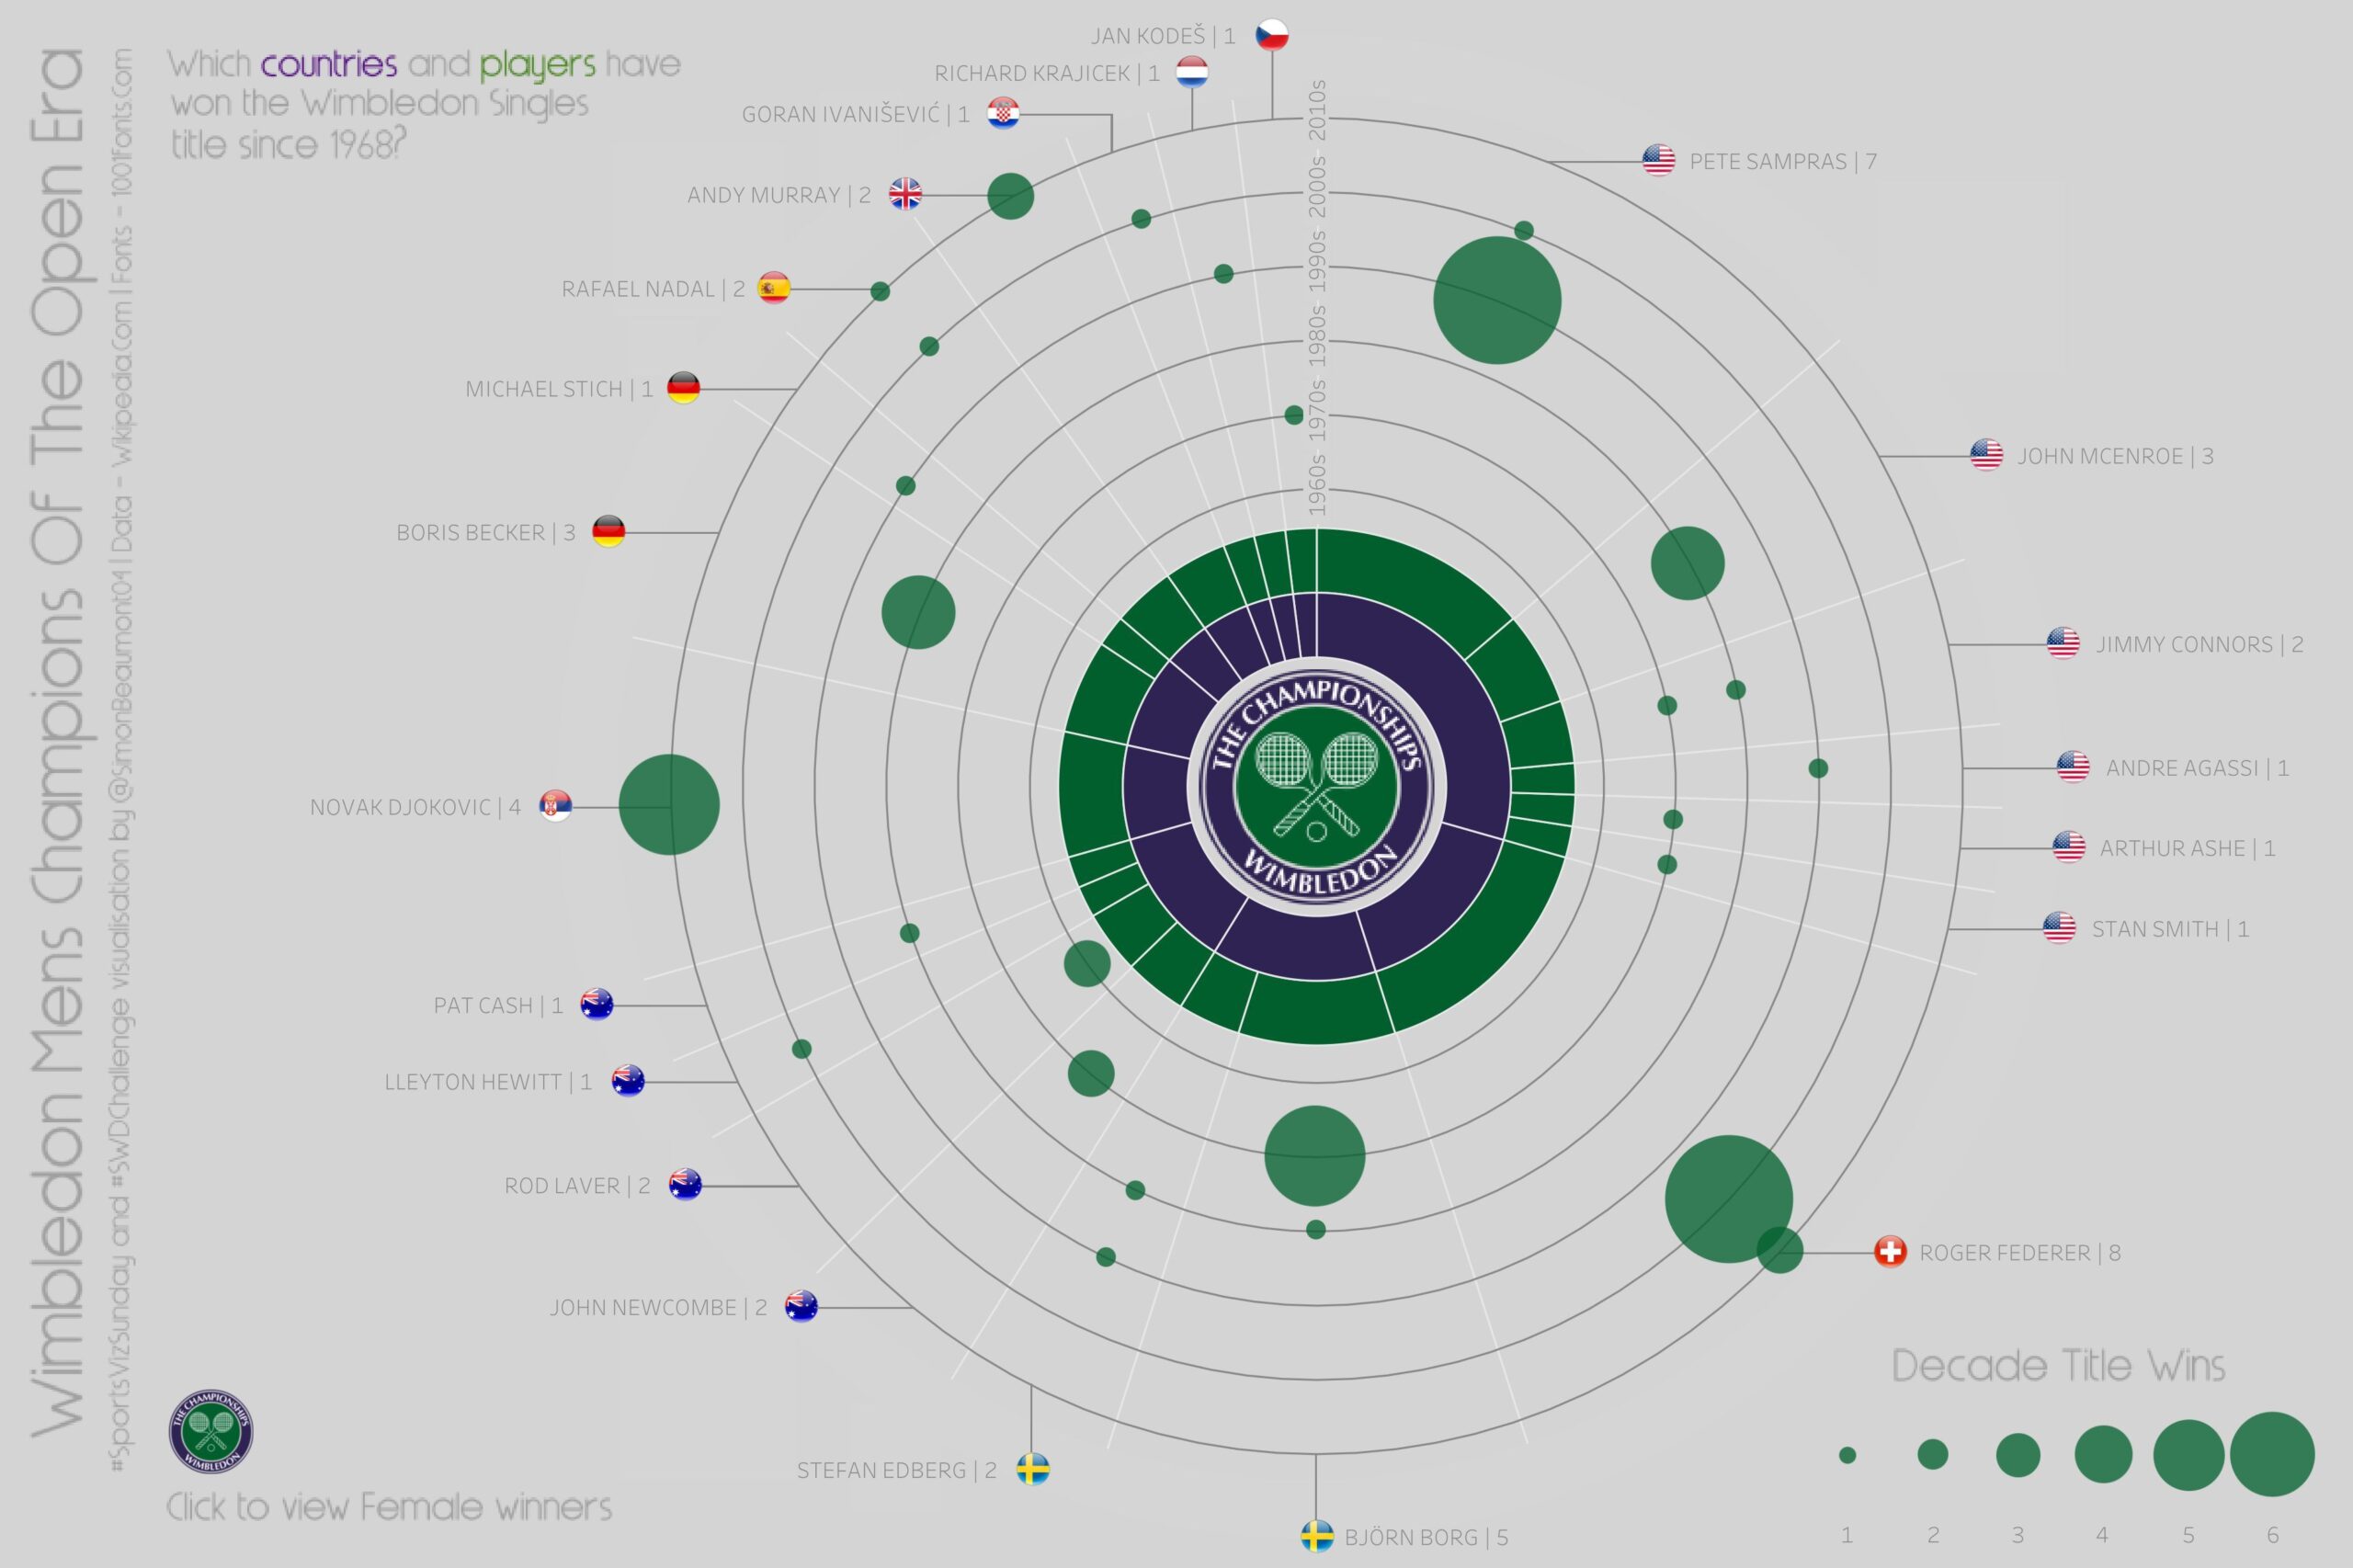
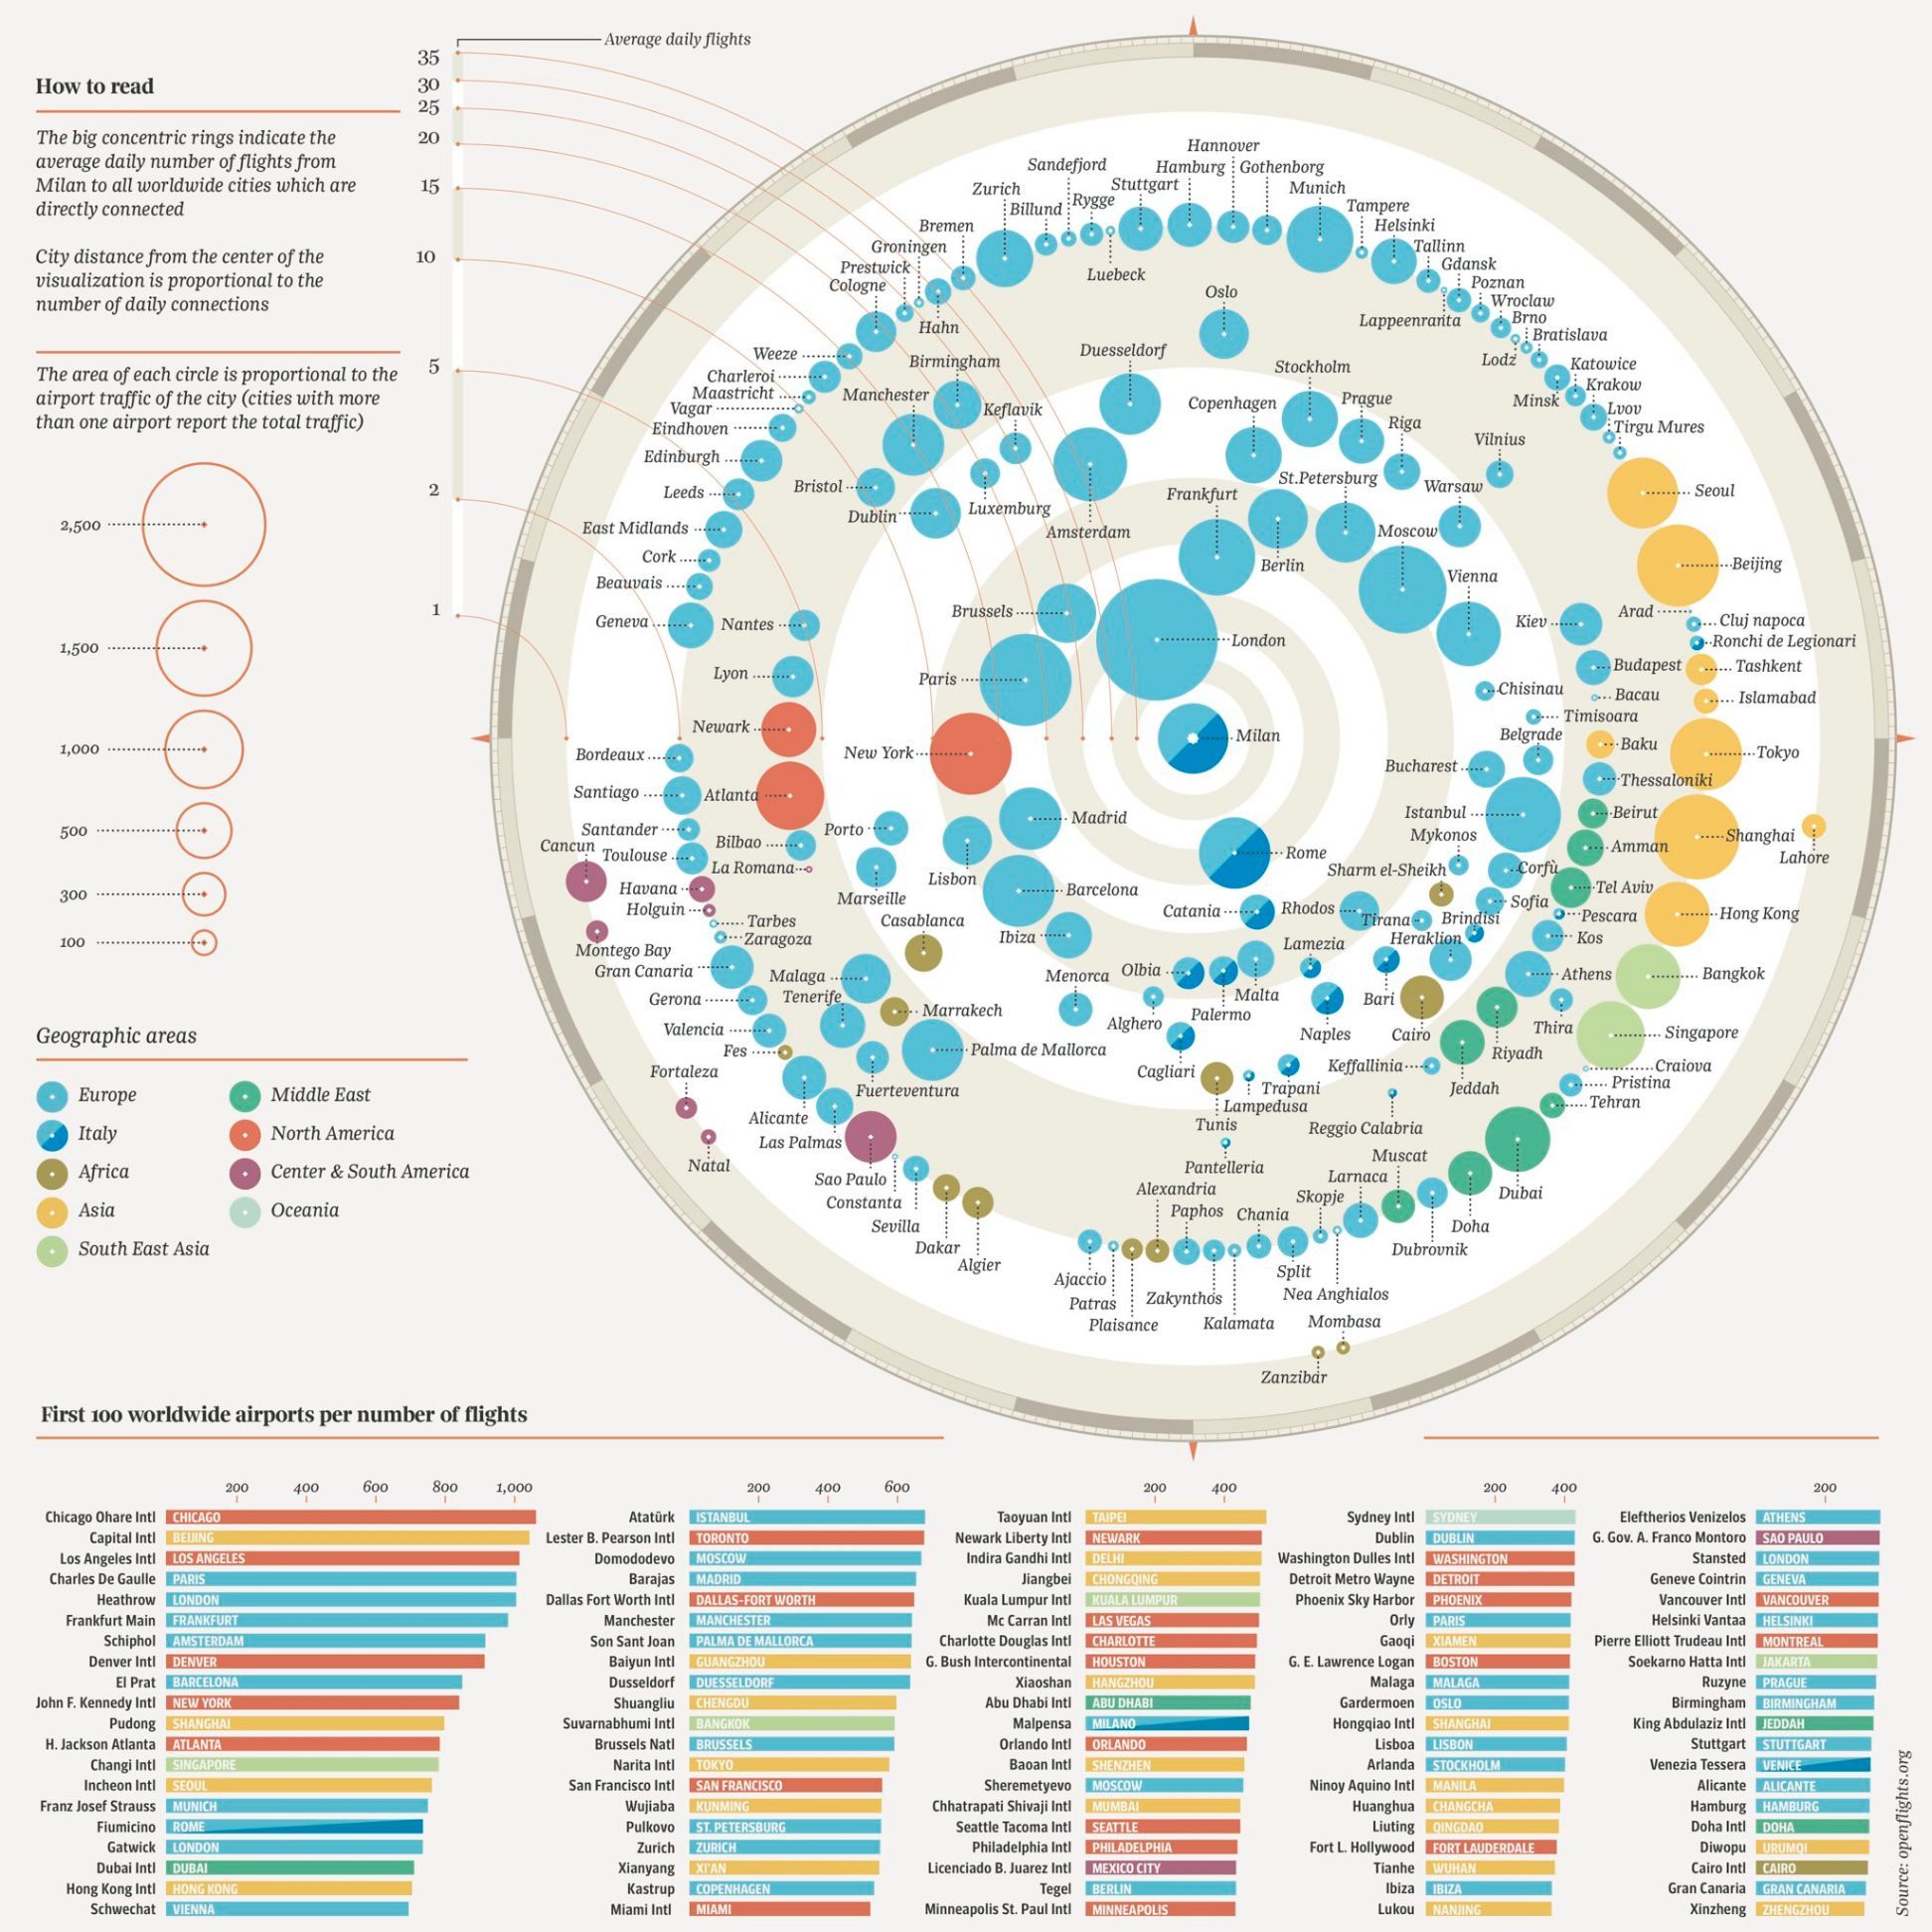
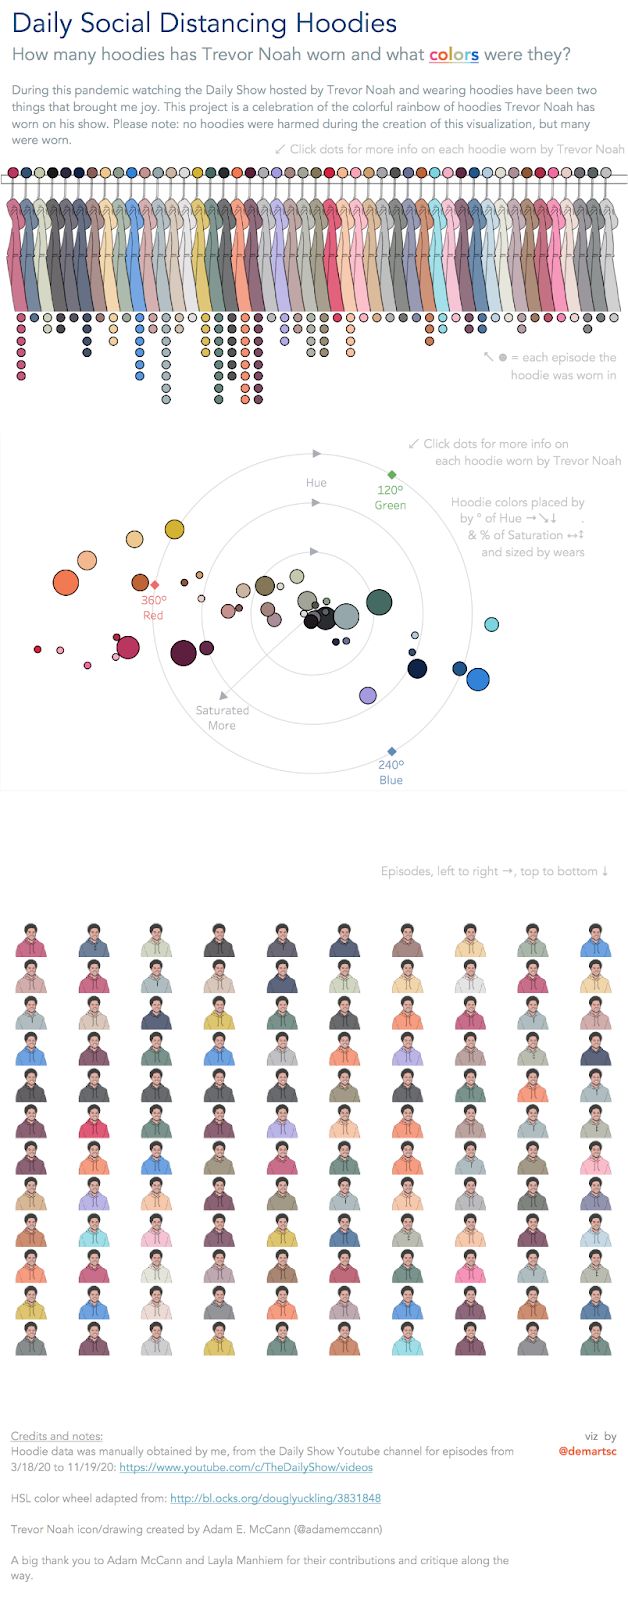
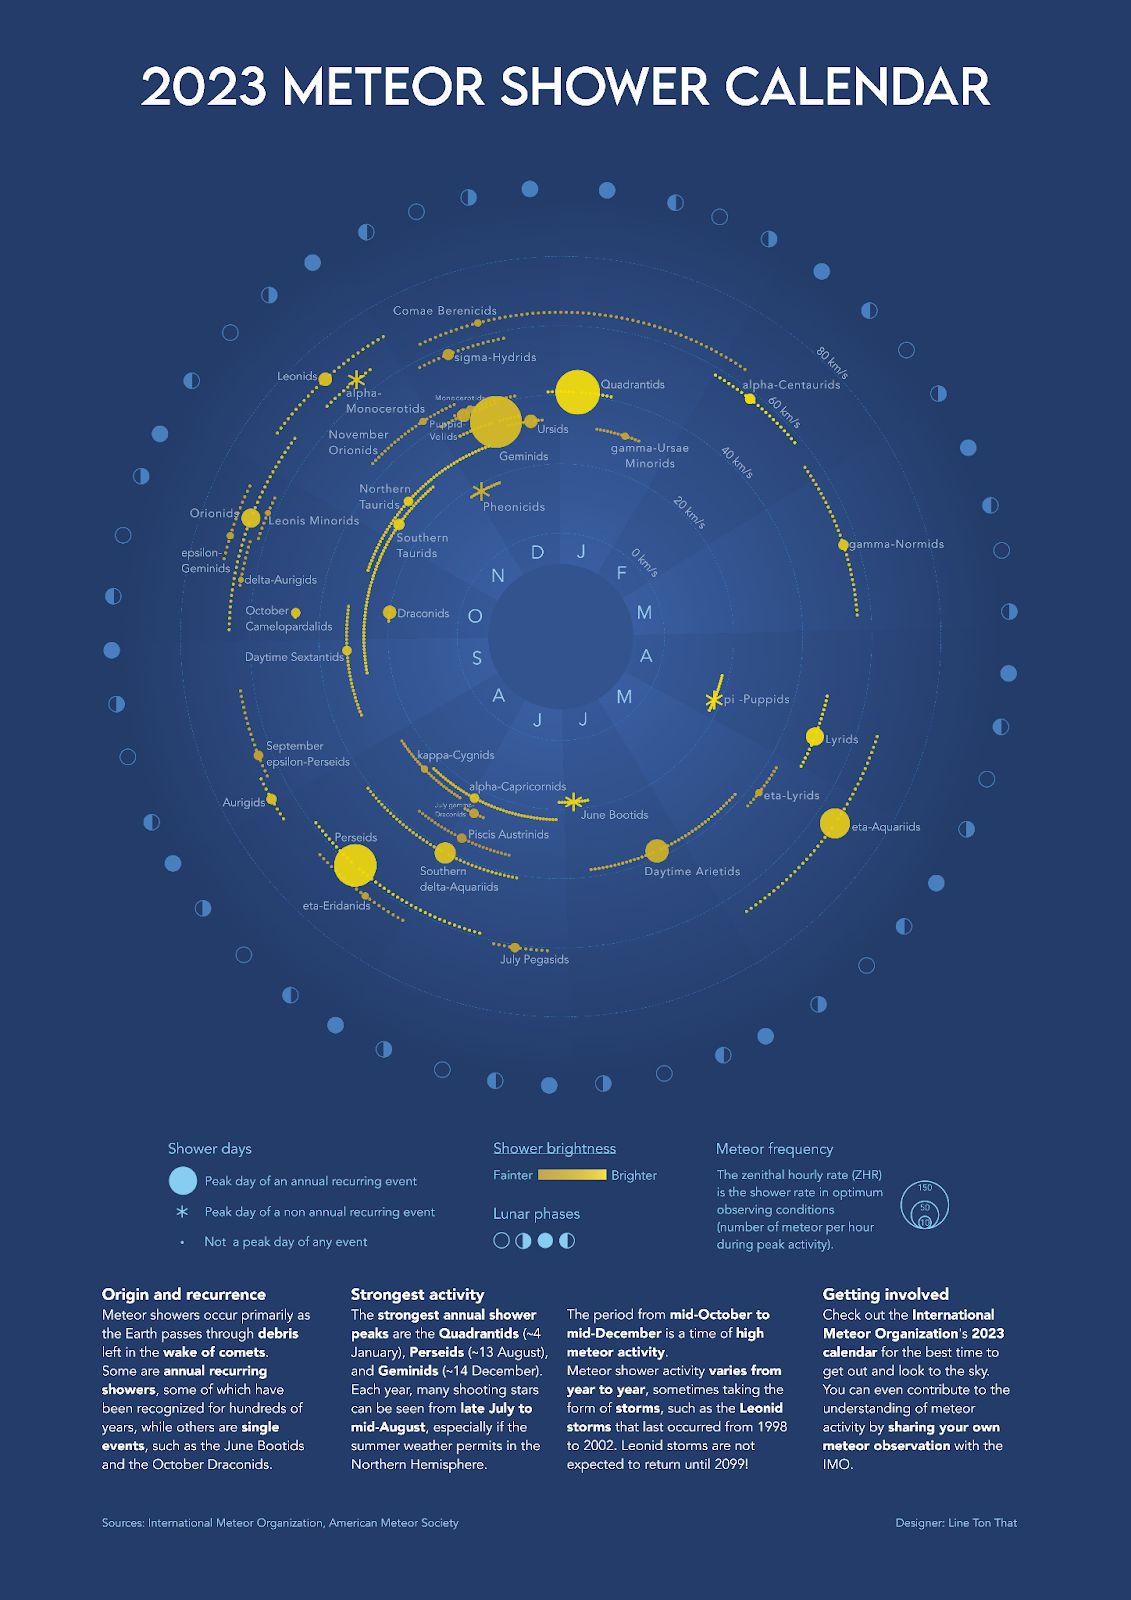
Circular Bubble Chart
Also called: Circular Proportional Area Chart
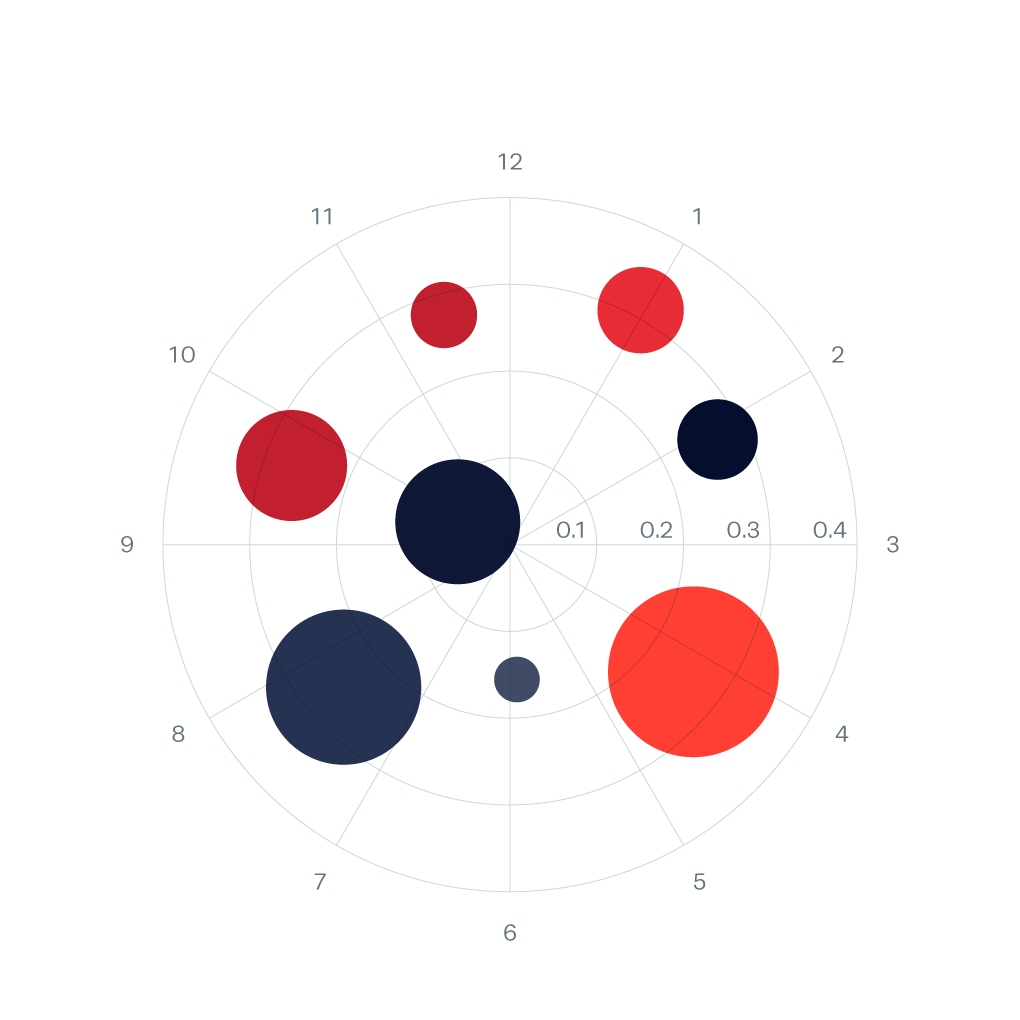
Circular bubble charts are the alternative to normal bubble charts, where the data points are plotted on a circular plane. They display three dimensions of data too and they can be considered a more advanced circular scatter plot.