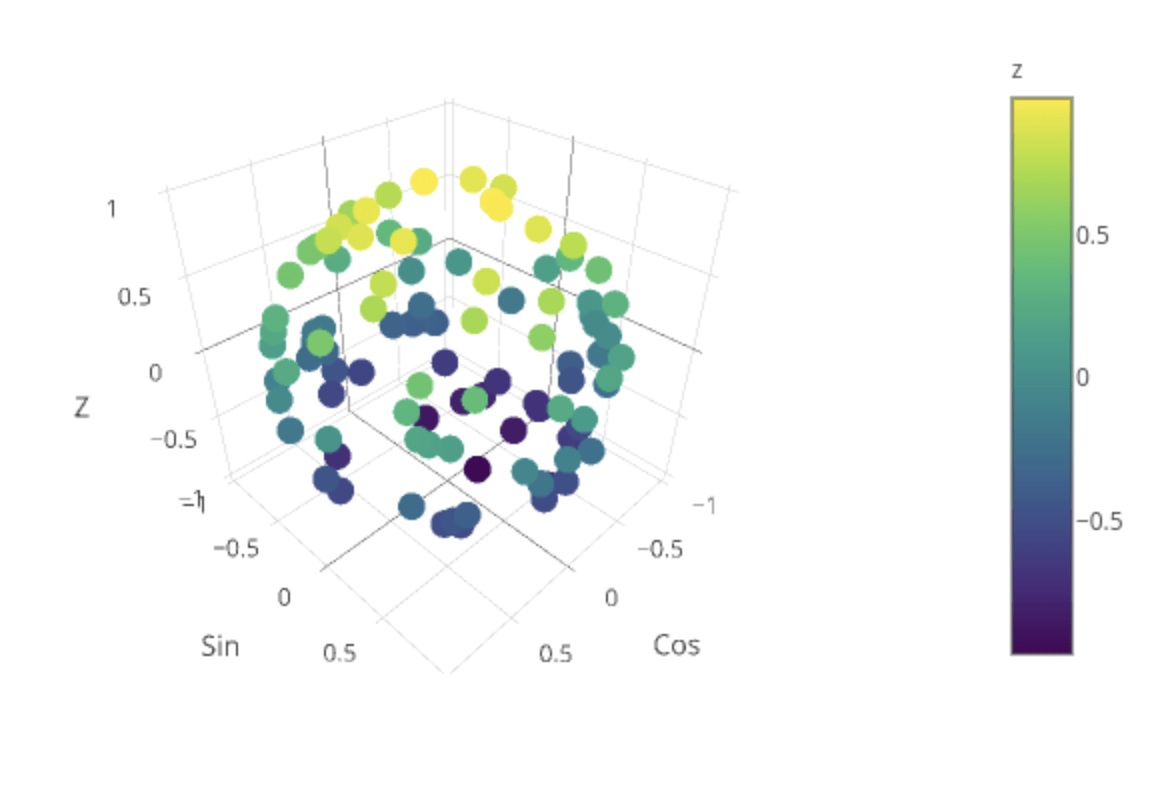
3D Scatter Plot

A three-dimensional scatter plot is like a scatter plot, but with g three variables.Provided that x, y, and z or f(x, y) are real numbers, the graph can be represented as dots in a three-dimensional Cartesian coordinate system. It is typically drawn on a two-dimensional page or screen using perspective methods (isometric or perspective), so that one of the dimensions appears to be coming out of the page.