Opposite Diagram
Also called: 2x2 Diagram, 2x2 Matrix
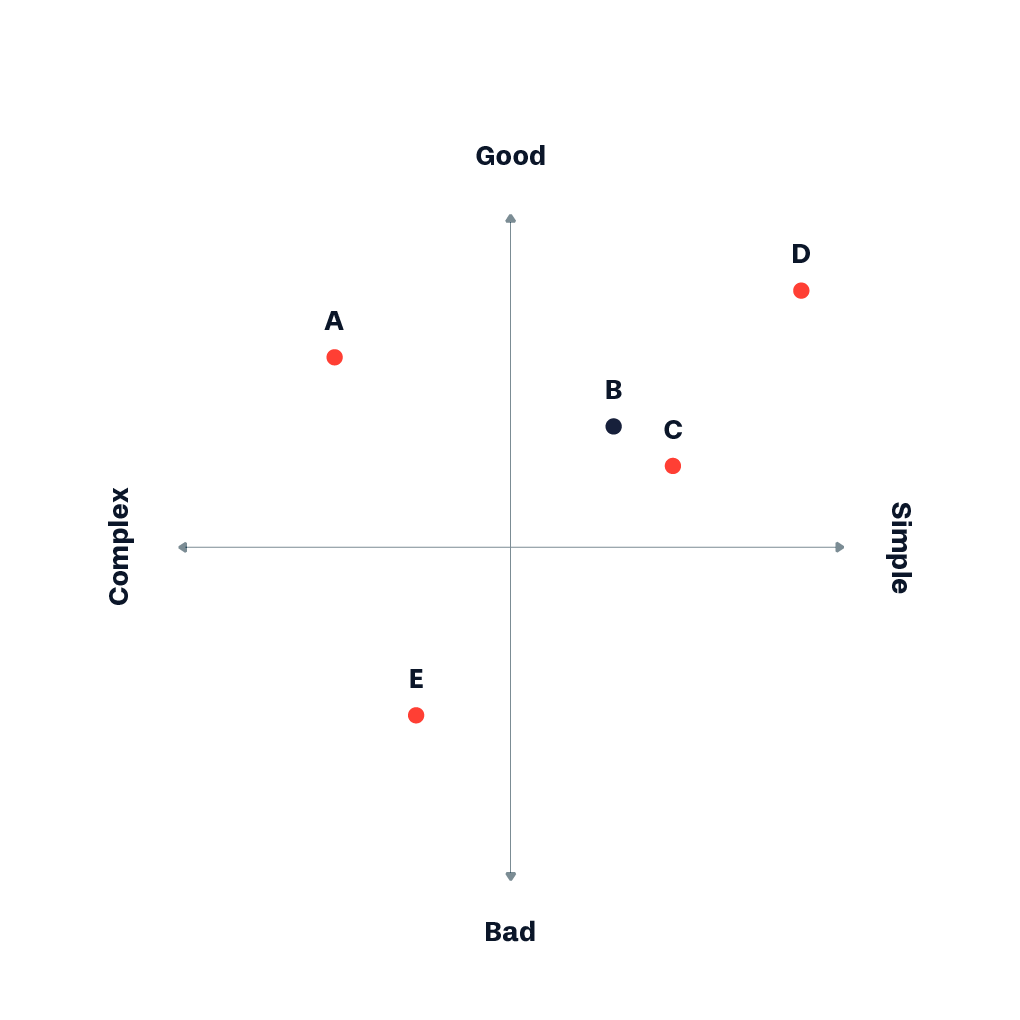
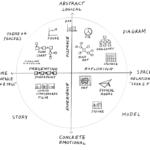
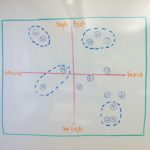
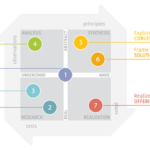
The opposite diagram can be used to display two set of opposites in a horizontal and vertical axis using Cartesian coordinates.
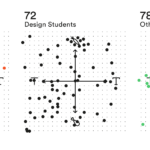
The data or items are displayed as a collection of points, each having the value of two variables determining the position on the horizontal axis and the value of the other variable determining the position on the vertical axis. In many ways it is similar to the scatter plot.
The values can be data driven, but it is often used for conceptual purposes by displaying opposites of an issue on a relative scale.

