Taylor Diagram

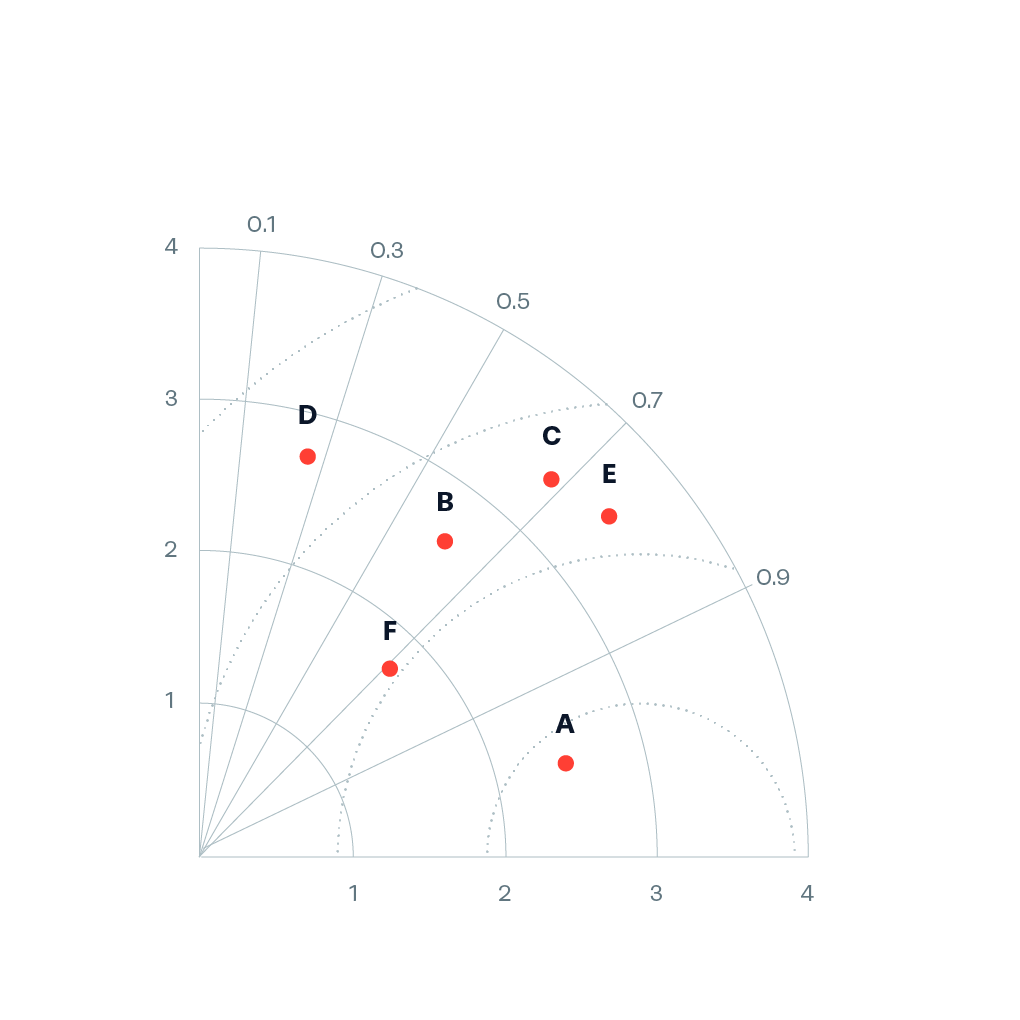
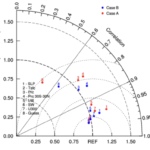
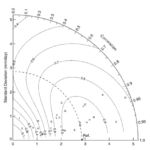
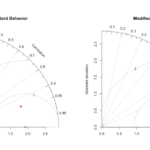
Taylor diagrams (Taylor, 2001) provide a way of graphically summarizing how closely a pattern (or a set of patterns) matches observations. The similarity between two patterns is quantified in terms of their correlation, their centered root-mean-square difference and the amplitude of their variations (represented by their standard deviations). These diagrams are especially useful in evaluating multiple aspects of complex models or in gauging the relative skill of many different models (e.g., IPCC, 2001).


