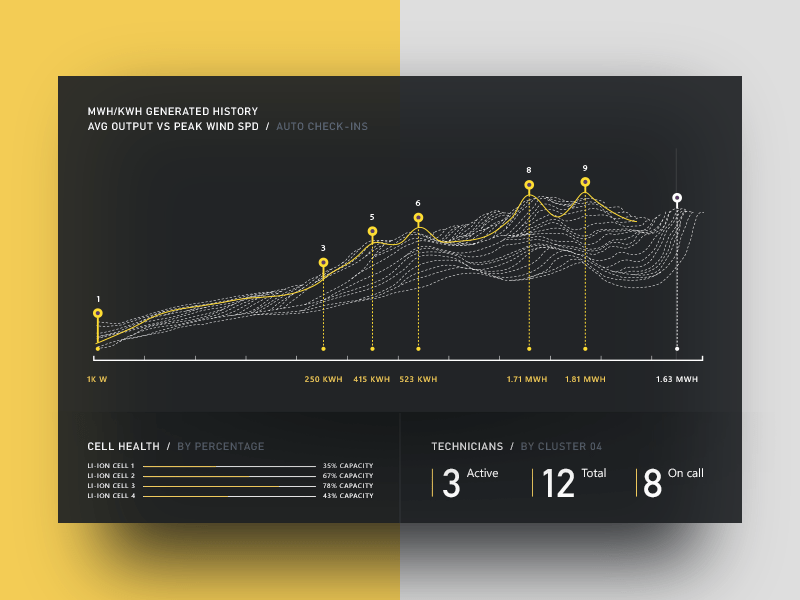
Spline Graph
Also called: Spline chart
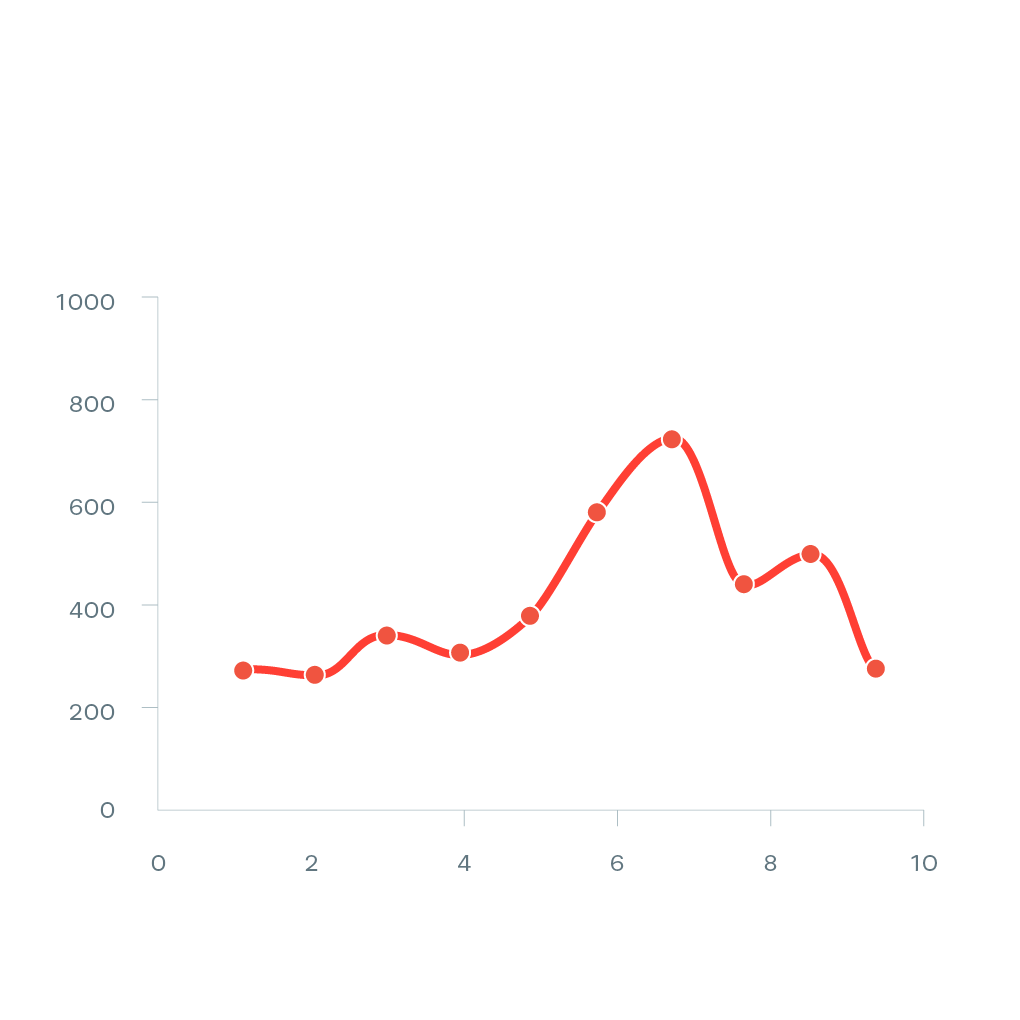
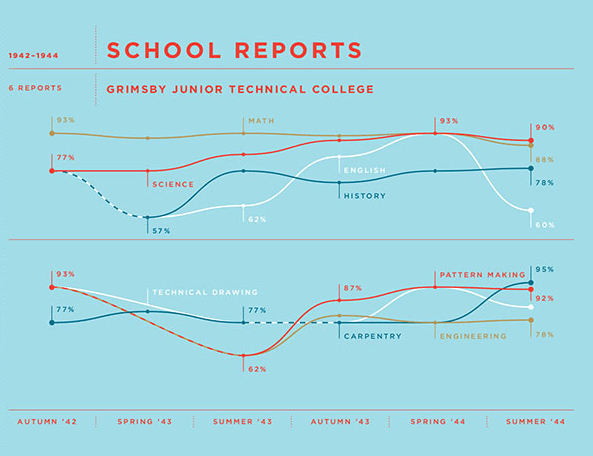
The Spline chart type is a Line graph that plots a fitted curve through each data point in a series. Line Charts show how a particular data changes at equal intervals of time.
Also called: Spline chart
The Spline chart type is a Line graph that plots a fitted curve through each data point in a series. Line Charts show how a particular data changes at equal intervals of time.