Layered Area Chart
Also called: Layered area graph
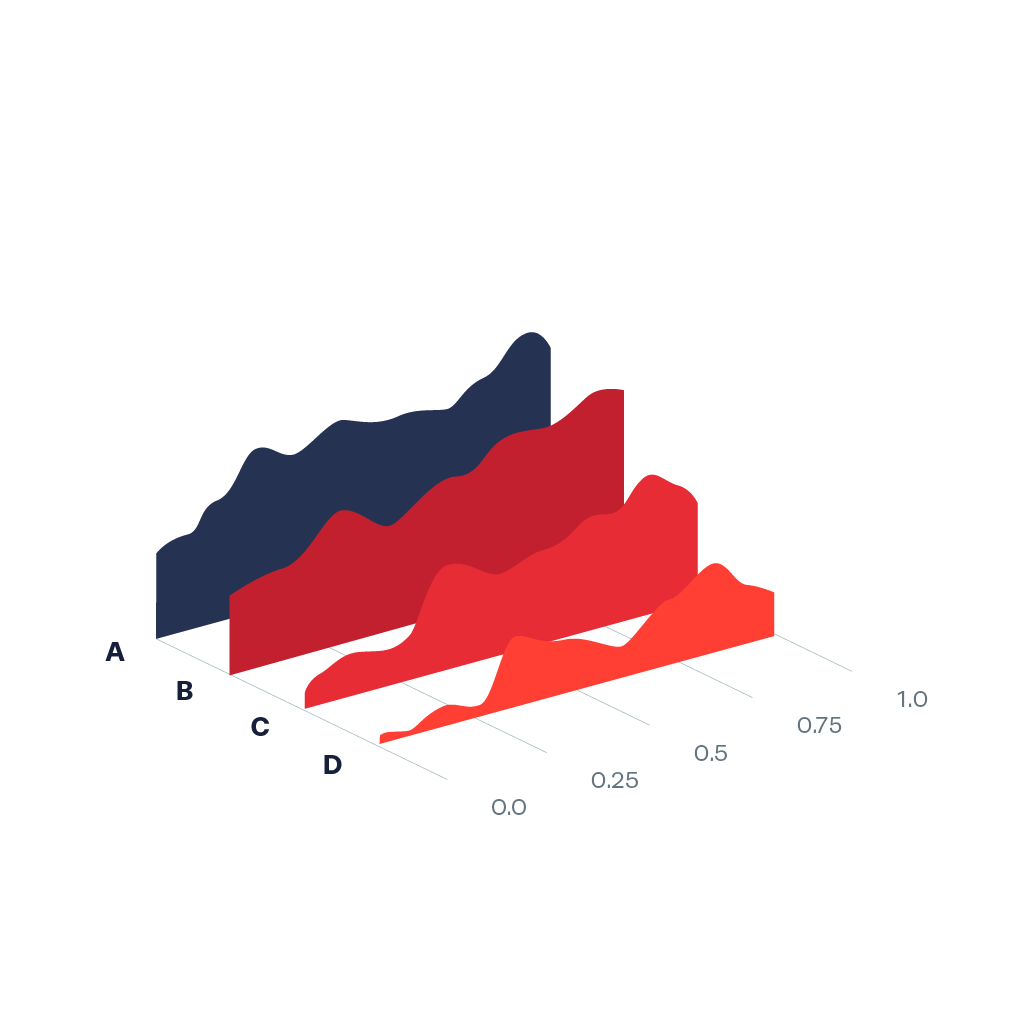
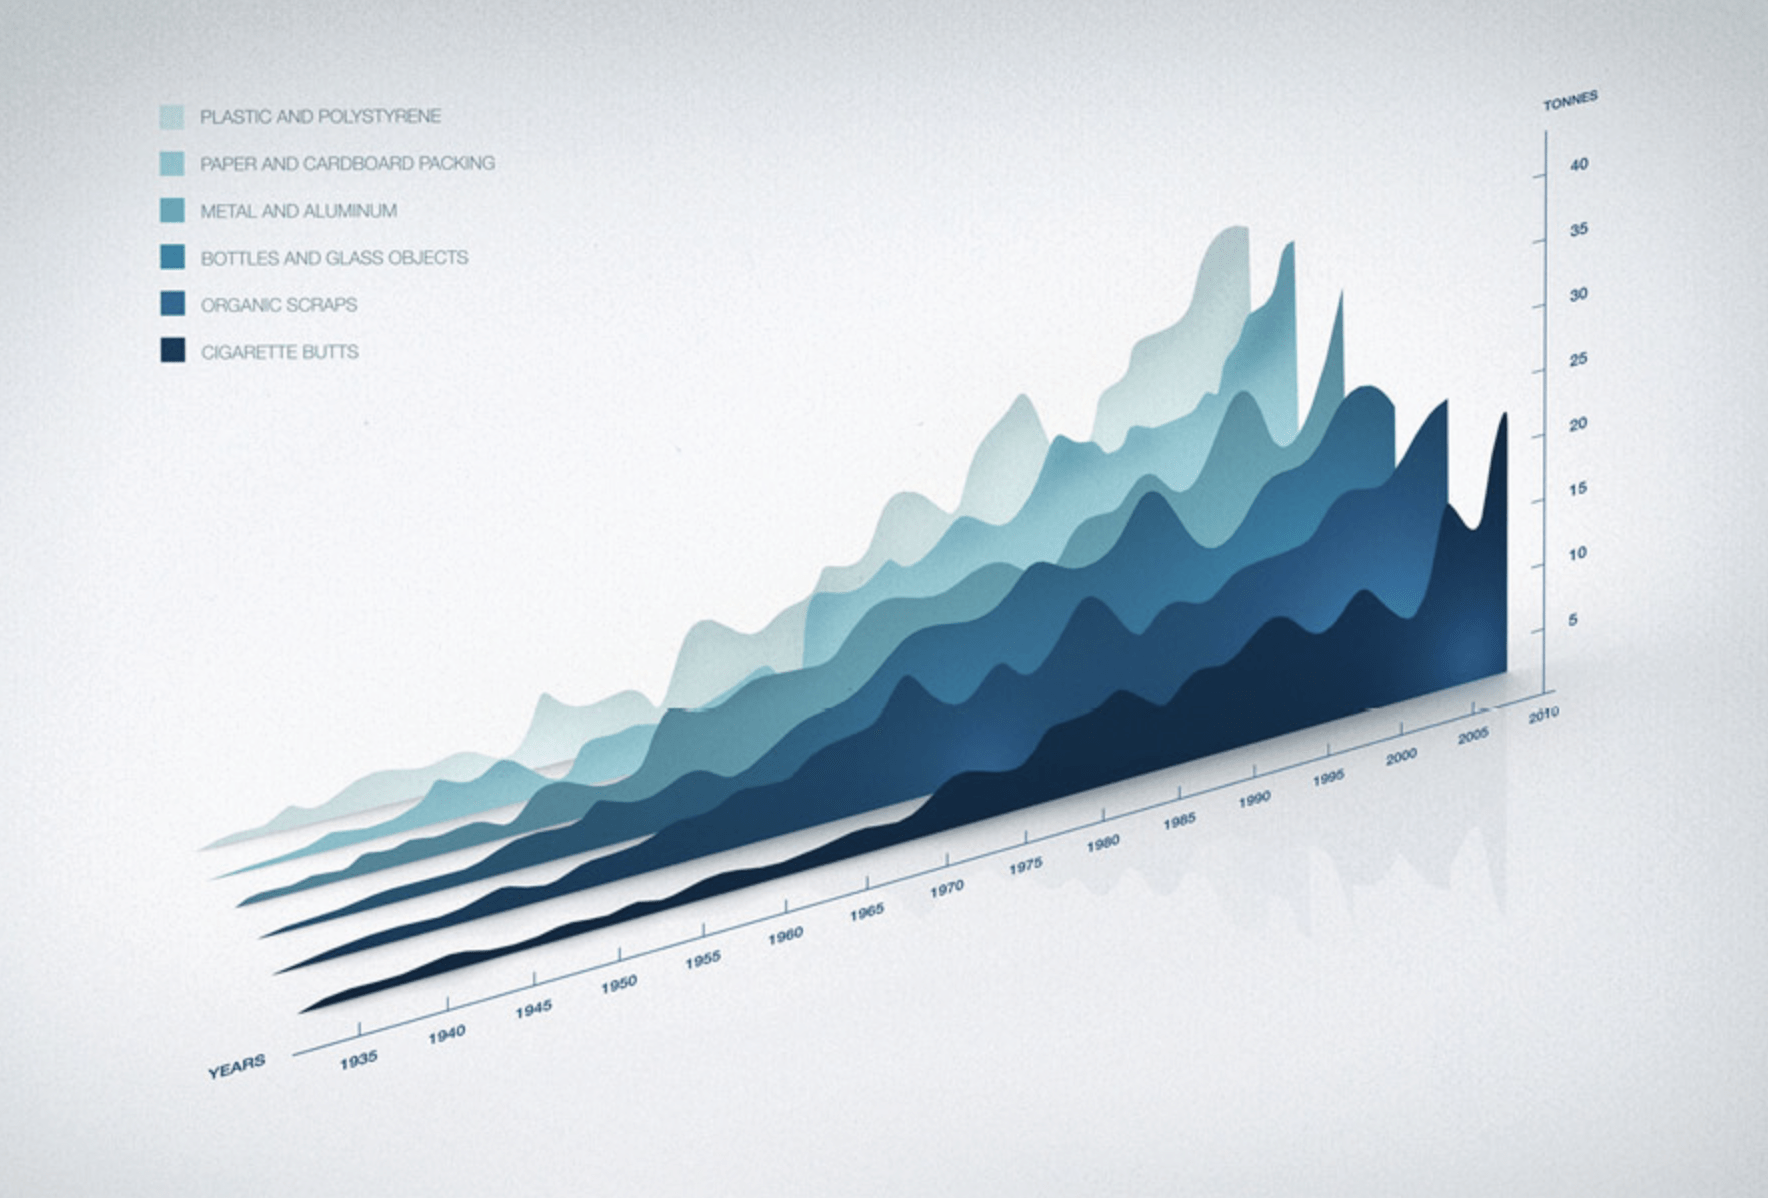
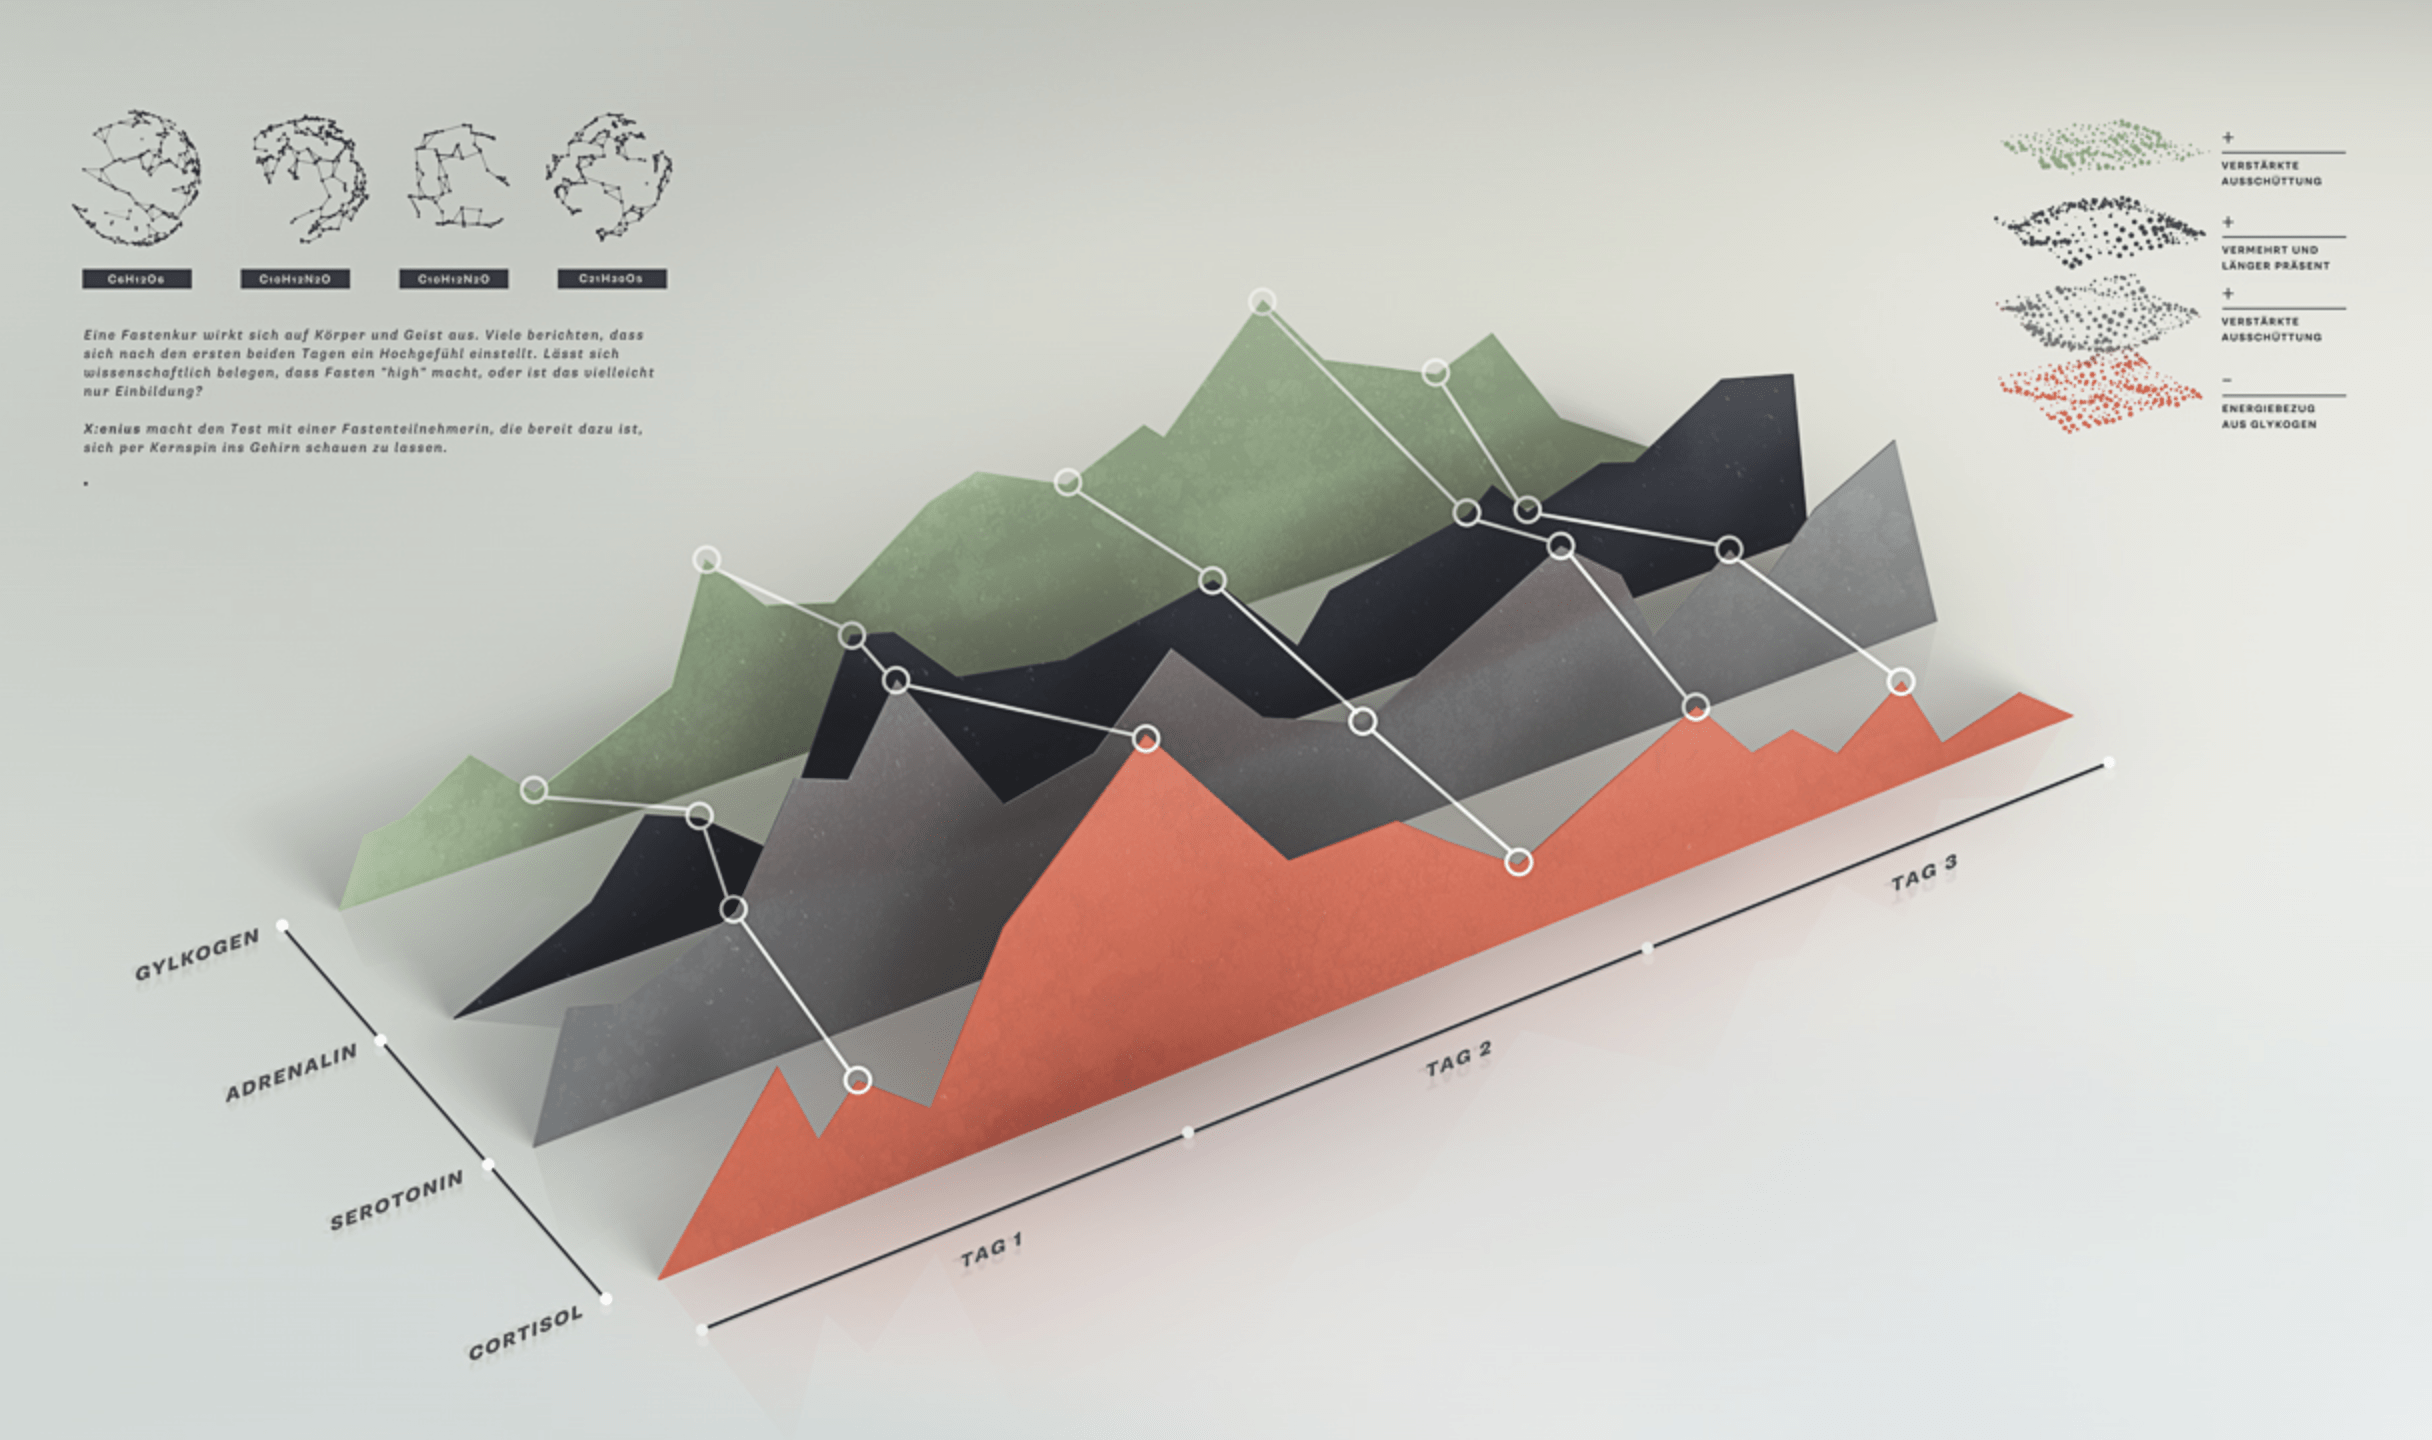
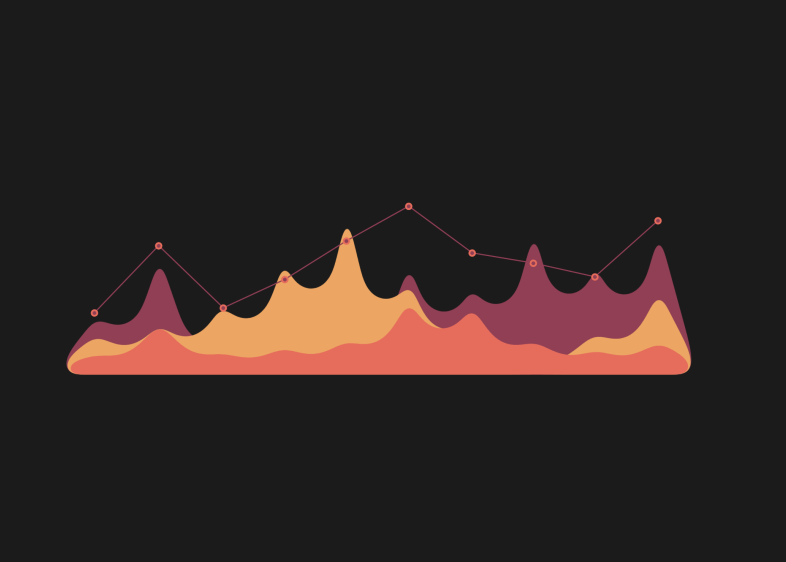
Layered area chart is basically multiple area charts layered by either making use of transparency or perspective. It can be used instead of a line graph with multiple graphs to compare development or trend over time.
The visualization may cause some issues in readability when overlapping.