Error Bars
Also called: Scatter Plot with Error Bars

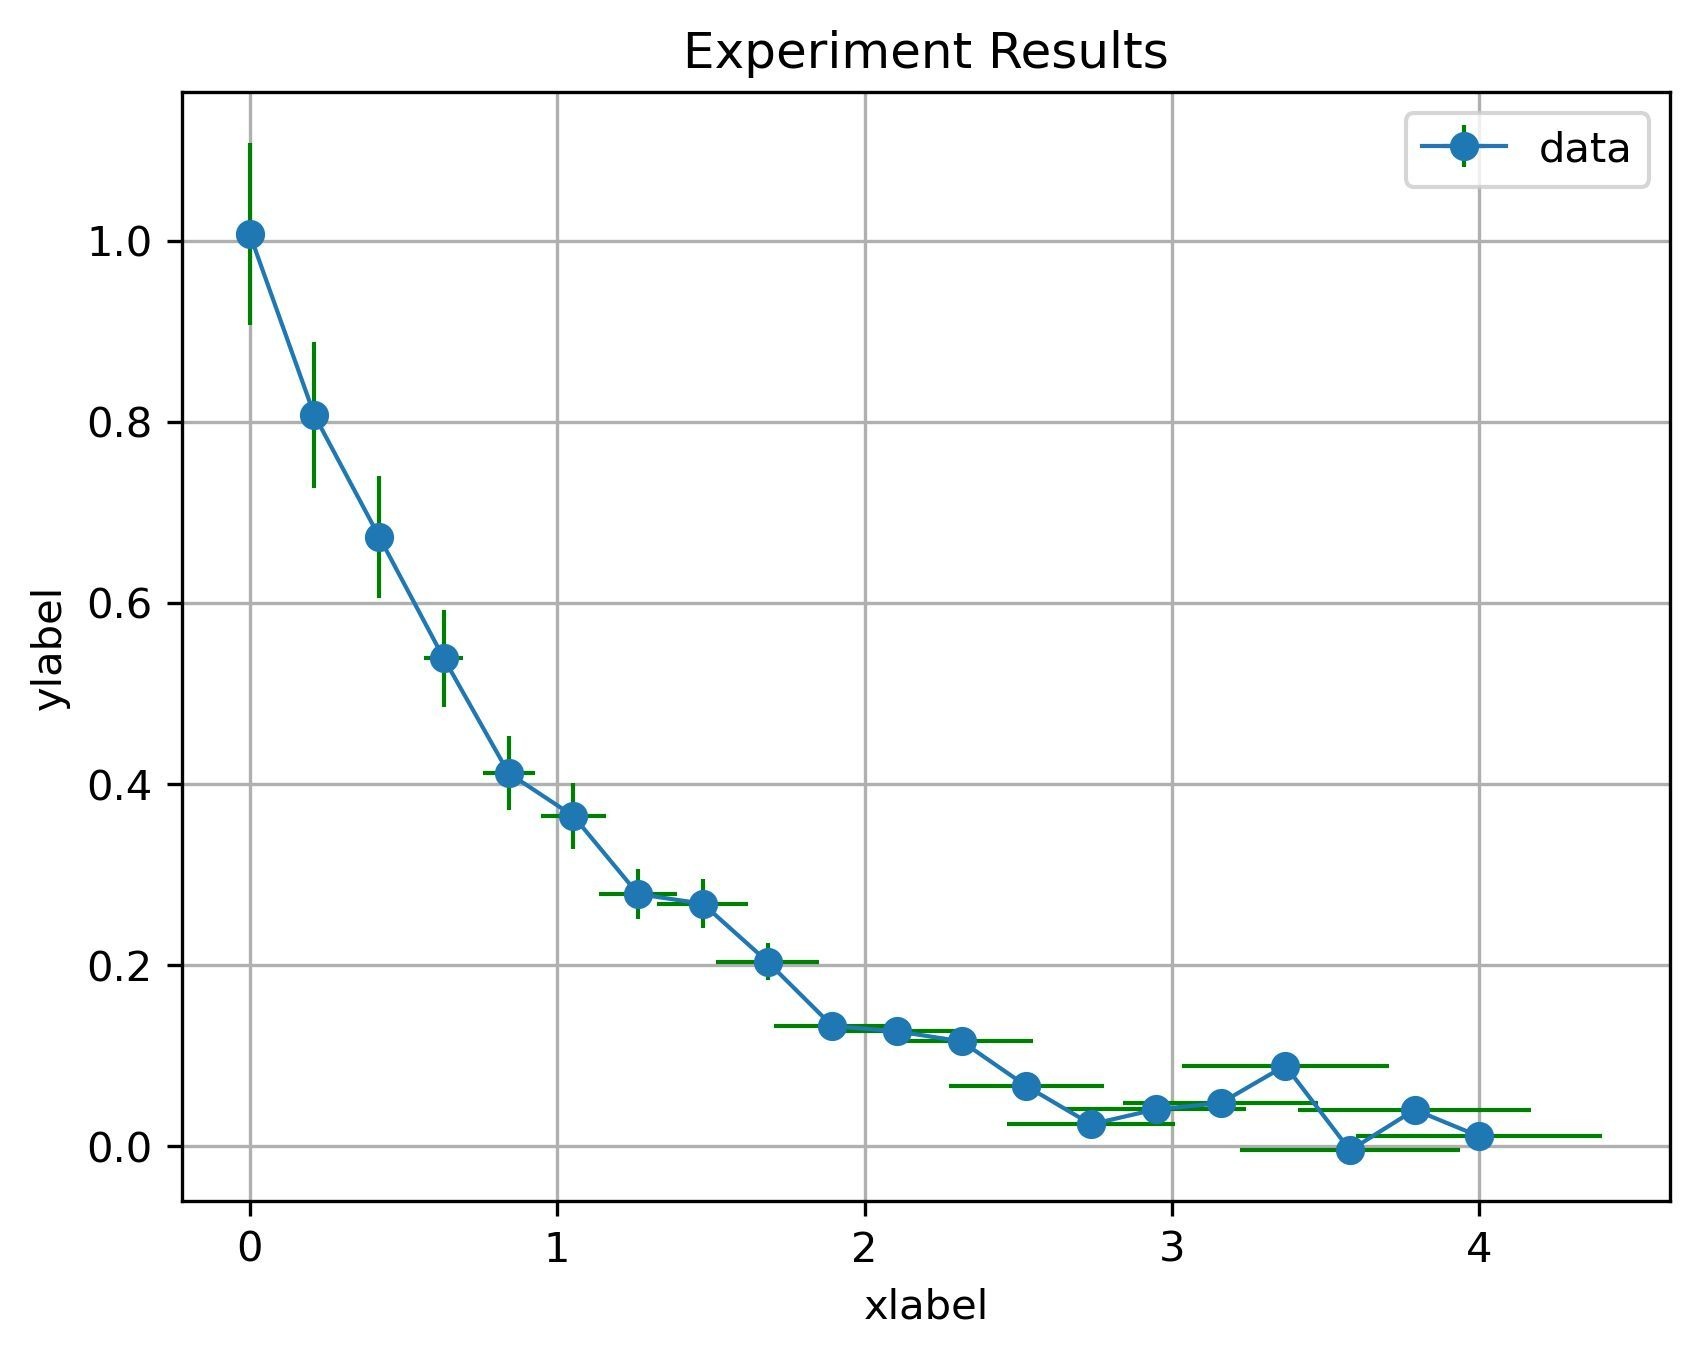
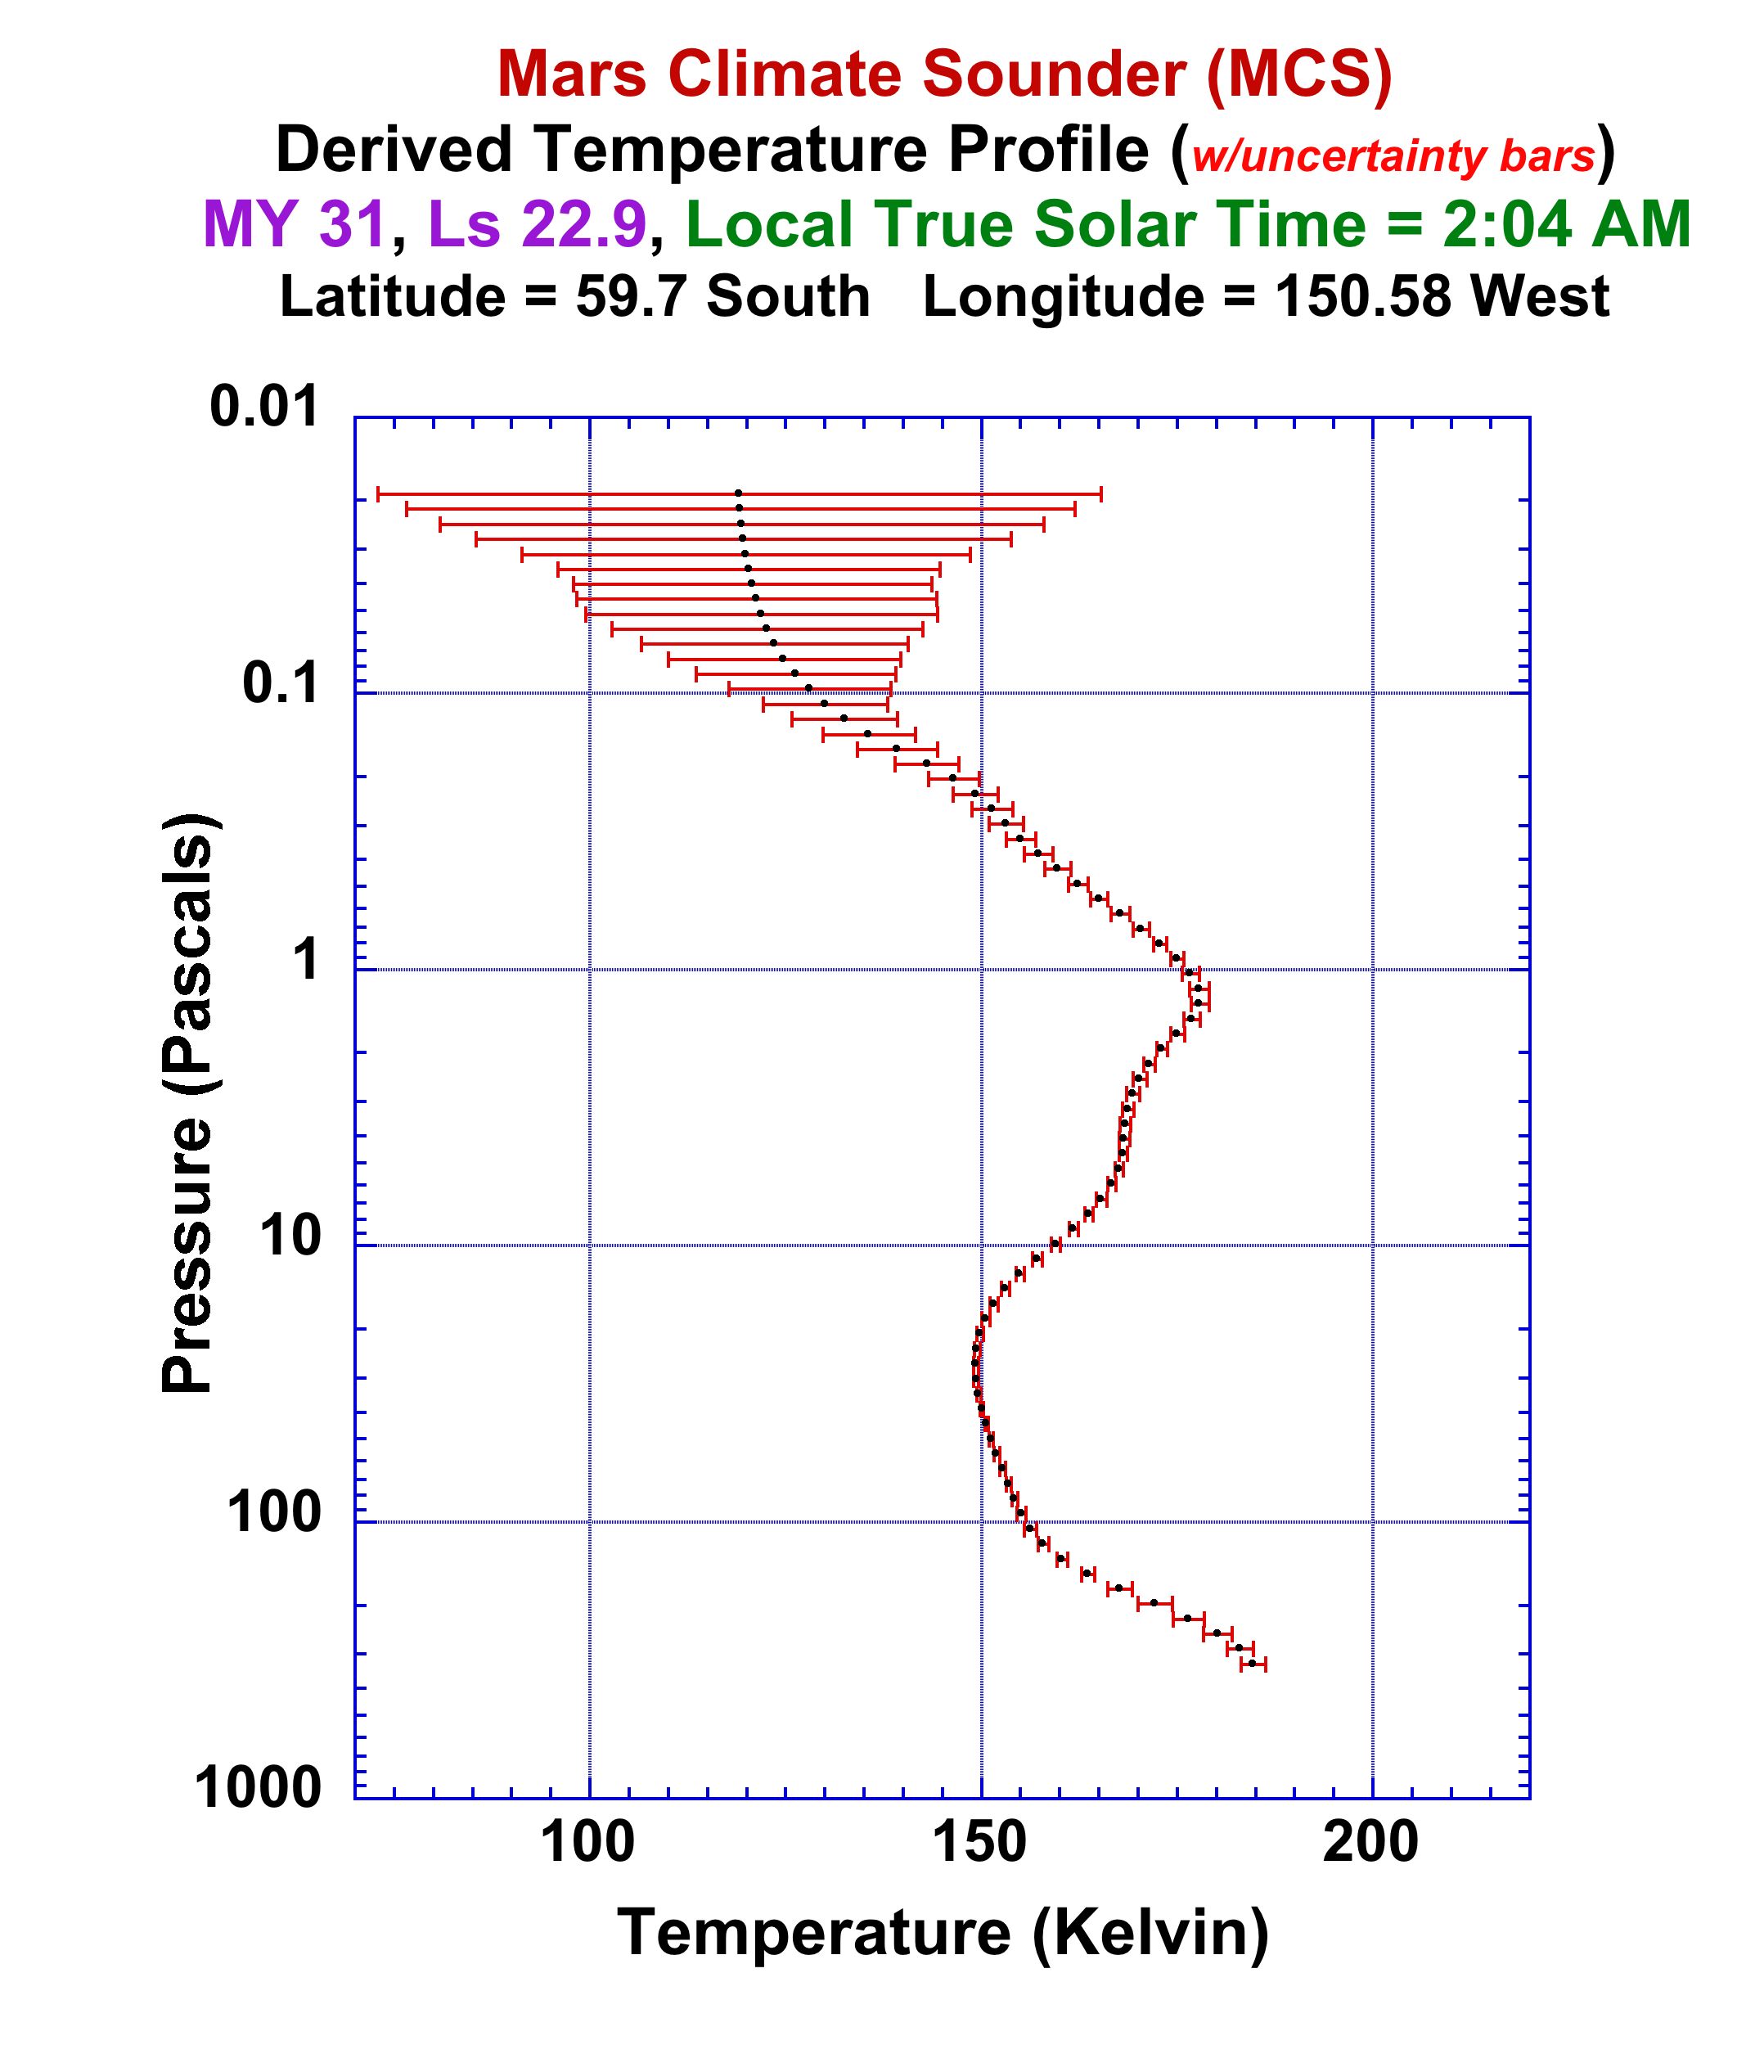
Error plots give a general idea of how precise a measurement is, or conversely, how far from the reported value the error free value might be, making the plot much more complete in terms of information. The bars could be placed both vertically and horizontally if needed. Error bars can be also added to line charts, dot charts or similar.