Dot Density Map
Also called: Dot distribution map
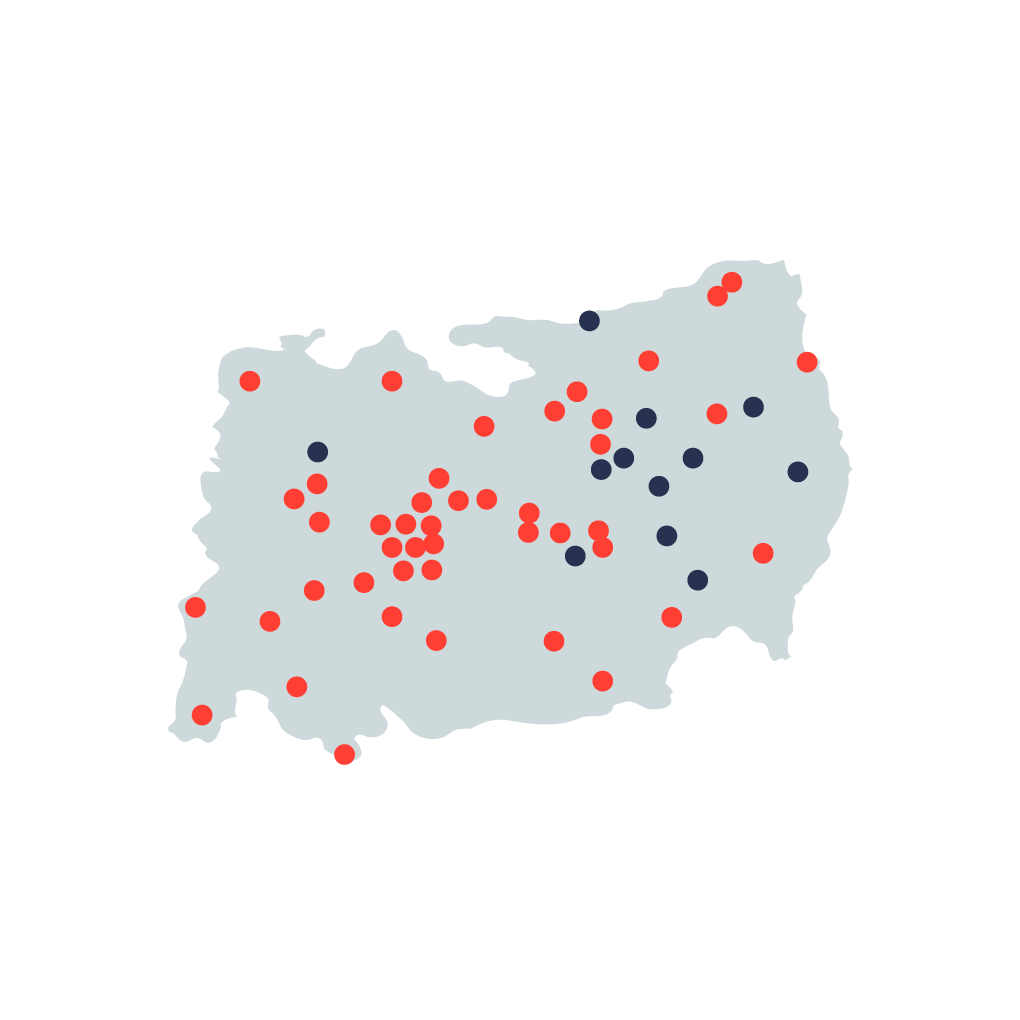
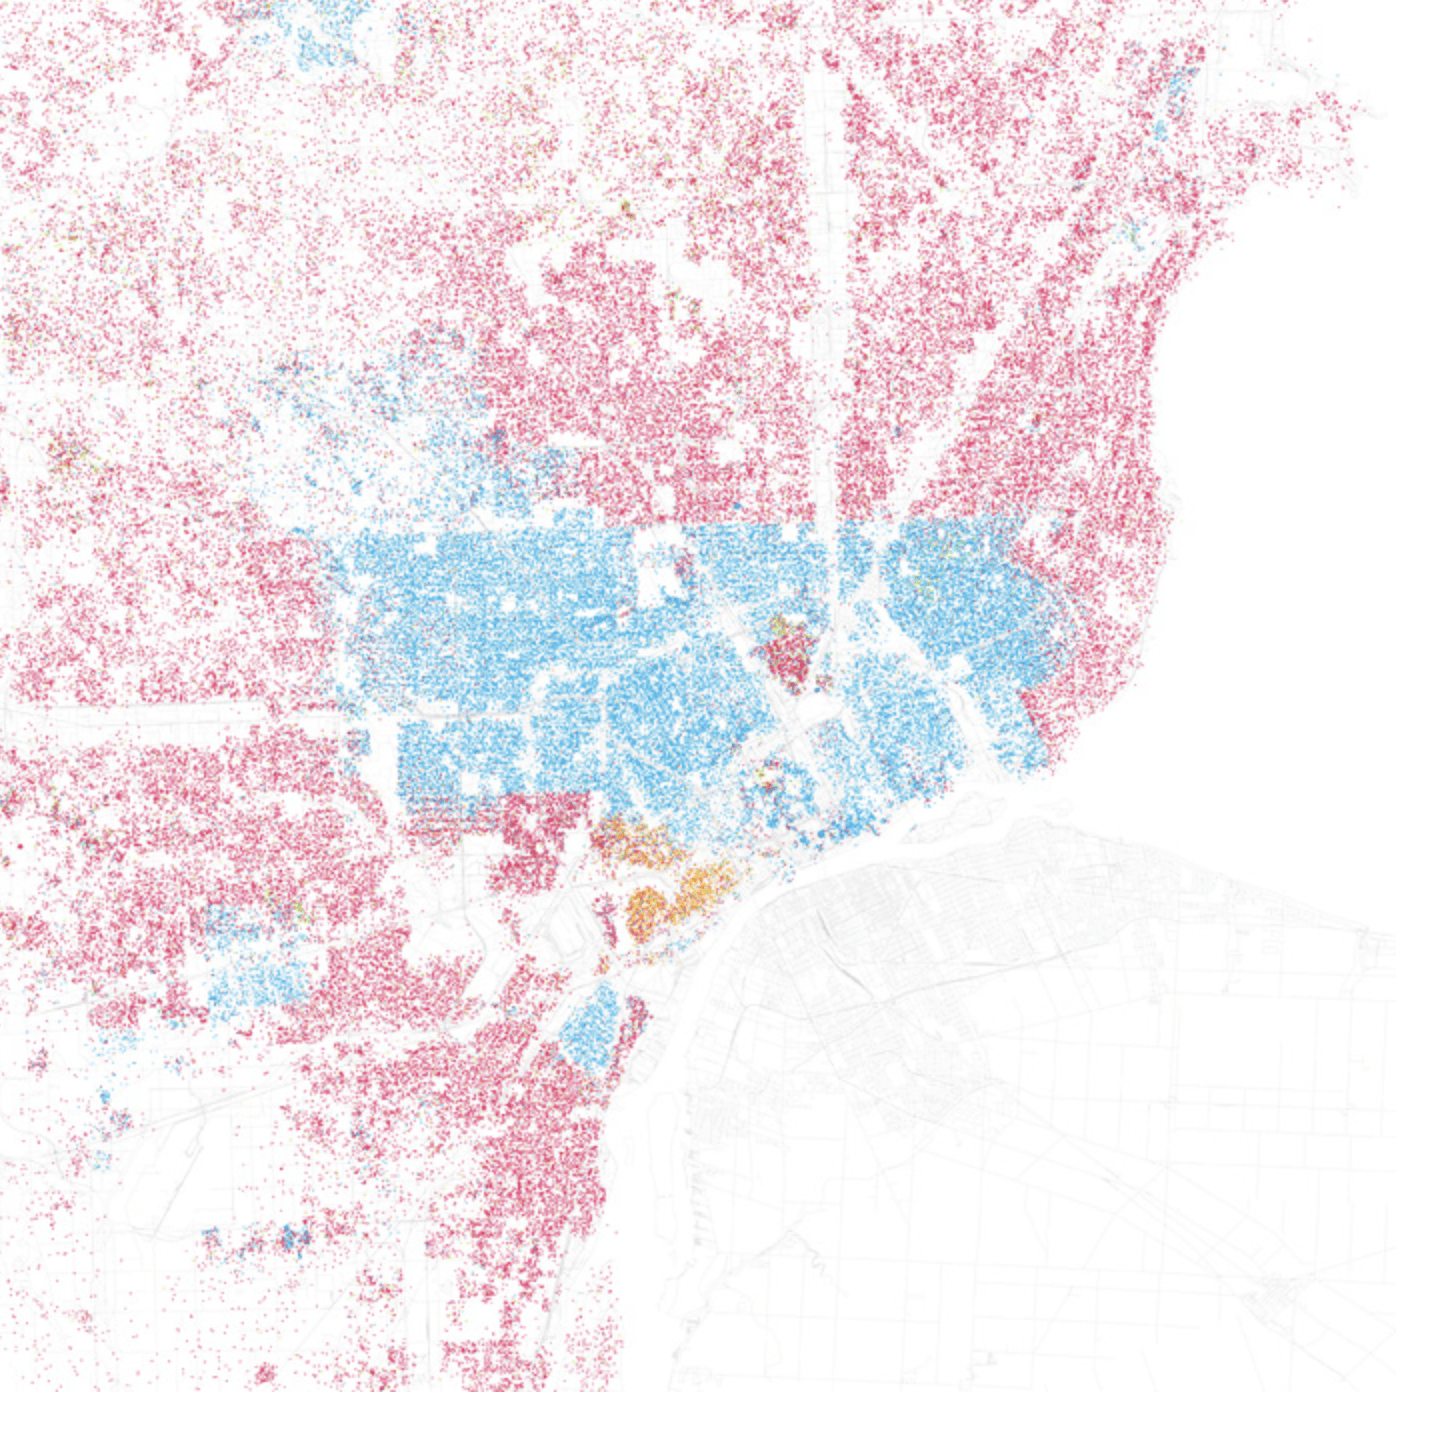
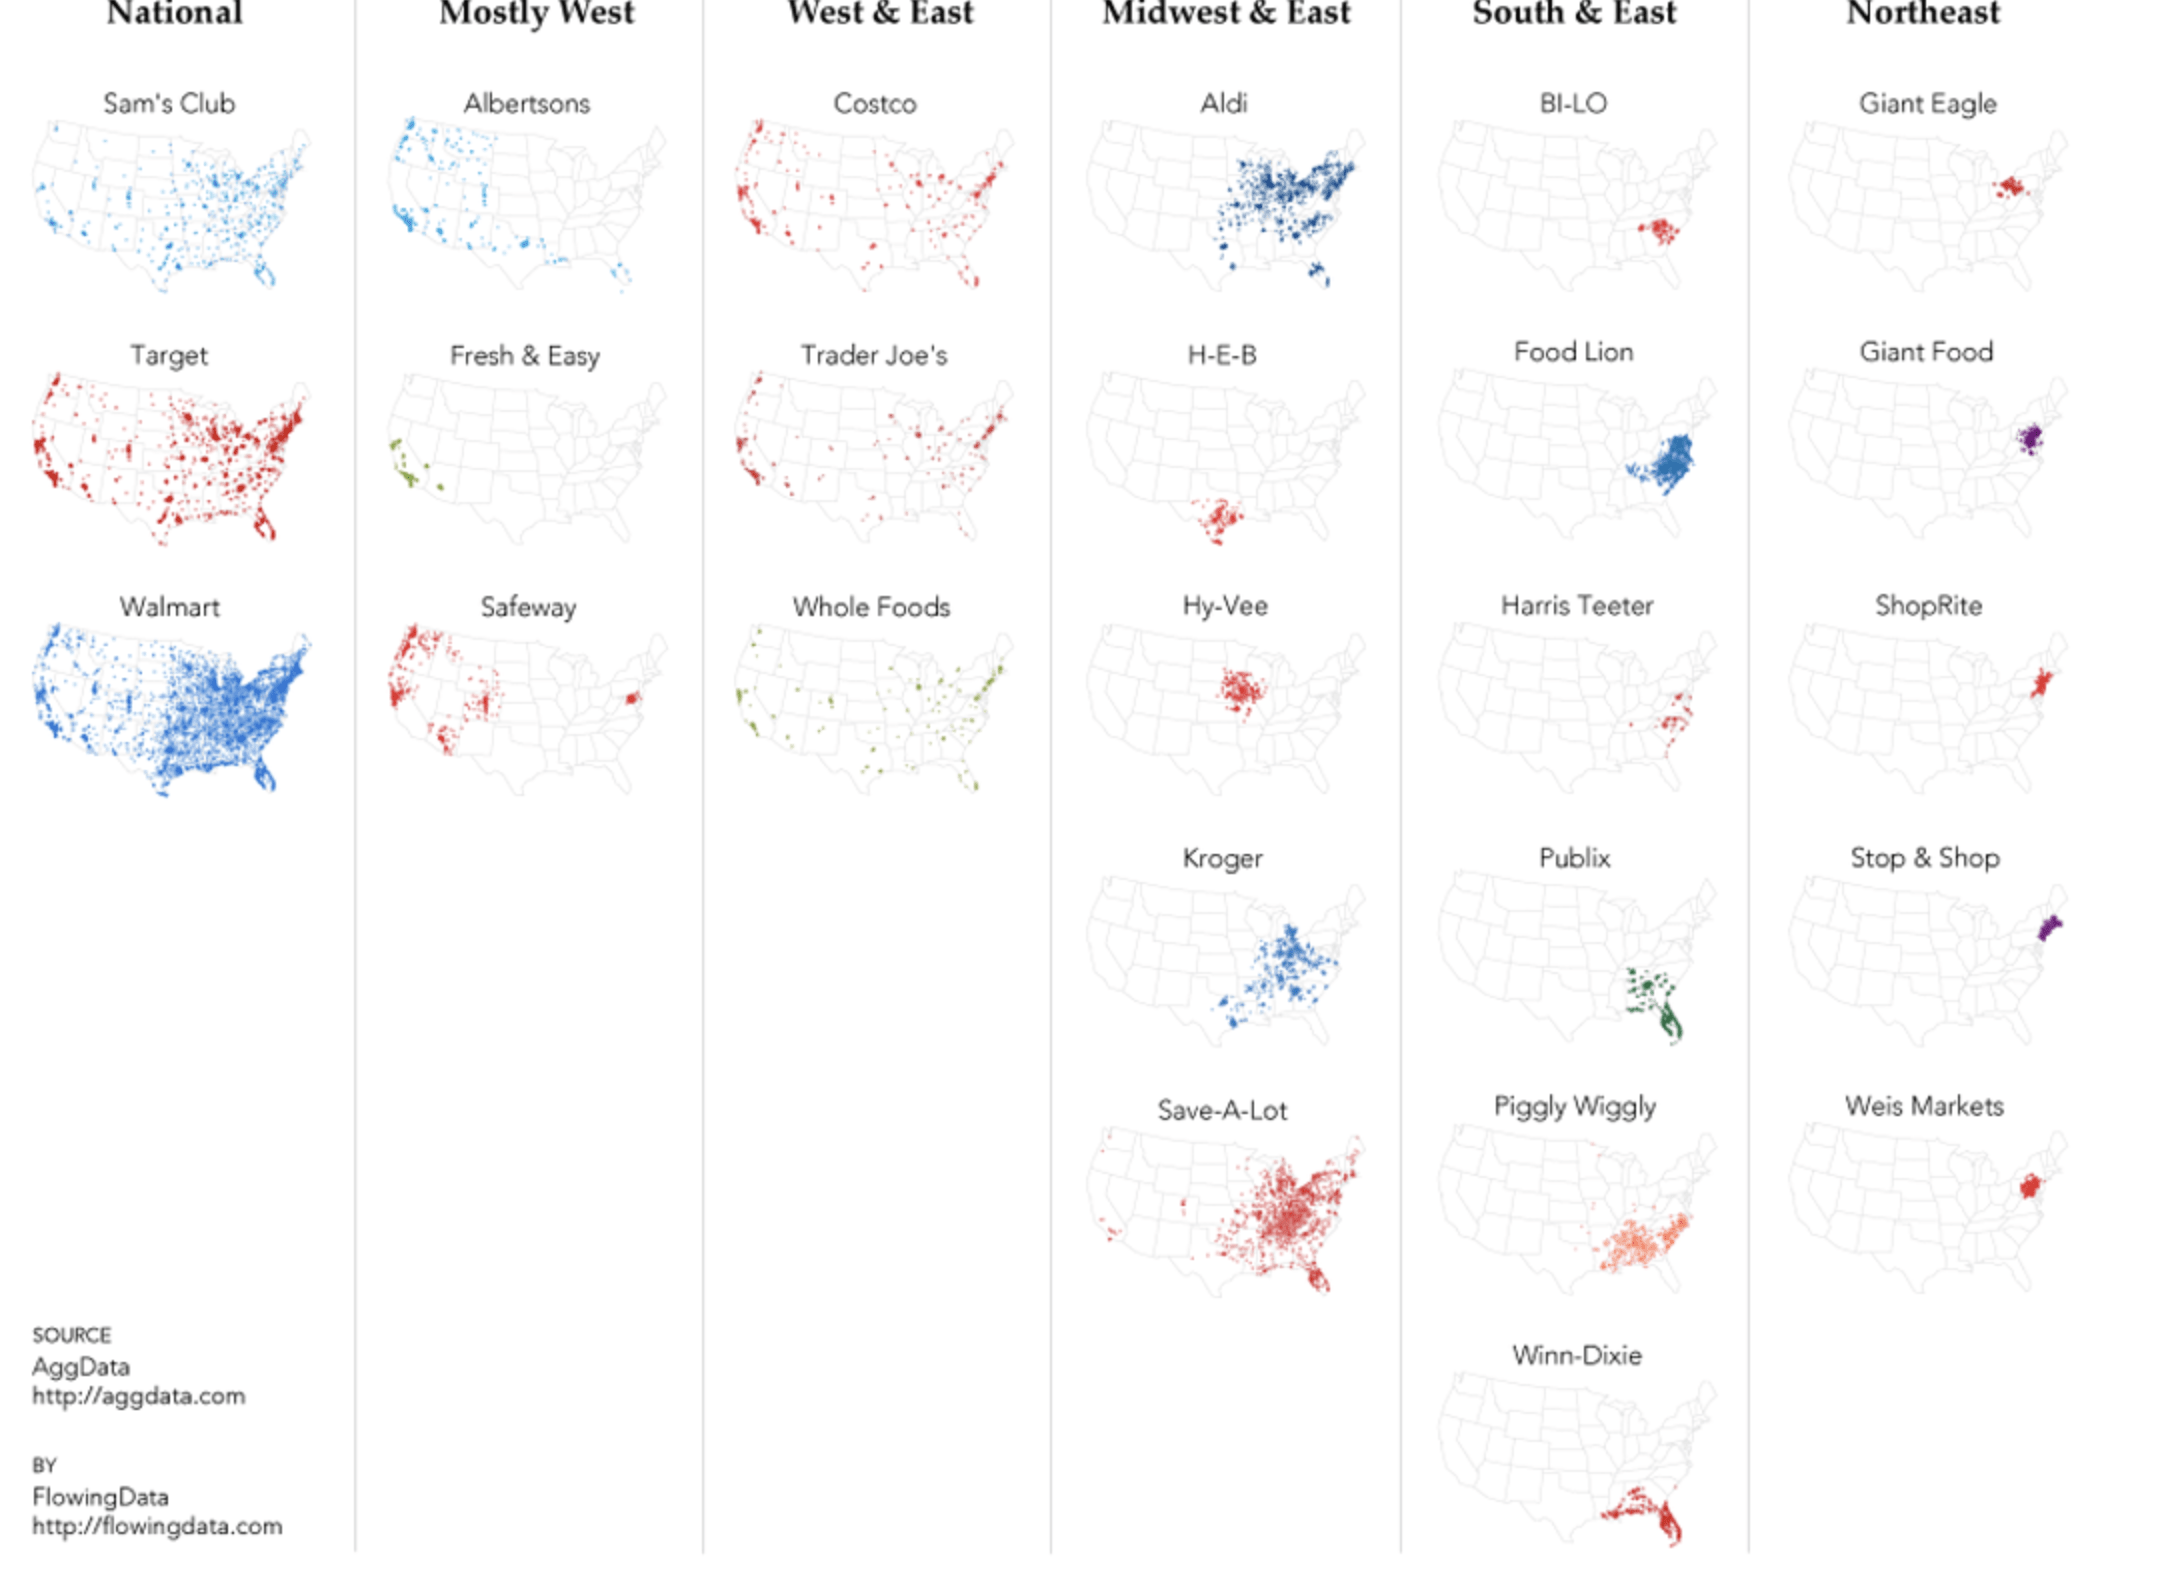
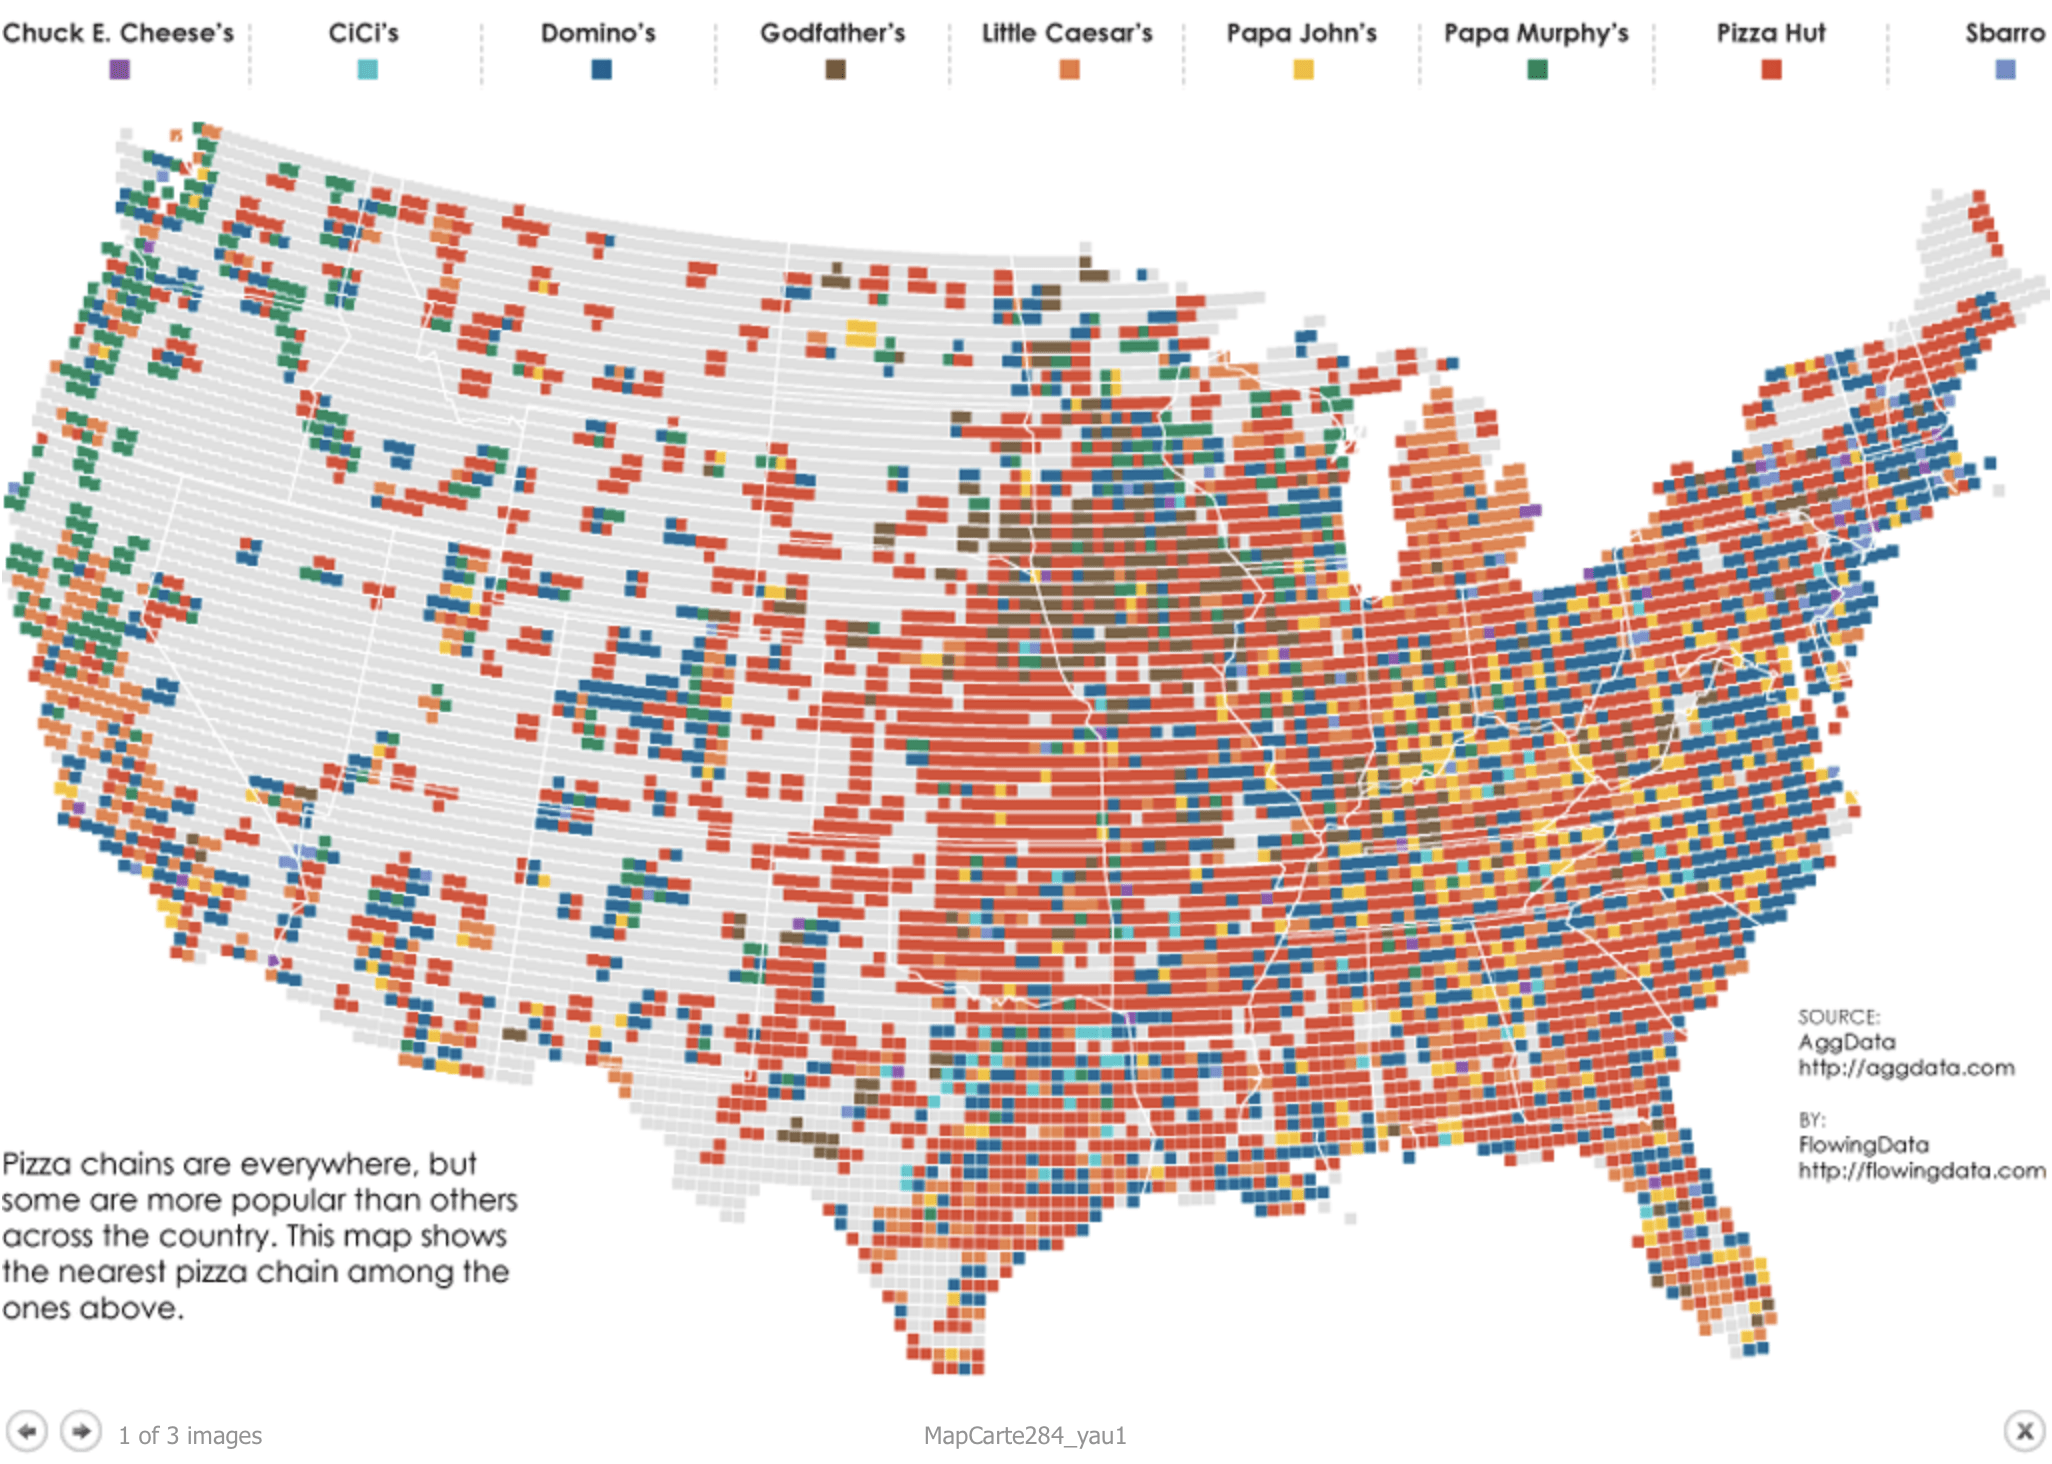
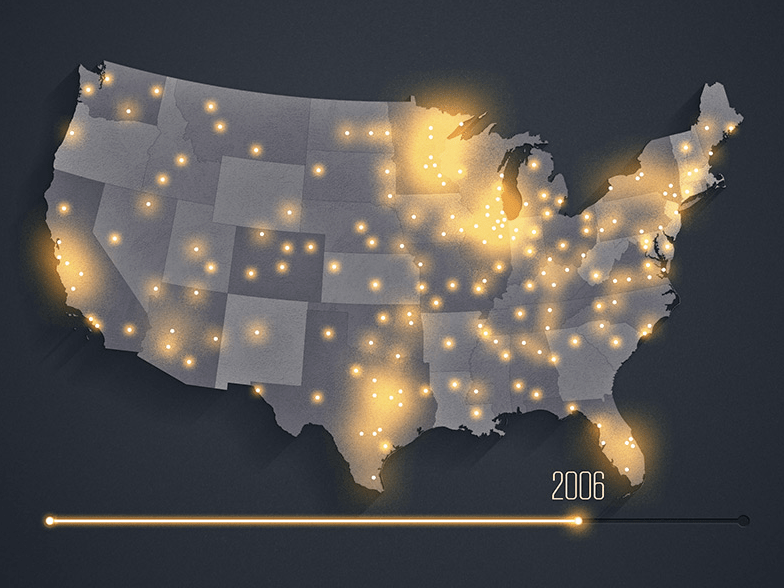
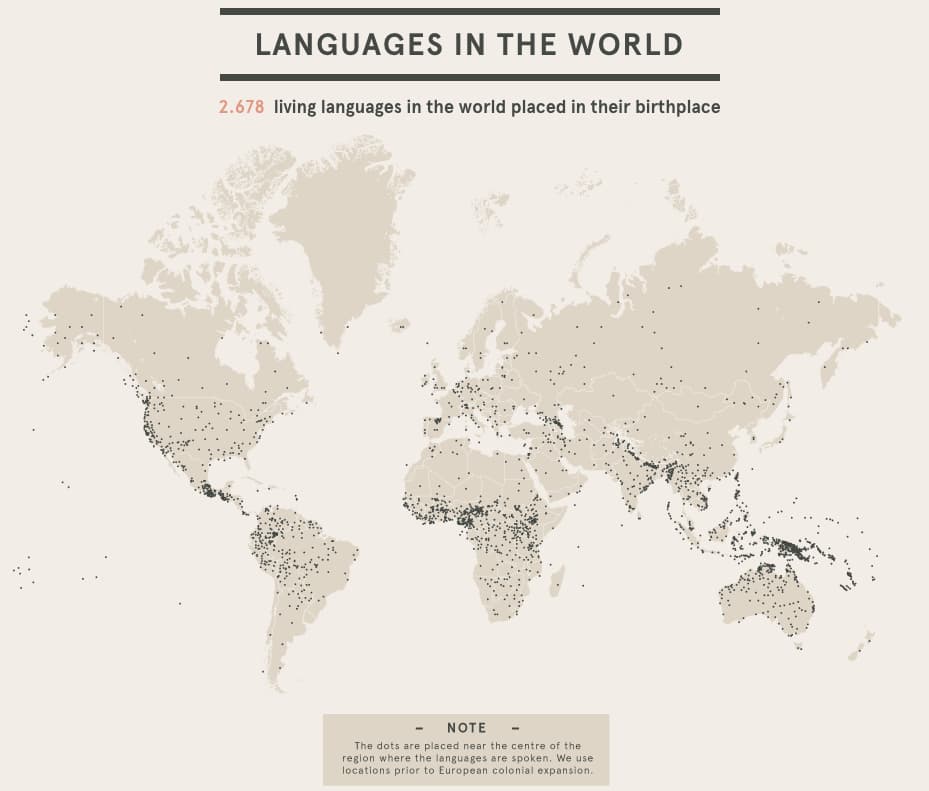
A dot density map is a map type that uses a dot or another symbol to show the presence of a feature or phenomenon.
In a dot density map, areas with many dots indicate high concentrations of values for the chosen field and fewer dots indicate lower concentrations.
Each dot on a dot-density map can either represent one single recording of a phenomenon (one-to-one) or represent a given quantity of it (one-to-many).