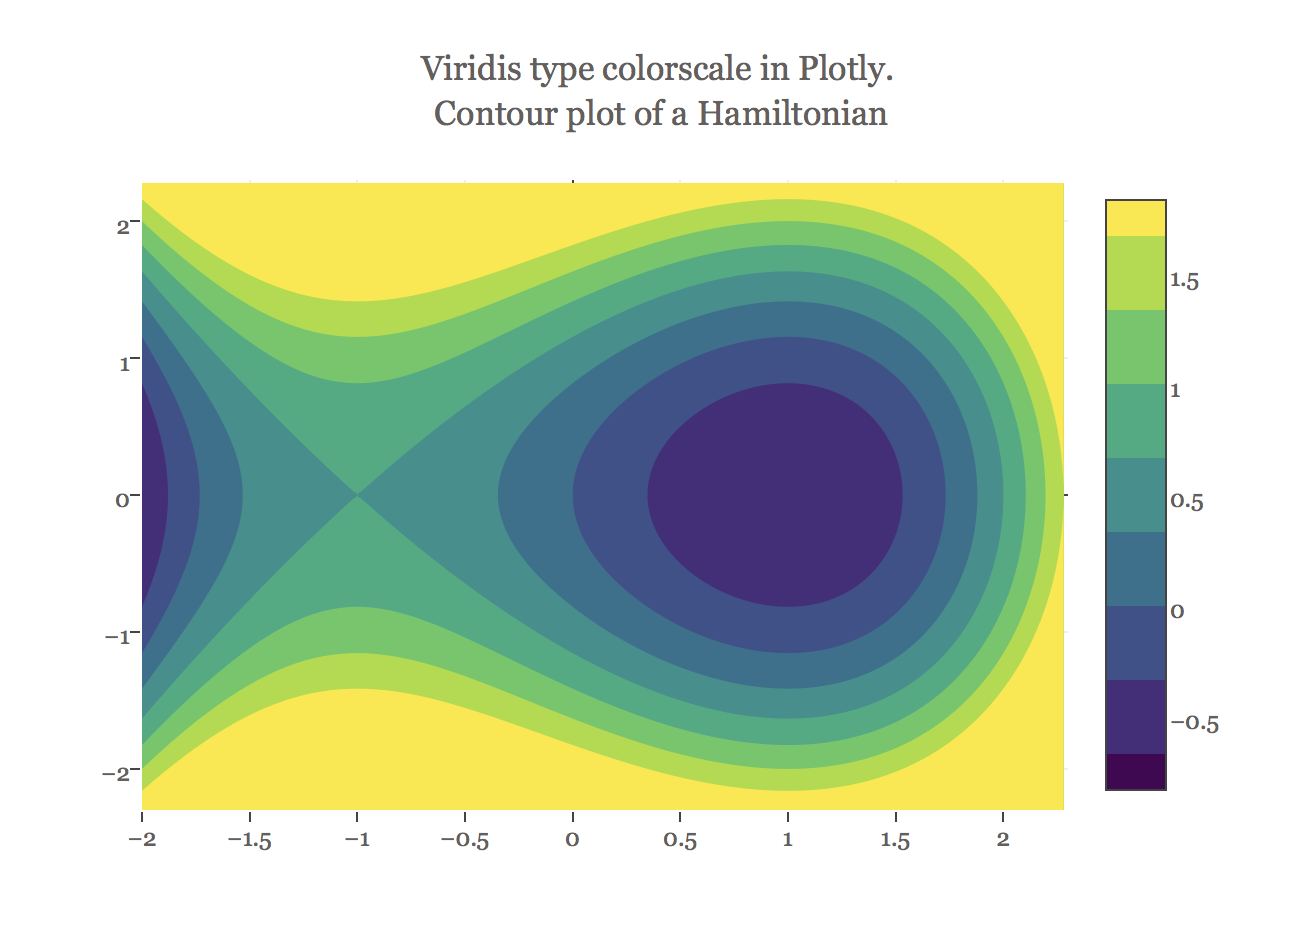
Contour Plot

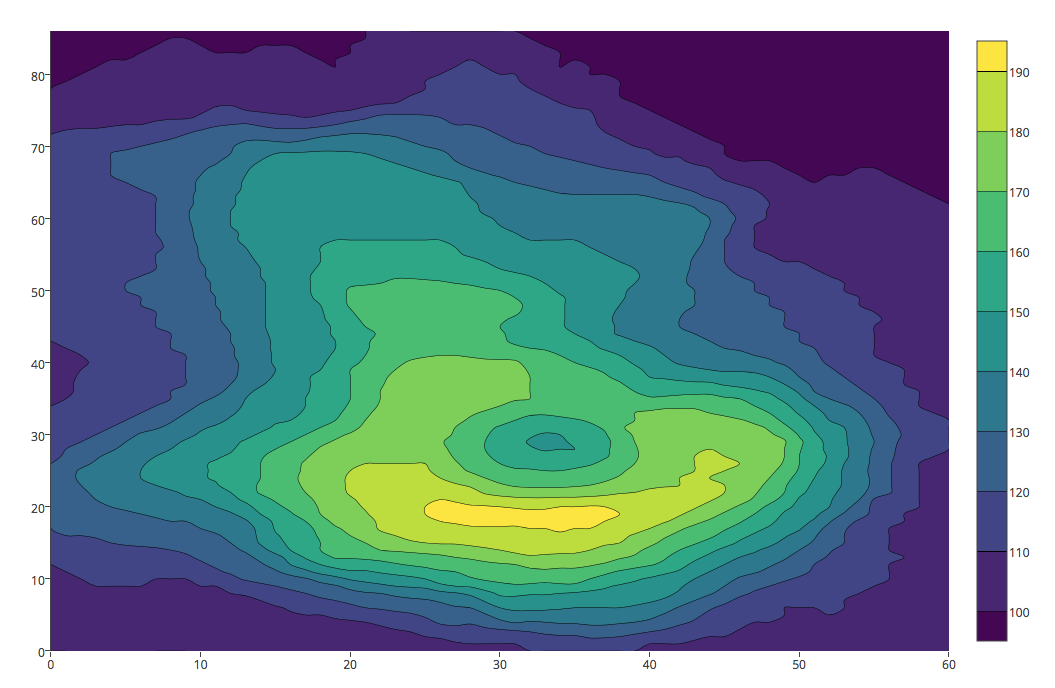
A Contour Plot is a graphic representation of the relationships among three numeric variables in two dimensions. Two variables are for X and Y axes, and a third variable Z is for contour levels. The contour levels are plotted as curves; the area between curves can be color coded to indicate interpolated values.
The contour plot is an alternative to a 3-D surface plot.