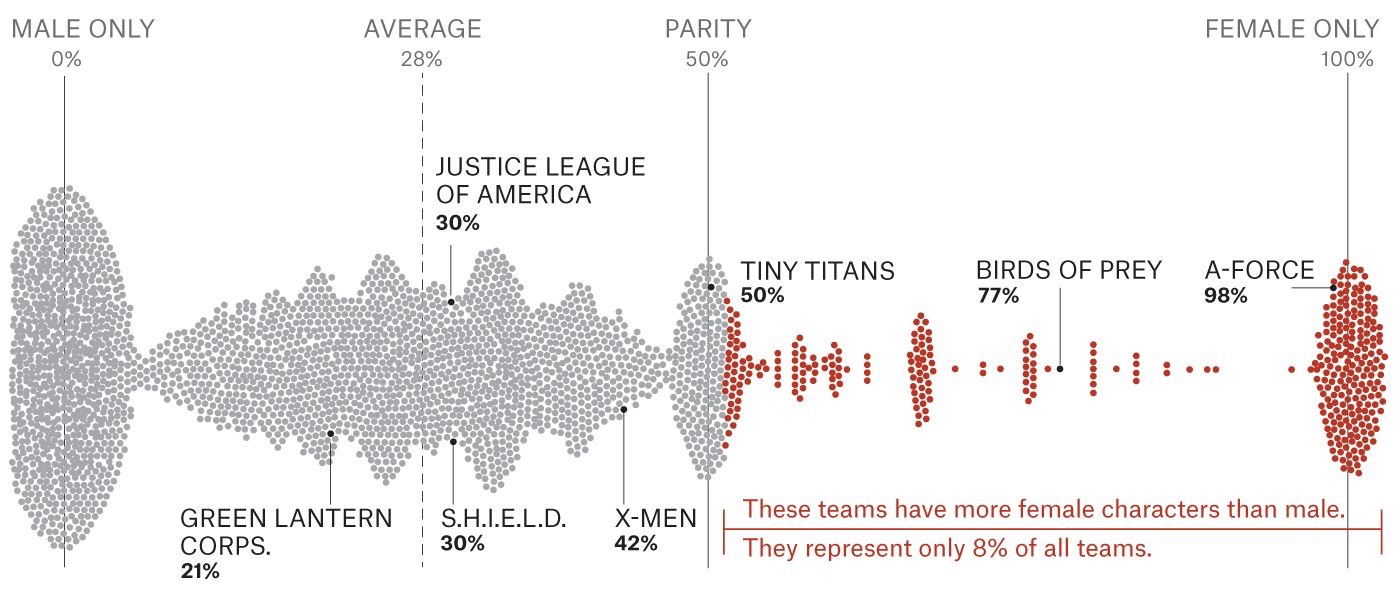
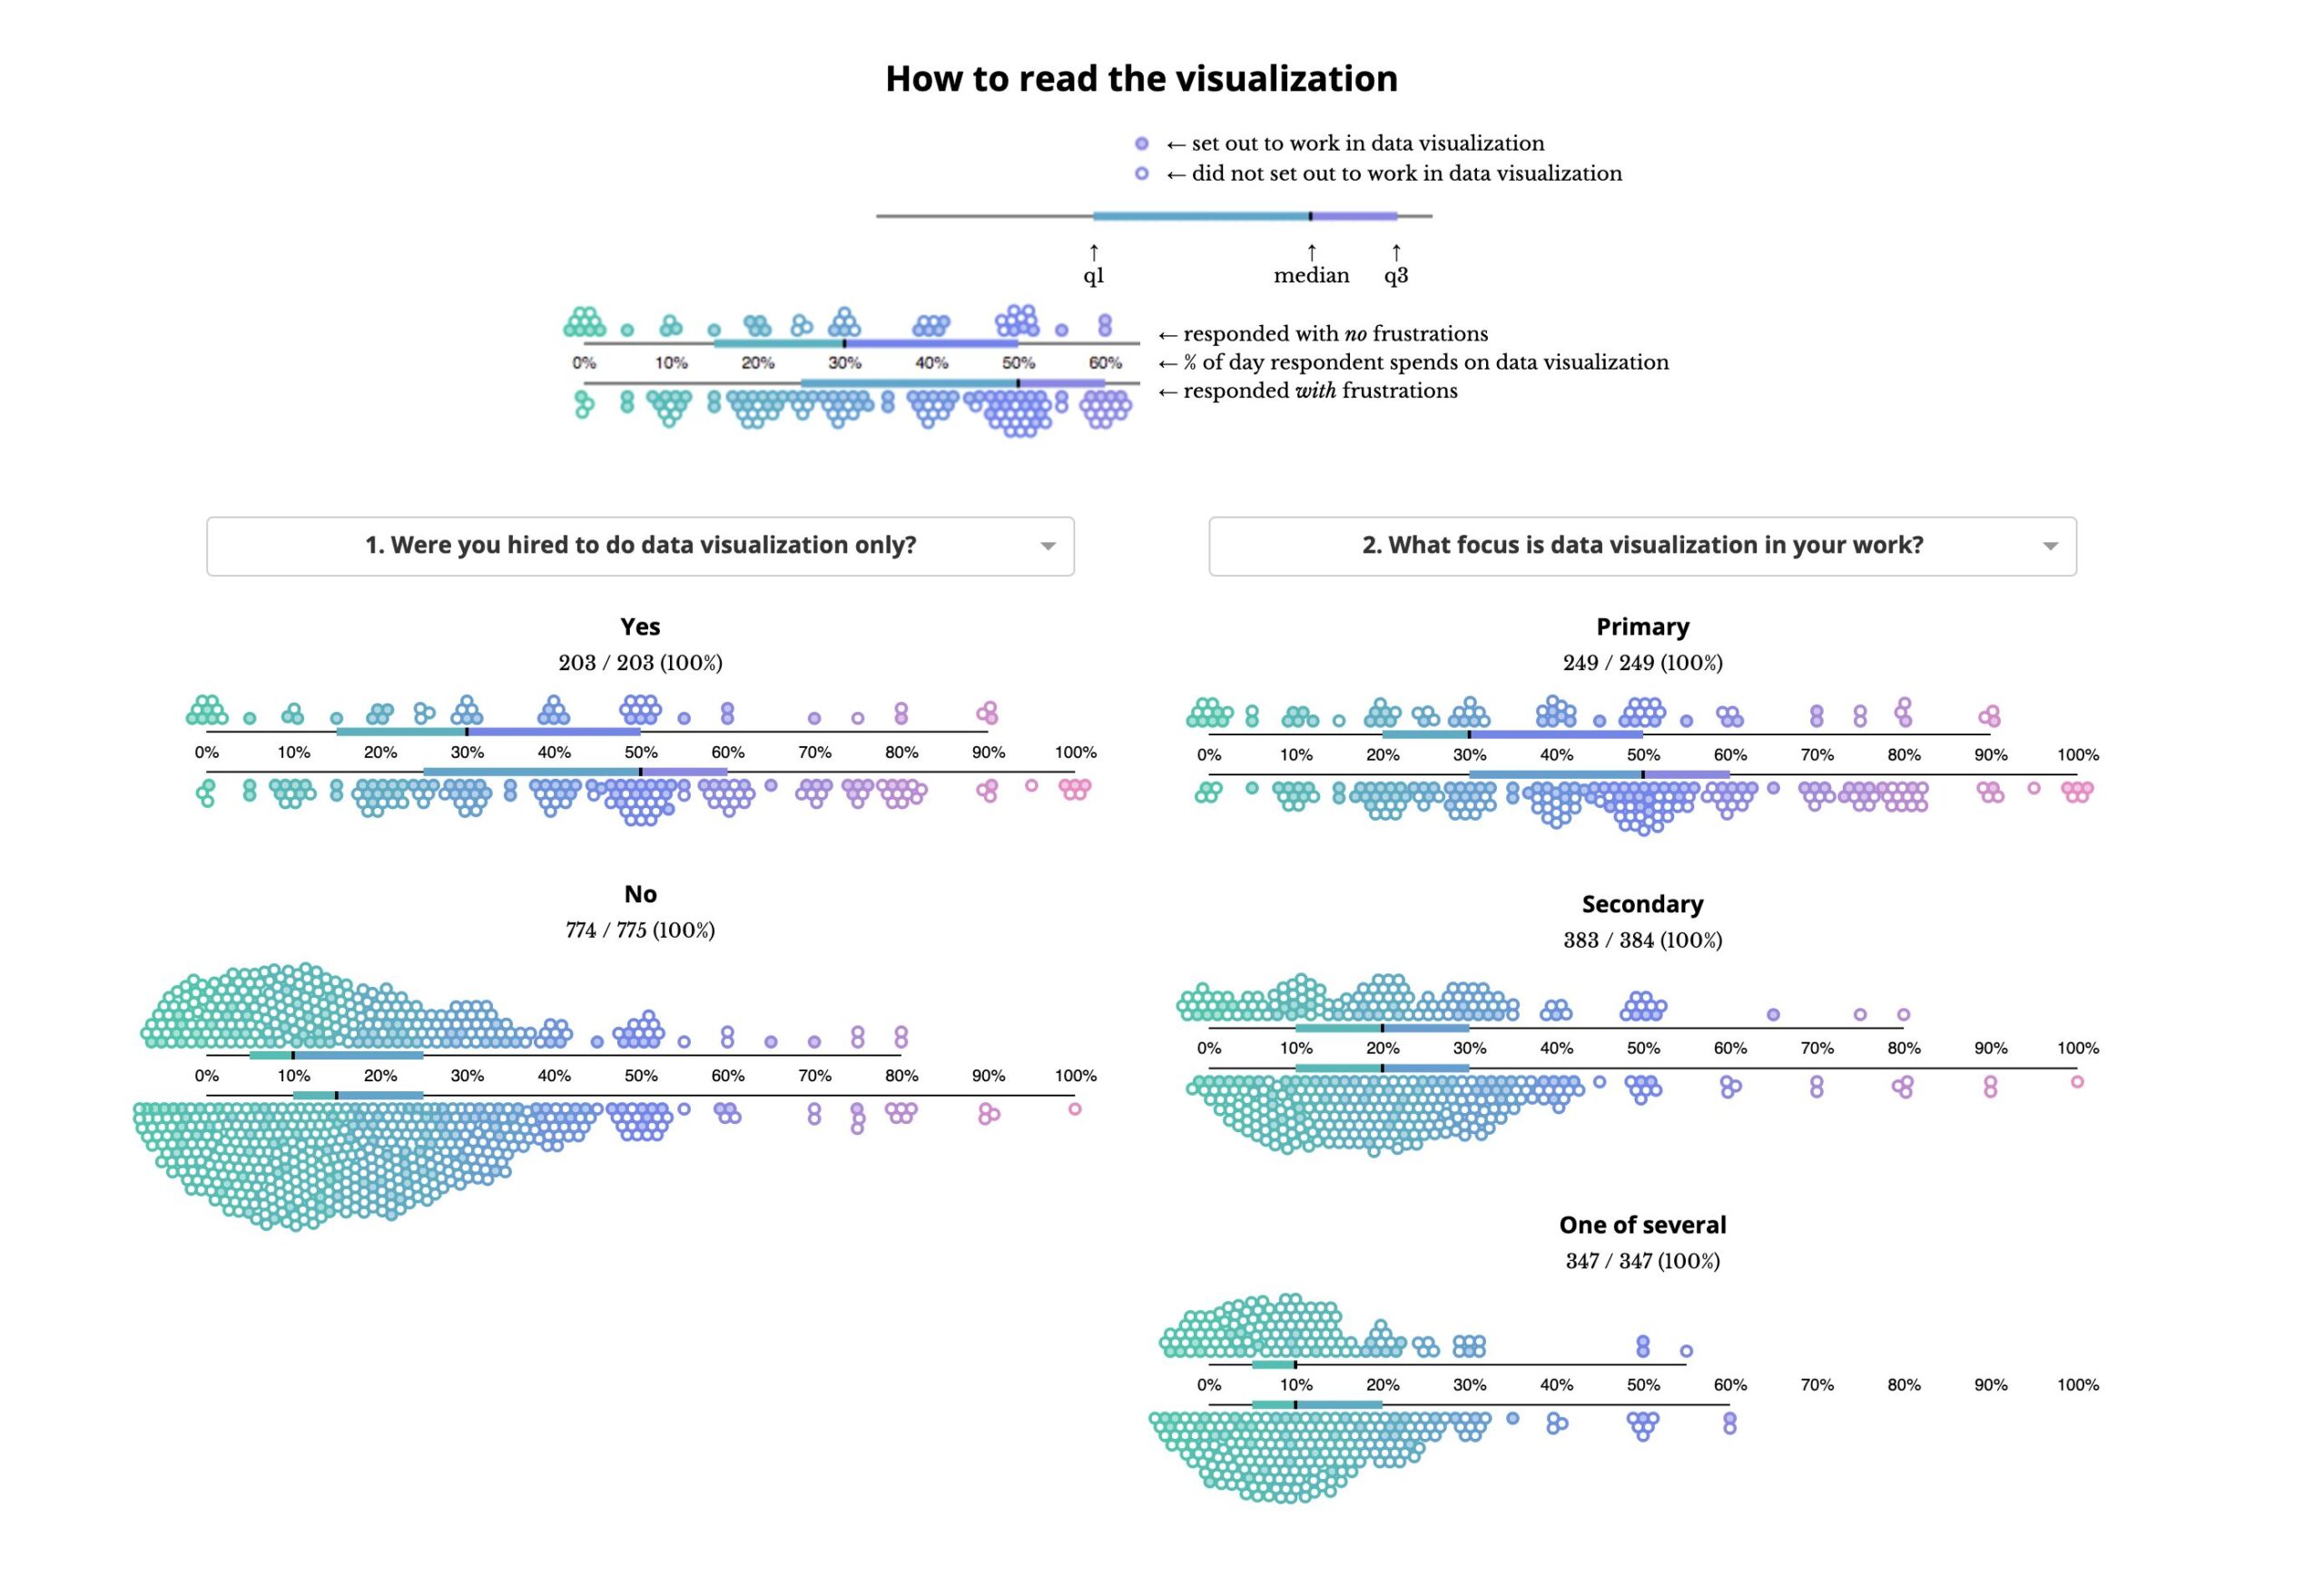
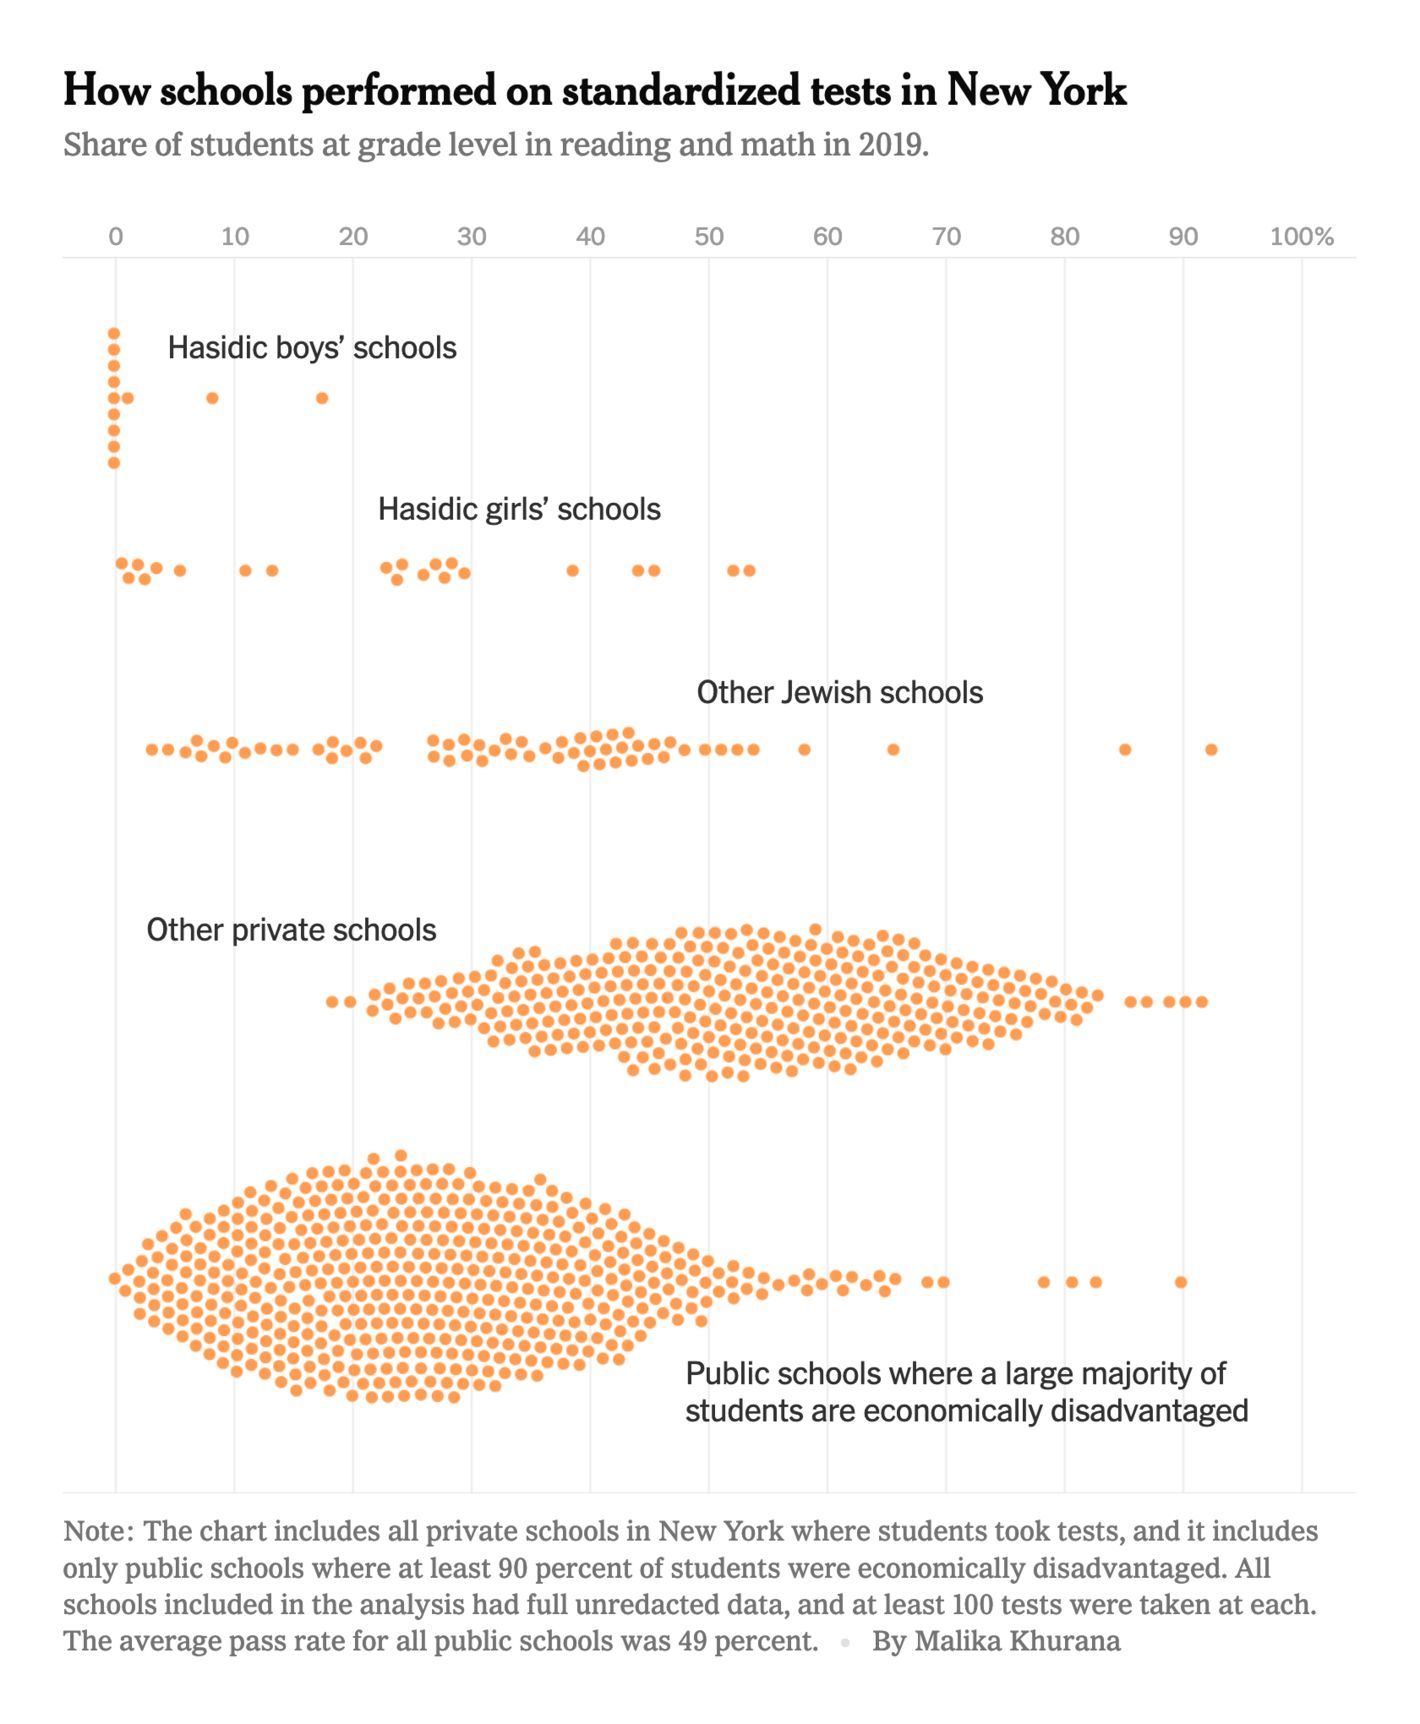
Beeswarm Plot

A beeswarm plot is a type of graph that visualizes the distribution of a dataset, plotting the values along one axis. In contrast to a jitter plot, a scatter plot displays each individual data point without overlaying them, making it possible to see the distribution of the data more clearly. By varying the data points’ areas, it’s possible to show hierarchies, too.