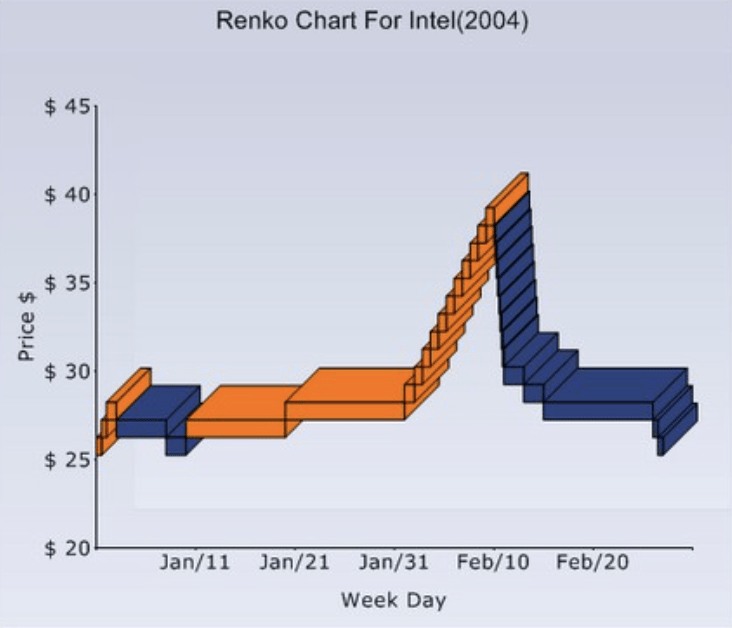
Renko Chart
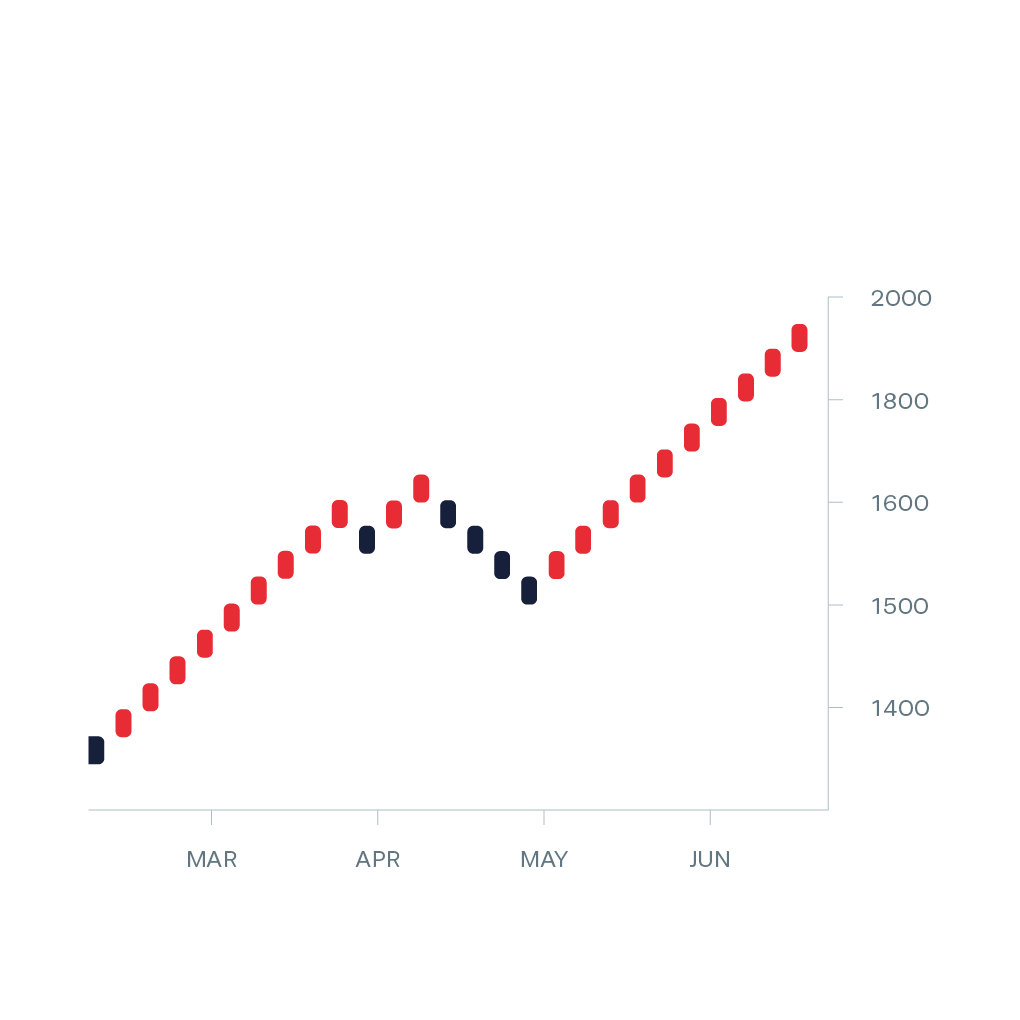
Renko charts are excellent in projecting support and resistance levels. Bricks are drawn equal in size for a known value.A brick is drawn in the direction of the prior move but only if prices move by a minimum amount.If prices change by a predetermined amount or more, a new brick is drawn.If prices change by less than a predetermined amount, the new price is ignored.