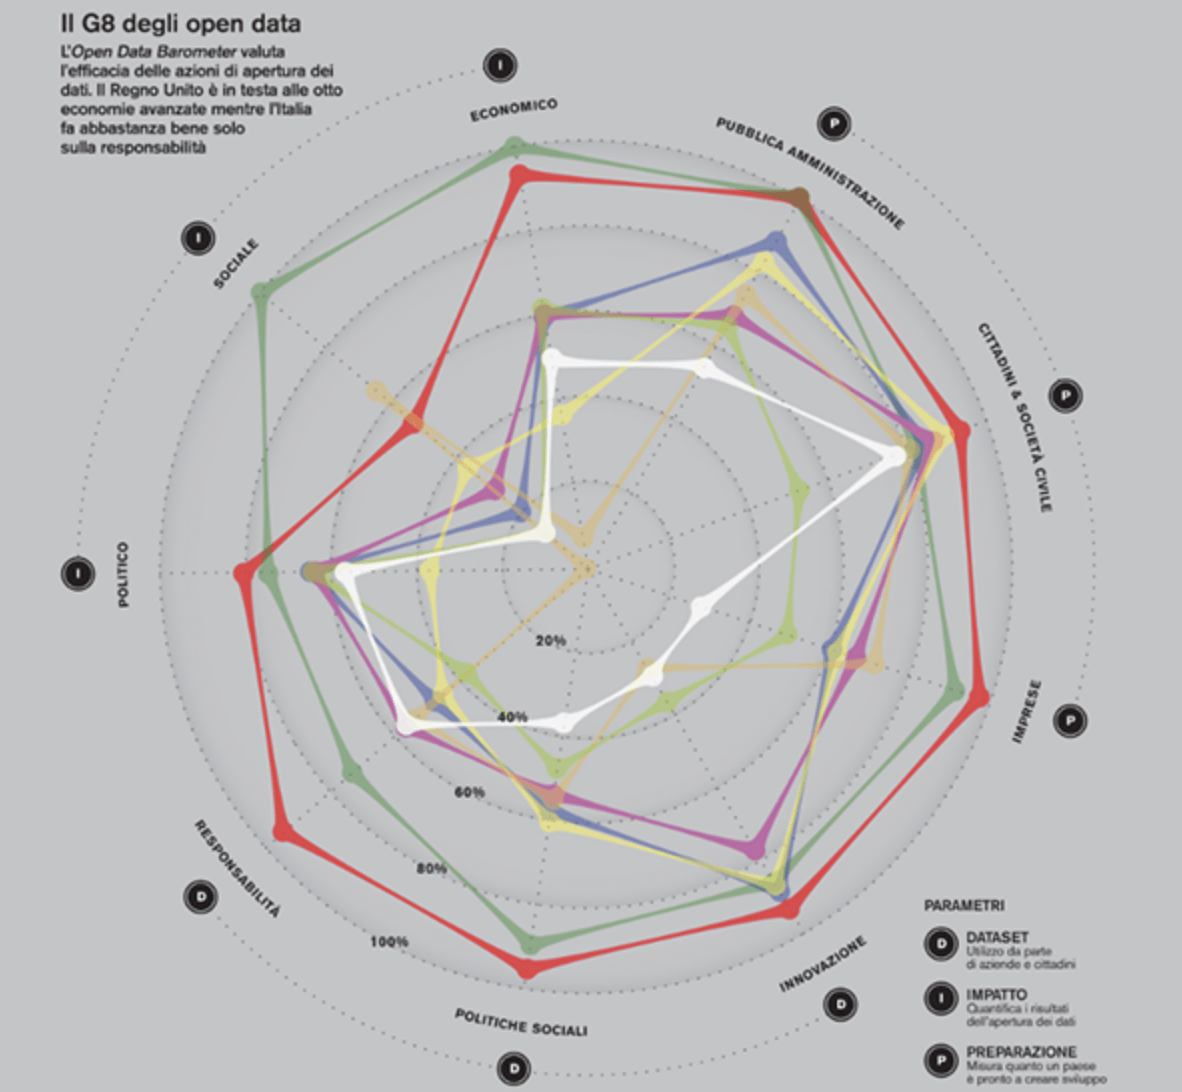
Radar Diagram
Also called: Web Chart, Spider Chart, Star Chart, Star Plot, Cobweb Chart
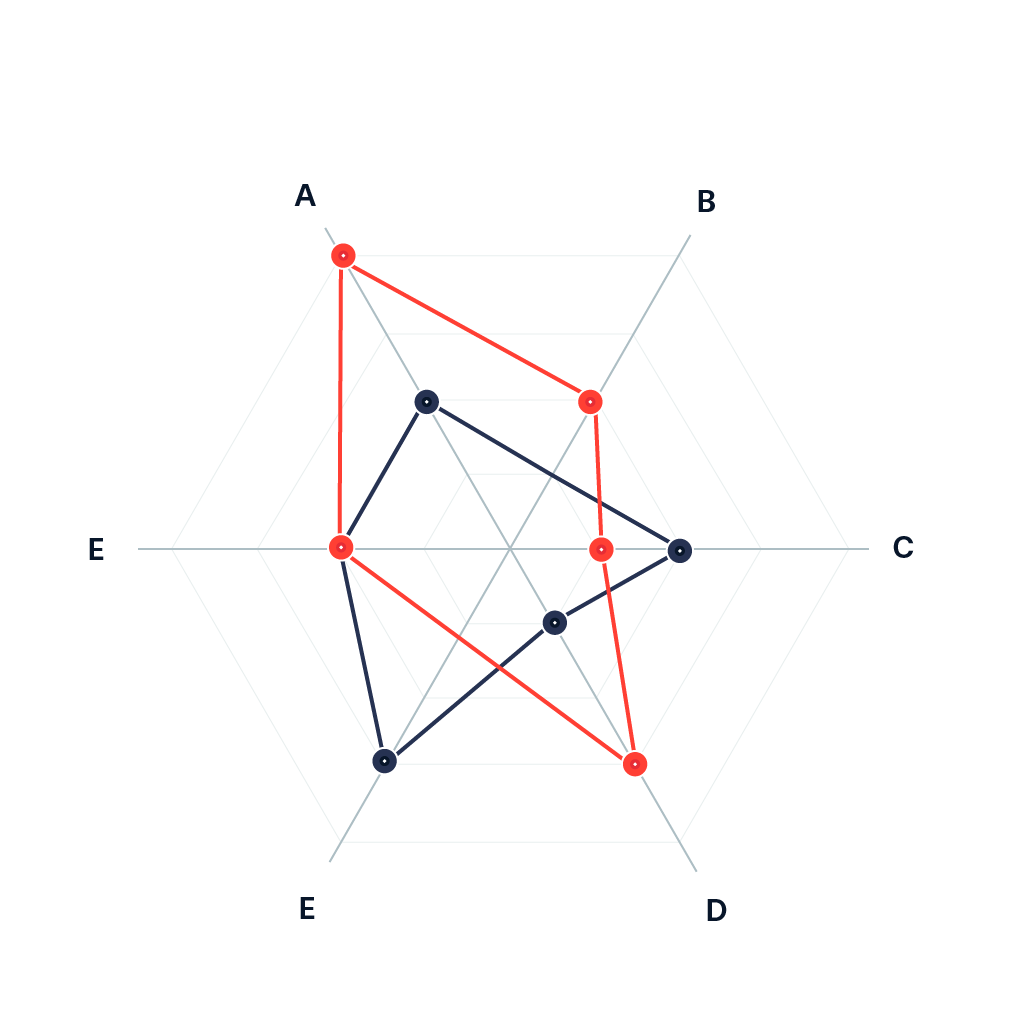
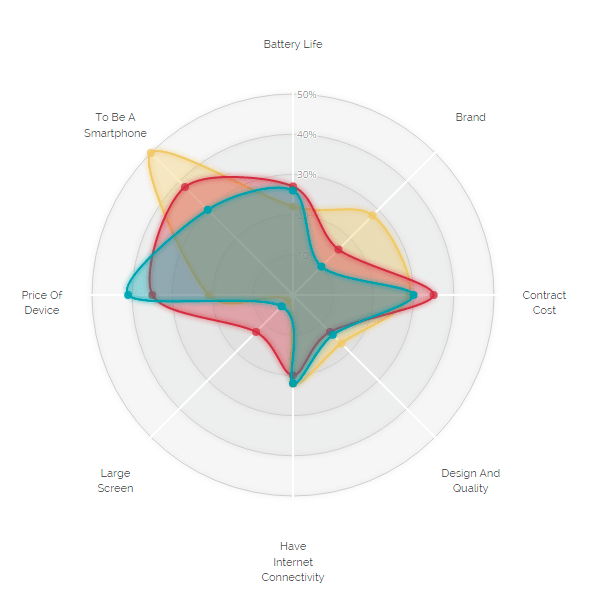
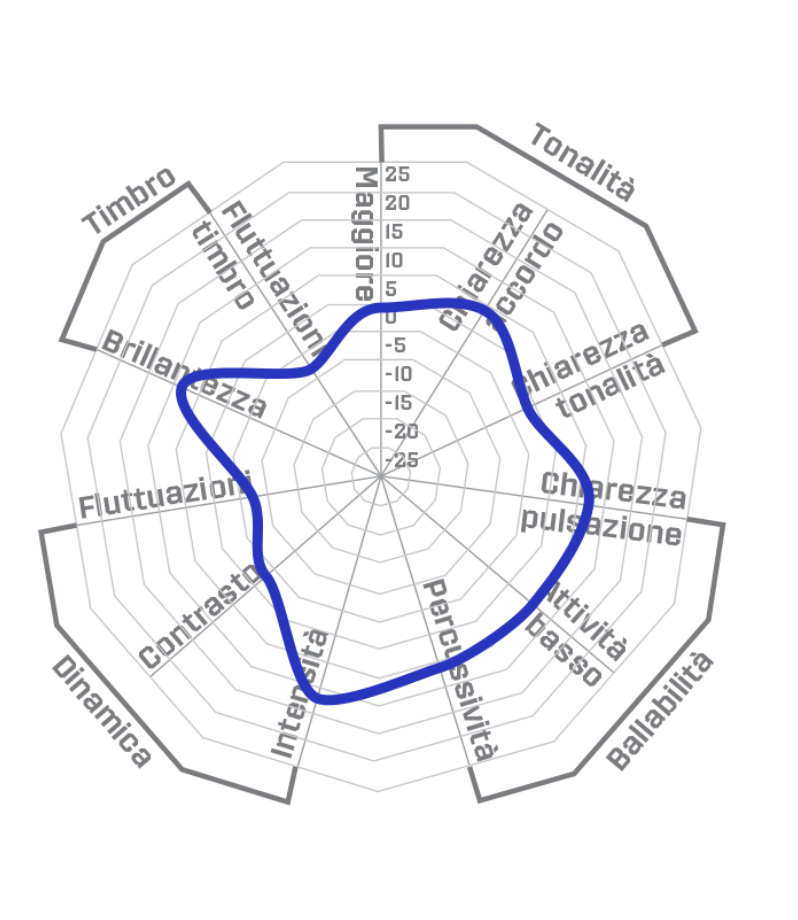
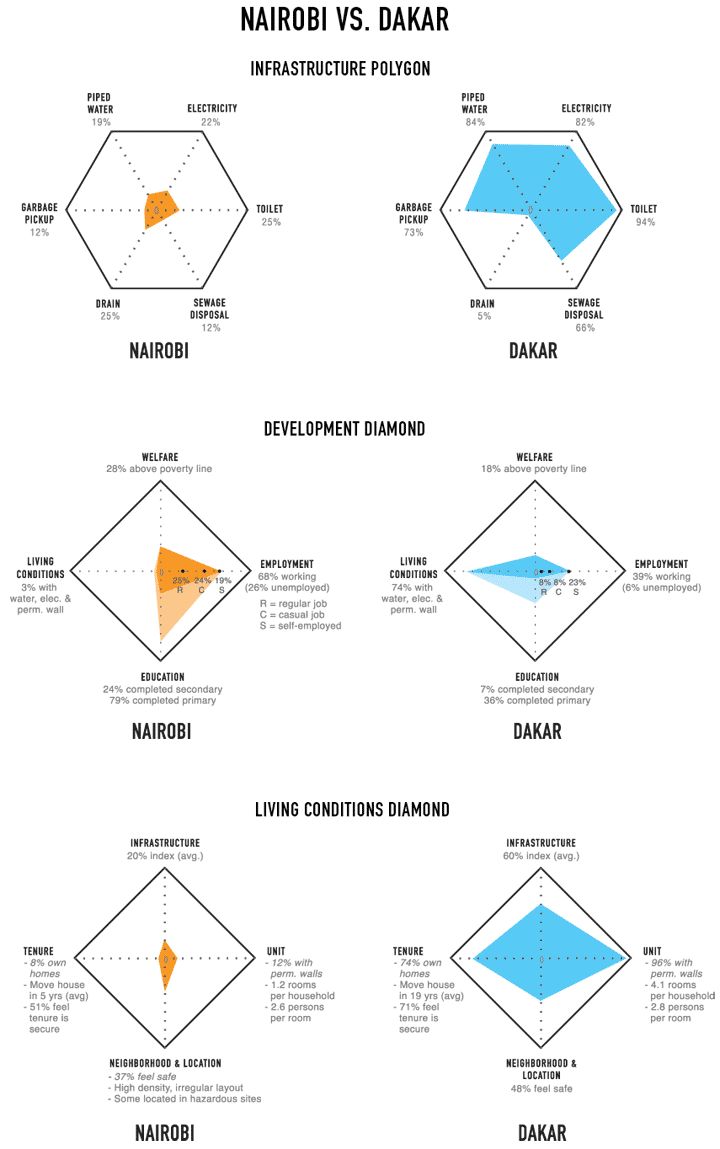
A radar chart is a graphical method of displaying multivariate data in the form of a two-dimensional chart of three or more quantitative variables represented on axes starting from the same point. The relative position and angle of the axes is typically uninformative.