Pyramid Chart
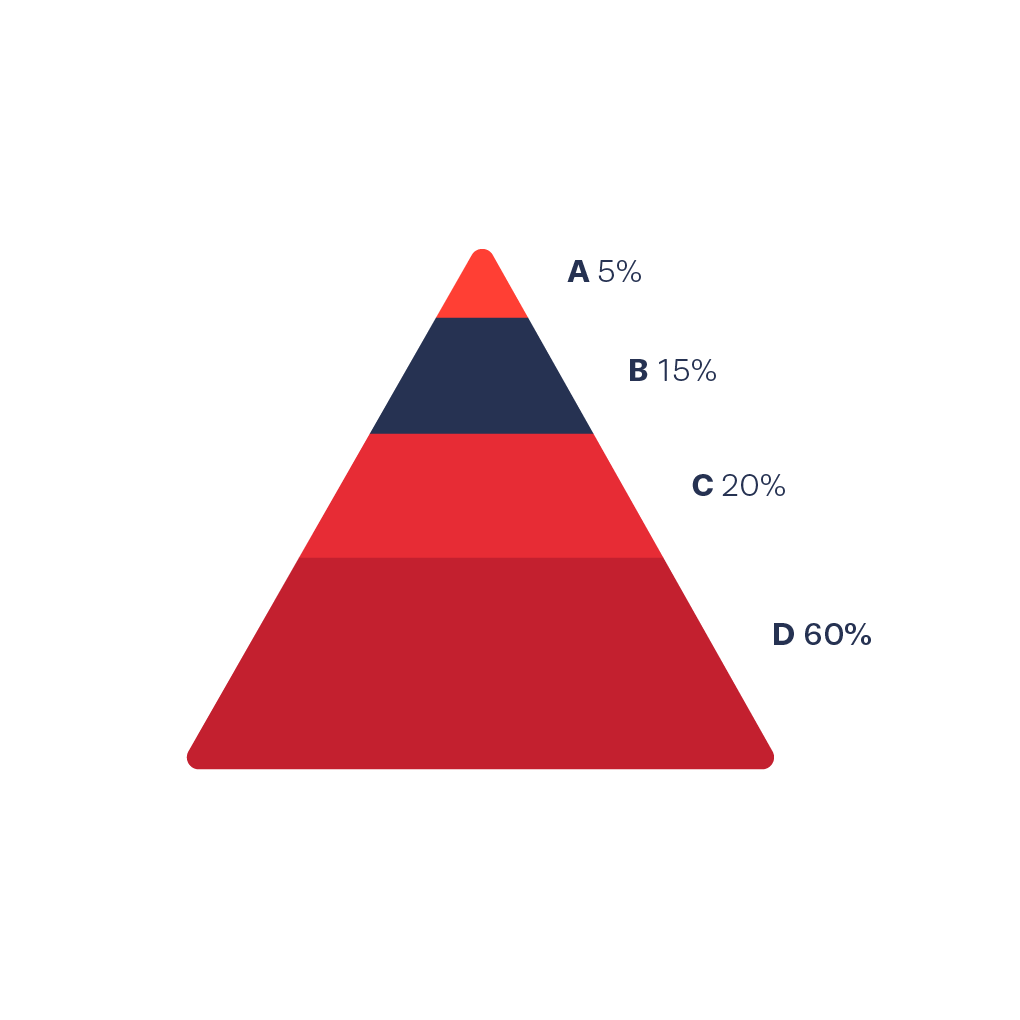
A pyramid chart is an inverted funnel chart. Similar to a funnel chart, the pyramid chart is a single series chart which does not use an axis. It represents data as portions of a 100% (the individual segments add up to represent a whole).